# 2025 MOZ Price Prediction: Expert Analysis and Market Forecast for the Coming Year
## Article Overview
This comprehensive analysis examines Lumoz (MOZ), a leading modular compute layer and ZK-RaaS platform, providing professional price forecasts and investment strategies through 2031. The report combines historical price analysis, market dynamics, ecosystem developments, and risk assessment to guide investors in understanding MOZ's valuation trajectory. Covering current market status, supply mechanisms, institutional backing, and detailed price predictions across six years, this guide addresses the critical information gaps for both novice and experienced investors evaluating MOZ on Gate. Whether you seek long-term accumulation strategies or active trading approaches, this analysis delivers data-driven insights and practical risk management frameworks for MOZ investment decisions.
Introduction: MOZ's Market Position and Investment Value
Lumoz (MOZ) serves as the leading Modular Compute Layer & RaaS platform, providing computing power and verification services for ZK and AI applications across chains with different architectures. As of January 2026, MOZ has achieved a market capitalization of $163,790, with a circulating supply of approximately 1.1 billion tokens, trading at around $0.0001489 per token. This innovative asset is playing an increasingly critical role in the modular computation and decentralized verification sectors.
This article will comprehensively analyze MOZ's price trajectory from 2026 through 2031, integrating historical patterns, market supply-demand dynamics, ecosystem development, and macroeconomic factors to provide investors with professional price forecasts and practical investment strategies.
Lumoz (MOZ) Market Analysis Report
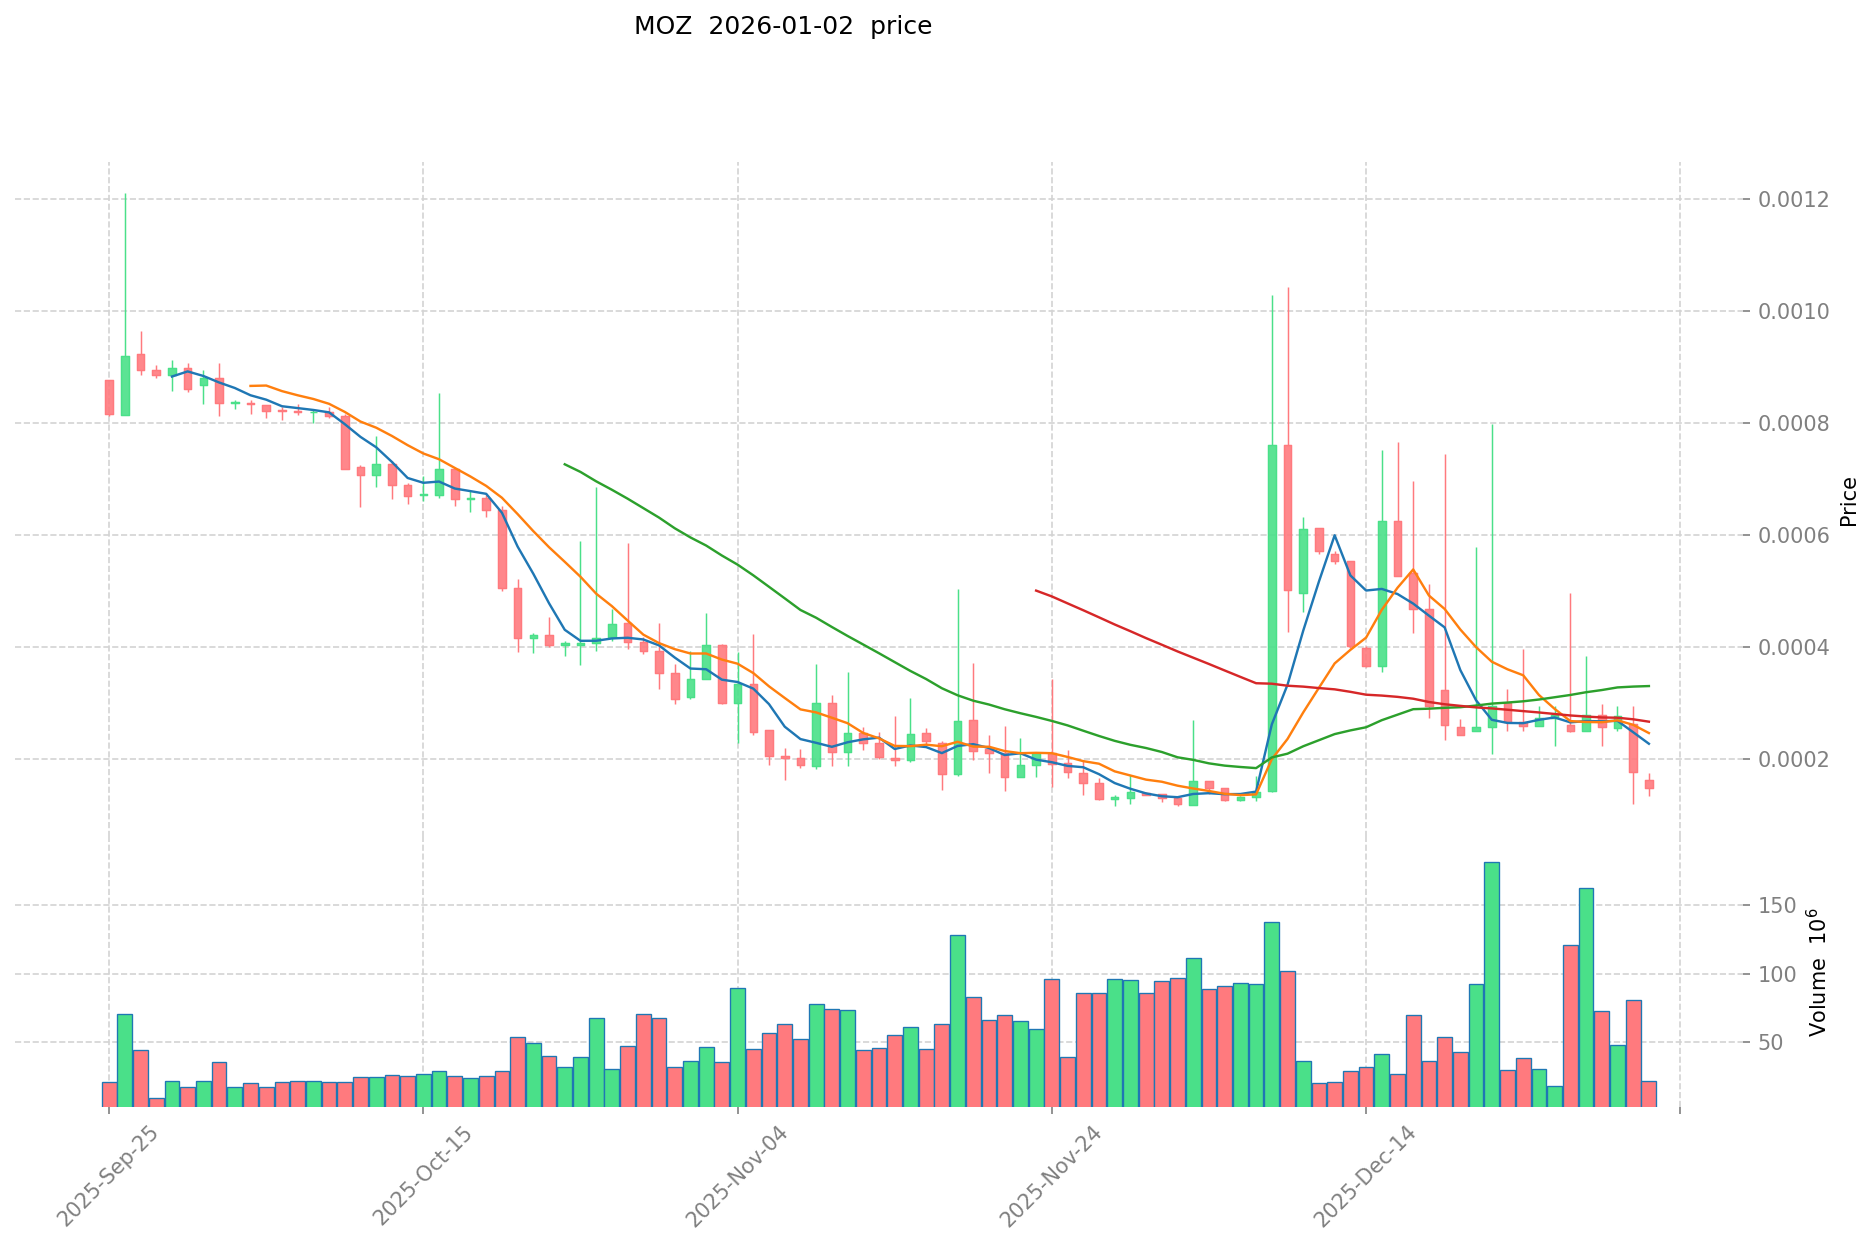
I. MOZ Price History Review and Market Status
MOZ Historical Price Evolution
Based on available data, Lumoz (MOZ) has experienced significant price volatility since its launch:
- December 10, 2024: All-time high (ATH) of $0.05748, representing peak market enthusiasm for the project.
- December 2, 2025: All-time low (ATL) of $0.0001162, marking the lowest valuation point in the token's history.
- Current Period (January 2, 2026): Substantial decline of approximately 99.07% from launch, with the token trading at $0.0001489.
MOZ Current Market Status
As of January 2, 2026, MOZ presents a challenging market profile:
Price Performance:
- Current Price: $0.0001489
- 24-Hour Change: -7.11%
- 7-Day Change: -49.47%
- 30-Day Change: +23.16%
- 1-Year Change: -99.070%
Market Capitalization Metrics:
- Market Cap: $163,790.00
- Fully Diluted Valuation (FDV): $1,489,000.00
- Market Cap to FDV Ratio: 11%
- 24-Hour Trading Volume: $1,953.35
- Market Dominance: 0.000046%
Supply Dynamics:
- Circulating Supply: 1,100,000,000 MOZ (11% of total supply)
- Total Supply: 10,000,000,000 MOZ
- Token Holders: 19,830
Trading Range (24-Hour):
- High: $0.0001752
- Low: $0.0001344
MOZ is currently ranked #4,364 by market capitalization. The token trades on limited exchanges (2 platforms), with Gate.com providing trading access. The significant disconnect between the all-time high and current price reflects substantial market correction, while the recent 7-day decline of -49.47% suggests ongoing downward pressure despite the modest 30-day gain of 23.16%.
Click to view current MOZ market price
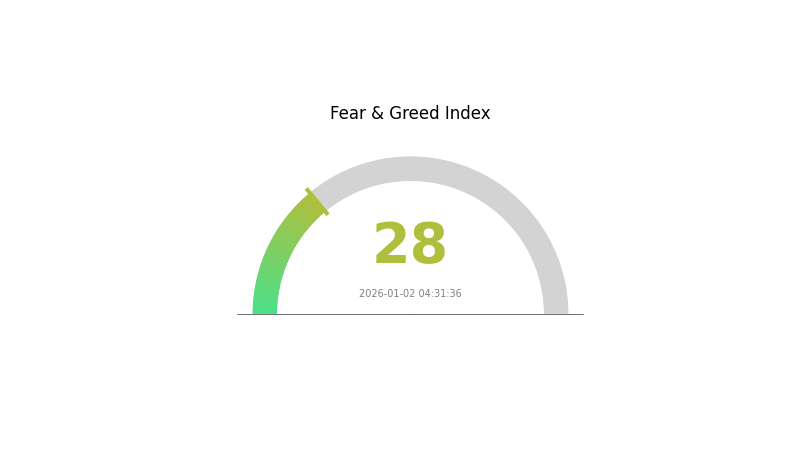
MOZ Market Sentiment Indicator
2026-01-02 Fear and Greed Index: 28 (Fear)
Click to view current Fear & Greed Index
The crypto market is currently experiencing a fear phase, with the index standing at 28. This indicates that investors are cautious and risk-averse in their market positioning. During periods of heightened fear, market volatility typically increases as participants reduce exposure to digital assets. Investors should exercise prudent risk management and avoid making emotionally-driven decisions. Such market conditions can present opportunities for long-term investors to accumulate assets at lower valuations. Monitor key support levels and maintain diversified portfolio strategies on Gate.com.
MOZ Holdings Distribution
The address holdings distribution chart illustrates the concentration of MOZ tokens across the blockchain network by tracking the top token holders and their respective ownership percentages. This metric serves as a critical indicator of token decentralization, market structure, and potential vulnerability to price manipulation or coordinated selling pressure.
MOZ currently exhibits a significantly concentrated ownership structure, with the top five addresses collectively controlling 88.92% of all circulating tokens. The dominant holder at position one accounts for exactly 50.00% of total holdings, representing an exceptionally high concentration level that raises concerns about centralization risks. The second and third largest holders contribute an additional 12.37% and 11.83% respectively, while the fourth and fifth positions hold 9.72% and 5.00%. Only 11.08% of tokens are distributed among all remaining addresses, indicating a highly fragmented tail end of the holder distribution.
This pronounced concentration pattern presents notable implications for market dynamics and governance stability. The single majority holder possesses sufficient capital to materially influence price movements through concentrated trading activity, creating asymmetric risks for minority stakeholders. The top five addresses function as de facto controlling entities over the protocol, with their coordinated actions capable of triggering significant volatility or liquidity challenges. While such concentration may reflect early-stage token distribution or strategic holdings by development teams and institutional investors, it substantially diminishes the decentralized nature of the token ecosystem and may hinder long-term market maturity and price stability.
Click to view current MOZ Holdings Distribution
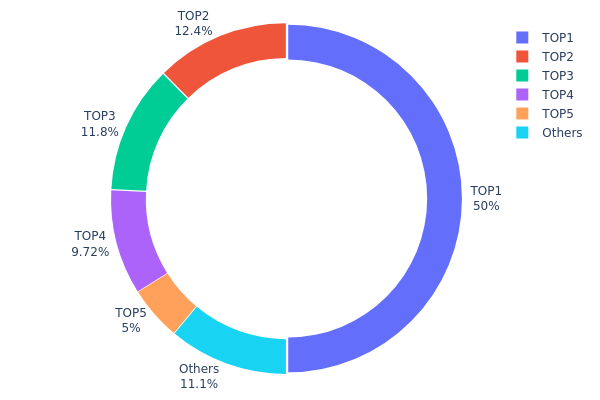
| Top |
Address |
Holding Qty |
Holding (%) |
| 1 |
0x7210...b45e98 |
5000000.00K |
50.00% |
| 2 |
0xa4f8...12a060 |
1237250.00K |
12.37% |
| 3 |
0xf89d...5eaa40 |
1183124.11K |
11.83% |
| 4 |
0xdc8f...4e6803 |
972500.00K |
9.72% |
| 5 |
0xd0f5...a27f31 |
500000.00K |
5.00% |
| - |
Others |
1107125.89K |
11.08% |
II. Core Factors Influencing MOZ's Future Price
Supply Mechanism
- Dual Token Model: Lumoz operates a dual token system consisting of MOZ and esMOZ. MOZ tokens are used to pay network gas fees, and are required for payment when using ZKP computation and AI services as resource usage fees. esMOZ serves as a network incentive token awarded to nodes (including zkProver and zkVerifier nodes) that provide computing power, security, and stability to the Lumoz network, and also functions as a staking and decentralized governance token.
Technology Development and Ecosystem Construction
-
ZK-Rollup Infrastructure: Lumoz is a leading modular compute layer and ZK-RaaS (Zero-Knowledge Rollup as a Service) platform that utilizes PoW mining mechanisms to effectively provide computational power for Rollups, ZK-ML, and ZKP verification. The platform has integrated the previously fragmented ZK-Rollups landscape and optimized its construction, while creating a streamlined deployment process for ZK-Rollups.
-
Decentralized Prover Network: Lumoz provides a decentralized Prover Network that supplies underlying computational power for general-purpose ZKP computation. The platform further opens the verification layer to ordinary users through its zkVerifier, which aims to achieve decentralized verification and can effectively reduce L2 gas costs.
-
ZK-Rollup Launchbase: Through its no-code ZK-Rollup Launchbase, any user can generate customized zkEVM application chains without requiring coding knowledge. This enables developers to deploy their ZK-Rollups across multiple chains with a single click, facilitating large-scale deployment of zkEVM-based application chains.
Institutional and Major Holder Dynamics
- Strategic Financing: Lumoz completed Pre-A round and strategic financing in the first half of the year, accumulating a total of $14 million in funding, with the latest round valued at $300 million. Participating institutions include HashKey Capital, IDG, Web3port, and Polygon, indicating strong institutional confidence in the project's development potential.
III. MOZ Price Forecast for 2026-2031
2026 Outlook
- Conservative Forecast: $0.00009-$0.00015
- Neutral Forecast: $0.00015
- Bullish Forecast: $0.00021 (requires sustained market interest and ecosystem development)
2027-2029 Mid-term Outlook
- Market Phase Expectations: Consolidation period with gradual accumulation phase, characterized by increasing institutional interest and platform adoption
- Price Range Predictions:
- 2027: $0.00014-$0.00026 (19% potential upside)
- 2028: $0.00021-$0.00030 (46% potential upside)
- 2029: $0.00021-$0.00030 (72% potential upside)
- Key Catalysts: Enhanced tokenomics implementation, increased platform utility, strategic partnerships, and growing community engagement
2030-2031 Long-term Outlook
- Base Case: $0.00016-$0.00034 (88% appreciation potential, assuming steady ecosystem growth and moderate market expansion)
- Bullish Case: $0.00028-$0.00034 (109% appreciation potential, contingent on major protocol upgrades and significant user base expansion)
- Transformative Case: Above $0.00034 (extreme scenario requiring breakthrough technological advancement and mainstream adoption acceleration)
- 2026-01-02: MOZ trading at baseline levels with consolidation phase underway
| 年份 |
预测最高价 |
预测平均价格 |
预测最低价 |
涨跌幅 |
| 2026 |
0.00021 |
0.00015 |
0.00009 |
0 |
| 2027 |
0.00026 |
0.00018 |
0.00014 |
19 |
| 2028 |
0.0003 |
0.00022 |
0.00021 |
46 |
| 2029 |
0.0003 |
0.00026 |
0.00021 |
72 |
| 2030 |
0.00034 |
0.00028 |
0.00016 |
88 |
| 2031 |
0.00032 |
0.00031 |
0.00017 |
109 |
MOZ Professional Investment Strategy and Risk Management Report
IV. MOZ Professional Investment Strategy and Risk Management
MOZ Investment Methodology
(1) Long-term Hold Strategy
- Suitable Investors: Believers in modular compute layer technology and ZK/AI application development
- Operational Suggestions:
- Accumulate MOZ tokens during market downturns, particularly after significant price corrections
- Hold tokens for 12-24 months to capture potential upside as Lumoz protocol adoption increases
- Participate in staking or protocol governance if available to generate additional returns
(2) Active Trading Strategy
- Technical Analysis Tools:
- Support and Resistance Levels: Monitor the 24H trading range ($0.0001344 - $0.0001752) and historical support at $0.0001162
- Moving Averages: Apply 7-day and 30-day moving averages to identify trend direction given the -49.47% 7-day decline
- Trading Focus Points:
- Execute limit buy orders near established support levels during market weakness
- Set profit targets at key resistance levels or during recovery rallies
- Monitor trading volume trends, as current 24H volume ($1,953.35) indicates relatively low liquidity
MOZ Risk Management Framework
(1) Asset Allocation Principles
- Conservative Investors: 1-2% portfolio allocation
- Active Investors: 3-5% portfolio allocation
- Professional Investors: 5-10% portfolio allocation
(2) Risk Hedging Solutions
- Position Sizing: Limit single MOZ position to no more than 5% of total crypto holdings to mitigate concentration risk
- Diversification Strategy: Combine MOZ holdings with established Layer 1 and Layer 2 tokens to reduce volatility exposure
- Stop-Loss Implementation: Set stop-loss orders at 15-20% below entry price to manage downside risk
(3) Secure Storage Solutions
- Custody Solutions: Gate.com Web3 Wallet for convenient access and trading integration with staking features
- Self-Custody Approach: For larger holdings, transfer tokens to secure offline storage with multi-signature capabilities
- Security Considerations: Enable two-factor authentication on all exchange accounts, use hardware-backed key management, and maintain backup recovery phrases in secure locations
V. MOZ Potential Risks and Challenges
MOZ Market Risk
- High Volatility: MOZ has experienced extreme price fluctuation, declining 99.07% over the past year from $0.005 launch price to current $0.0001489, indicating substantial market risk and potential for further losses
- Low Liquidity: With only 2 exchanges listed and 24H trading volume of $1,953.35, low liquidity creates challenges for position entry/exit and increases slippage risk
- Market Sentiment: Significant price decline and -49.47% 7-day drop suggest negative market sentiment and reduced investor confidence
MOZ Regulatory Risk
- Emerging Protocol Status: As a relatively new modular compute layer platform, regulatory classification of MOZ and Lumoz protocol services remains uncertain across different jurisdictions
- Compliance Uncertainty: ZK and AI-focused protocols may face evolving regulatory scrutiny as governments develop frameworks for cryptographic proofs and artificial intelligence applications
- Jurisdictional Variation: Different countries may implement varying regulatory requirements affecting MOZ token utility, trading, and protocol operations
MOZ Technical Risk
- Protocol Maturity: As a modular compute layer, Lumoz protocol may face technical challenges during scaling, security audits, or integration with diverse blockchain architectures
- Smart Contract Vulnerability: ZK and AI verification mechanisms require complex cryptographic implementations subject to potential exploits or bugs
- Cross-Chain Compatibility: Supporting "chains with different architectures" introduces technical complexity and potential integration failures
VI. Conclusion and Action Recommendations
MOZ Investment Value Assessment
Lumoz positions itself as a leading modular compute layer and RaaS platform providing computing power and verification services for ZK and AI applications. However, the token faces significant challenges: a devastating 99% decline from launch price, extremely low trading liquidity across only 2 exchanges, and minimal market capitalization of $163,790. While the underlying technology concept of supporting ZK and AI applications across multiple blockchain architectures has merit, the current market dynamics suggest extreme caution. The -49.47% 7-day decline and -7.11% 24-hour drop indicate sustained negative momentum.
MOZ Investment Recommendations
✅ Beginners: Avoid MOZ as a primary investment. If interested in modular compute layer exposure, conduct extensive research on Lumoz protocol development progress, partnerships, and mainnet adoption metrics before any allocation.
✅ Experienced Investors: Consider MOZ only as a high-risk speculation position (1-2% maximum allocation) if you believe in long-term modular compute paradigm shifts. Require clear milestones: increased exchange listings, protocol upgrades, measurable TVL growth, or strategic partnerships to justify continued holding.
✅ Institutional Investors: Exercise extreme caution given the micro-cap status, minimal market depth, and concentrated holder base of 19,830 addresses. Due diligence should include direct protocol assessment, team verification, and independent security audits before any institutional consideration.
MOZ Trading Participation Methods
- Trading on Gate.com: MOZ is available for spot trading on Gate.com, allowing direct token purchases with major trading pairs; use the platform's charting tools and limit orders for disciplined entry/exit
- Direct Protocol Interaction: For experienced users, interact directly with Lumoz protocol through its official documentation at docs.lumoz.org to understand compute layer mechanics
- Community Research: Follow @LumozOrg on Twitter and review official documentation to track protocol developments, updates, and adoption metrics before making investment decisions
Cryptocurrency investment carries extreme risk. This report does not constitute investment advice. Investors should make decisions based on personal risk tolerance and are strongly advised to consult professional financial advisors. Never invest more capital than you can afford to lose completely.
FAQ
MOZ reached its all-time high of $0.207574 on January 12, 2024, and subsequently declined to an all-time low of $0.00002929 on March 31, 2025, reflecting significant volatility in its market history.
What are the main factors affecting MOZ's price?
MOZ's price is primarily influenced by market demand and trading volume, overall crypto market sentiment, Bitcoin and Ethereum price movements, MOZ ecosystem development progress, strategic partnerships and announcements, regulatory changes, and investor speculation on future utility adoption.
What is the MOZ price prediction for 2024-2025?
Based on predictive analysis, MOZ is projected to trade between $0.00134 and $0.002822 in 2025, representing potential growth of approximately 117.1% under favorable market conditions. Price range may fluctuate within this band throughout the year.
What are the advantages of MOZ compared to other tokens?
MOZ allocates 66% to community and ecosystem development, fostering participation. Its 1:1 conversion ratio between MOZ and esMOZ enhances flexibility. MOZ serves as transaction fuel and resource fees, improving efficiency.
What are the risks and uncertainties in MOZ price predictions?
MOZ price predictions face uncertainties from market volatility, technological changes, and adoption dynamics. Factors like network activity, trading volume, and overall crypto sentiment significantly impact price movements, making predictions inherently uncertain.
How to analyze and predict the future price movement of MOZ?
Analyze MOZ using technical indicators like 50-day and 200-day moving averages, RSI (14), and Stochastic RSI. Monitor trading volume and market sentiment. Based on technical analysis, MOZ may fluctuate between $0.000221 and $0.001382, with potential 259.56% growth by 2032. Short and long-term signals indicate buy positions.
* The information is not intended to be and does not constitute financial advice or any other recommendation of any sort offered or endorsed by Gate.