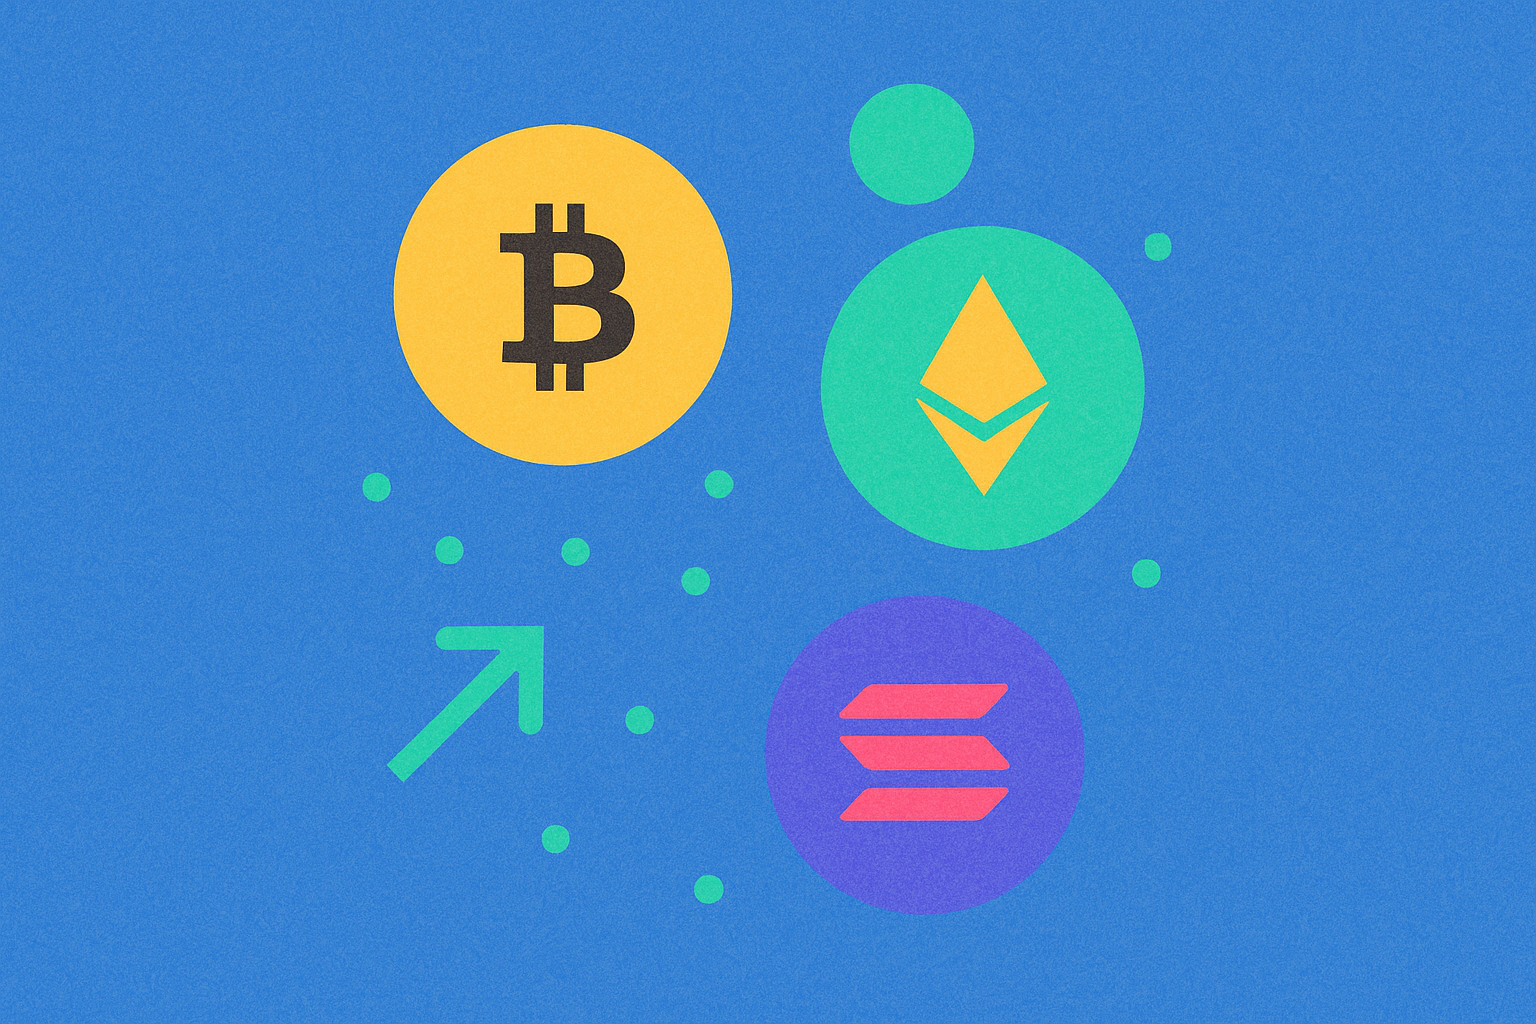
This comprehensive guide analyzes how top blockchain networks compete across three critical dimensions in 2026. Bitcoin prioritizes security with ~7 TPS, Ethereum enhances performance through layer-2 solutions achieving ~10,000 TPS, while Solana leads in throughput at ~65,000 TPS. Market cap analysis reveals Bitcoin and Ethereum dominating with over 60% combined market share, though emerging networks gain traction. User adoption metrics show Ethereum leading with 1.2M daily active addresses, followed by Solana and Polygon, reflecting genuine engagement patterns through active address growth and transaction volume. The competitive landscape demonstrates distinct differentiation strategies: Bitcoin maintains immutability focus, Ethereum balances scalability with decentralization, and Solana emphasizes throughput efficiency. Emerging networks focusing on interoperability through platforms like Enso and Layer-2 solutions on Gate capture significant market share by offering superior composability and cross-chain f
Transaction speed, throughput, and energy efficiency have become critical differentiators in the cryptocurrency competitive analysis landscape, directly influencing user adoption and network scalability in 2026. Bitcoin remains the industry benchmark for security and decentralization but operates with significant throughput limitations, processing approximately 7 transactions per second with higher energy consumption per transaction due to its proof-of-work consensus mechanism. Ethereum has enhanced its performance metrics substantially through layer-2 solutions and protocol upgrades, now achieving considerably faster transaction speeds while reducing energy requirements compared to earlier implementations.
Solana distinguishes itself through exceptional throughput capabilities, regularly processing thousands of transactions per second, making it attractive for high-frequency applications and demonstrating superior performance metrics in this dimension. However, the network has faced occasional stability challenges that impact its competitive positioning. Energy efficiency has become increasingly important as environmental concerns shape blockchain network adoption; Ethereum's transition to proof-of-stake significantly reduced its energy consumption, while Solana's proof-of-history mechanism maintains relatively low energy requirements despite high throughput.
These performance metrics directly affect network competitiveness in 2026's evolving landscape. Bitcoin prioritizes immutability over speed, Ethereum balances decentralization with improved performance through scaling solutions, and Solana emphasizes throughput efficiency. Understanding these distinctions helps stakeholders evaluate which blockchain network aligns with specific use-case requirements, whether prioritizing transaction finality, processing capacity, or environmental sustainability in the competitive cryptocurrency ecosystem.
Market dominance analysis: market cap rankings and valuation trends among leading blockchain networks
Market capitalization serves as a fundamental indicator of blockchain network dominance, providing investors and developers with crucial insights into relative valuations across competing ecosystems. The market cap rankings among leading blockchain networks reveal significant disparities in how the cryptocurrency market allocates capital based on perceived utility and adoption potential. Enso, currently ranked #938 by market capitalization at approximately $17.2 million, exemplifies how specialized blockchain networks carve out their market niches. The valuation trends in blockchain networks reflect broader market sentiment regarding technological innovation and user adoption trajectories. Networks with substantial market caps command greater resources for development and ecosystem expansion, reinforcing their competitive positions. Analyzing these rankings illuminates how market dominance correlates with network maturity, security infrastructure, and developer engagement. The fully diluted valuation metric provides additional context for assessing long-term value potential beyond current circulating supply. Recent market cap volatility demonstrates how blockchain valuations respond to technological upgrades, regulatory developments, and macroeconomic factors. Understanding these valuation dynamics enables stakeholders to identify emerging trends and competitive shifts within the broader cryptocurrency landscape, informing strategic decisions about blockchain platform selection and investment allocation.
User adoption differential: active address growth, transaction volume, and ecosystem development across competing chains
Measuring user adoption across competing blockchain networks requires examining several interconnected metrics that reveal genuine engagement patterns. Active address growth serves as a primary indicator, tracking the number of unique addresses participating in transactions over specific periods. This metric provides insight into whether networks are attracting new participants or simply concentrating activity among existing users. Networks demonstrating sustained increases in active addresses typically indicate expanding user bases and growing confidence in their ecosystems.
Transaction volume complements active address metrics by measuring the actual economic activity occurring on each chain. Higher transaction volumes suggest networks facilitate meaningful use cases and attract users beyond speculative trading. When analyzing competing chains, researchers observe significant variance in transaction patterns—some networks prioritize throughput while others emphasize security or specific application types. Ecosystem development directly influences both metrics, as mature ecosystems with diverse applications, developer tools, and infrastructure attract more participants and generate greater activity. Networks supporting numerous decentralized applications, institutional integrations, and cross-chain bridges demonstrate stronger user retention and network effects. For instance, platforms supporting 30 or more exchange listings indicate substantial ecosystem maturity and accessibility. These three dimensions—active address growth, transaction volume, and ecosystem development—collectively determine which blockchain networks establish dominant positions in 2026's competitive landscape, where adoption differential directly correlates with long-term viability and market relevance.
Competitive positioning: identifying differentiation strategies and market share shifts in the blockchain landscape
Blockchain networks in 2026 employ distinct differentiation strategies to carve out their positions in an increasingly crowded competitive landscape. The competitive positioning of major platforms revolves around several core approaches. Some networks prioritize interoperability and composability, enabling developers to build applications that span multiple blockchains—a strategy exemplified by platforms like Enso, which focuses on connecting all blockchains through a unified network. Others emphasize scalability advantages, lower transaction costs, or specialized use cases targeting particular industries or user demographics.
These differentiation strategies directly influence market share dynamics across the blockchain landscape. Networks that successfully demonstrate technological superiority or superior user experience attract more developers and capital, strengthening their market position. Market cap and user adoption metrics reflect this competition, with platforms showing 20-50% volatility as investors evaluate which differentiation approaches prove most viable long-term. The market share shifts reveal that interoperability-focused networks and those emphasizing developer composability are gaining traction, as enterprises and advanced users increasingly value cross-chain functionality. Conversely, platforms competing solely on transaction speed or cost face pressure from multiple competitors offering similar benefits. This competitive positioning evolution demonstrates that sustainable differentiation now requires ecosystem depth, developer accessibility, and strategic integration capabilities rather than isolated technical improvements alone.
FAQ
Bitcoin maintains ~7 TPS with higher fees ($5-50). Ethereum upgraded to ~10,000 TPS with layer 2s at $0.10-1. Solana processes ~65,000 TPS with fees under $0.01. Newer networks like Aptos reach 160,000+ TPS. Performance increasingly depends on layer 2 solutions and network optimization strategies.
Which blockchain networks currently have the largest market capitalization? What are their market share and growth trends?
Bitcoin and Ethereum dominate with over 60% combined market share in 2026. Bitcoin leads at ~$2.8T, Ethereum at ~$1.2T. Solana, Cardano, and Polkadot follow. Growth trends show Bitcoin steady, Ethereum gaining adoption through Layer 2s, with emerging chains growing rapidly in specific sectors.
How do user adoption rates and active addresses compare across major blockchains like Ethereum, Solana, and Polygon?
Ethereum leads with 1.2M daily active addresses, followed by Solana at 850K and Polygon at 680K. Ethereum dominates in total users and transaction value, while Solana excels in transaction speed and cost efficiency. Polygon captures significant adoption through DeFi and gaming applications.
What are the differences in developer ecosystems and DApp quantities across different blockchain networks? Which ecosystem is most active?
Ethereum leads with 8,000+ DApps and the largest developer base, while Solana has 1,500+ DApps with fastest growth. Polygon and Arbitrum show strong activity in scaling solutions. Ethereum remains most active due to mature tooling and liquidity, though Solana gains momentum in gaming and trading sectors throughout 2026.
How will the blockchain competitive landscape evolve in 2026? Which emerging networks are likely to rise?
By 2026, Bitcoin and Ethereum maintain dominance, but Layer-2 solutions and specialized chains gain significant market share. Emerging networks focusing on AI integration, cross-chain interoperability, and real-world asset tokenization will surge. Solana, Polygon, and Arbitrum strengthen positions through ecosystem expansion. New entrants combining scalability with sustainability attract institutional capital and drive fragmented but robust competition.
How do Layer 2 solutions like Arbitrum and Optimism affect the competitiveness of main chains?
Layer 2 solutions enhance main chain competitiveness by reducing transaction costs and congestion while maintaining security. They enable faster transactions and higher throughput, attracting more users and applications. This strengthens the ecosystem's overall market position and adoption in 2026.
How do different blockchain networks balance security, decentralization, and scalability?
Most blockchain networks face tradeoffs: Bitcoin prioritizes security and decentralization with limited scalability. Ethereum balances all three through layer-2 solutions. Solana emphasizes scalability and speed while accepting lower decentralization. Layer-2 solutions like Arbitrum and Optimism offer high scalability with inherited security from mainchains.
* The information is not intended to be and does not constitute financial advice or any other recommendation of any sort offered or endorsed by Gate.