The article provides a comparative analysis of KAVA and DOT blockchain platforms, focusing on investment value, historical price trends, supply mechanisms, institutional adoption, and technical ecosystems. It addresses key questions investors may have about which asset is currently a better buy. The content is structured to cover price histories, market statuses, technical developments, future price projections, potential risks, and investment strategies, offering insights for both novice and experienced investors. Keywords such as "investment value," "blockchain platforms," and "market status" enhance readability and facilitate quick scanning.
Introduction: Investment Comparison of KAVA vs DOT
In the cryptocurrency market, KAVA vs DOT comparison has always been a topic that investors can't avoid. The two not only have significant differences in market cap ranking, application scenarios, and price performance, but also represent different positioning of crypto assets.
Kava (KAVA): Since its launch in 2019, it has gained market recognition for its cross-chain decentralized finance platform.
Polkadot (DOT): Introduced in 2020, it has been hailed as the "Internet of Blockchains," and is one of the cryptocurrencies with high global trading volume and market capitalization.
This article will provide a comprehensive analysis of the investment value comparison between KAVA and DOT, focusing on historical price trends, supply mechanisms, institutional adoption, technological ecosystems, and future predictions, attempting to answer the question most concerning investors:
"Which is the better buy right now?"
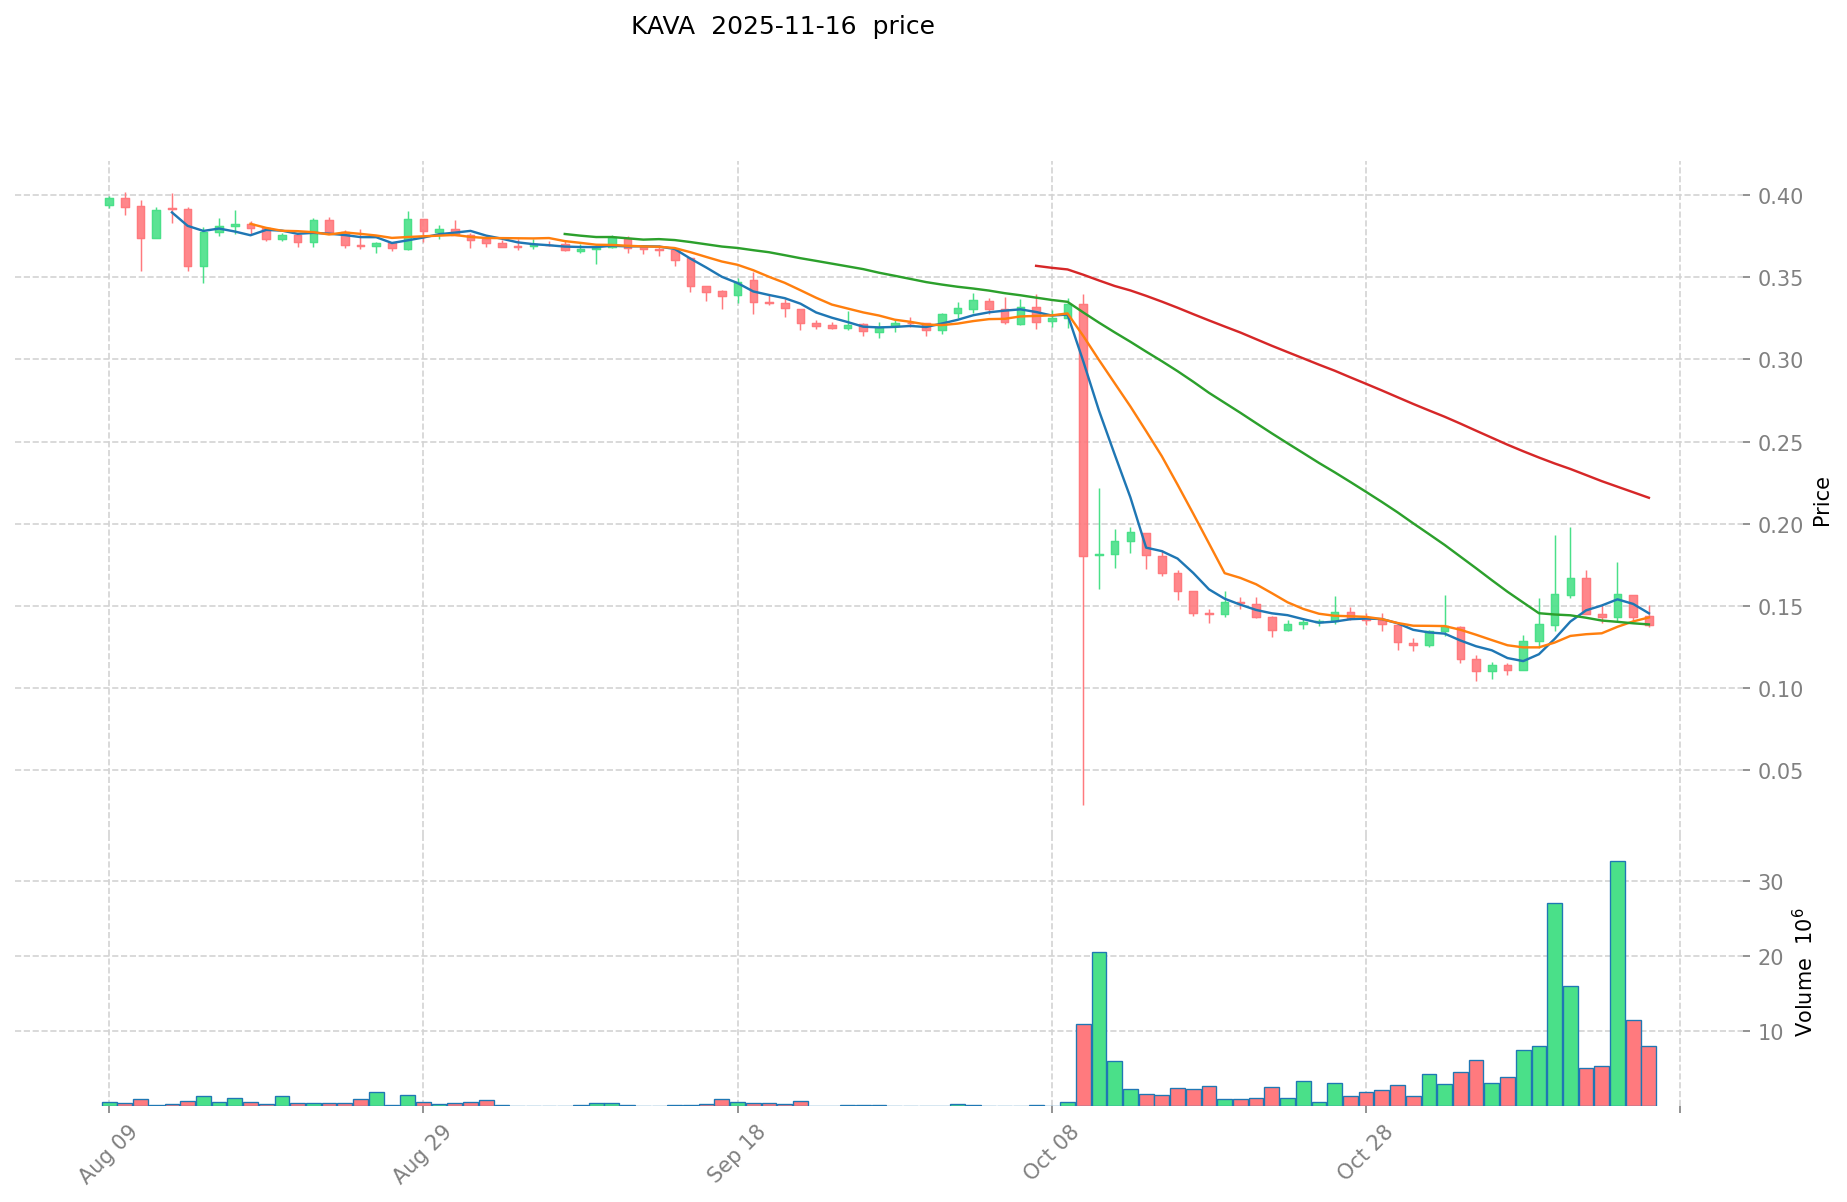
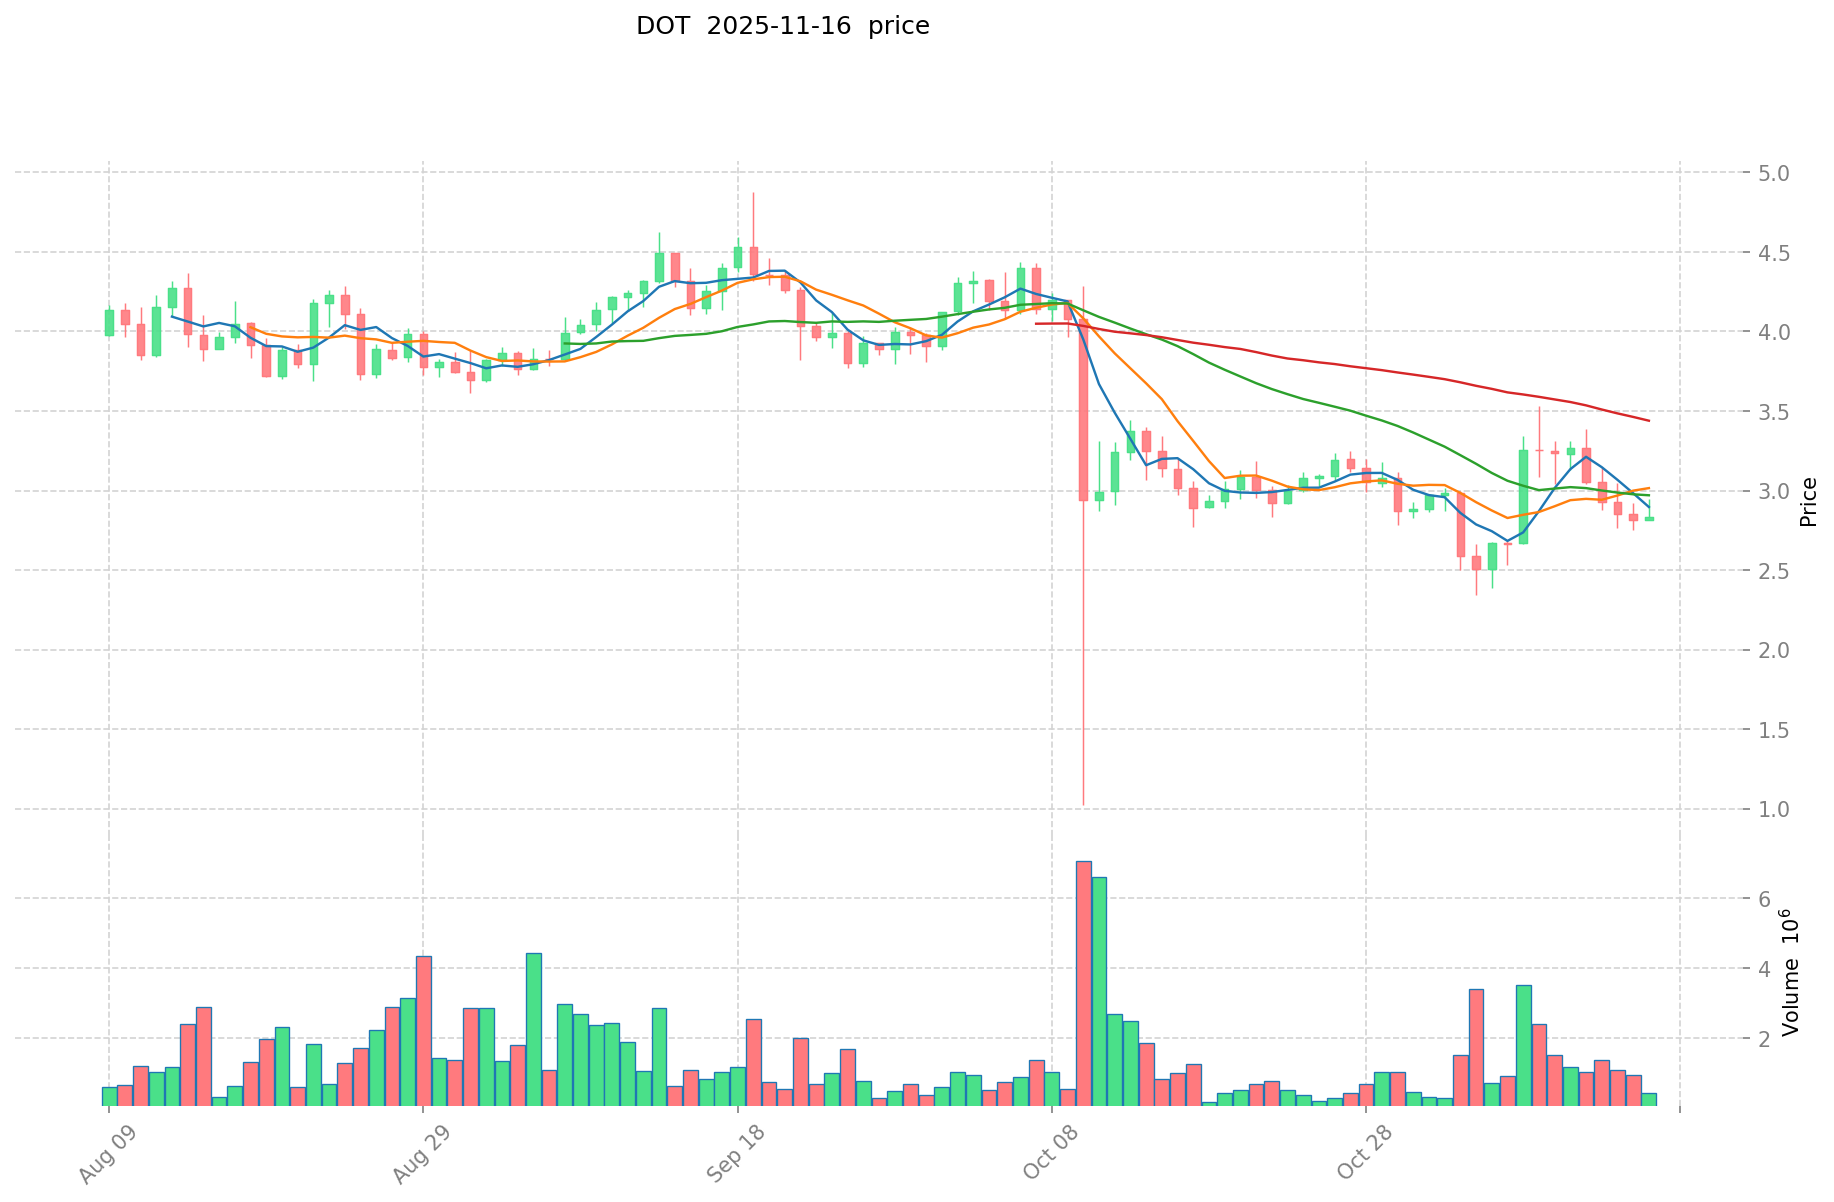
I. Price History Comparison and Current Market Status
KAVA and DOT Historical Price Trends
-
2021: DOT reached its all-time high of $54.98 on November 4, 2021, likely due to increased interest in the Polkadot ecosystem.
-
2025: KAVA hit its all-time low of $0.105588 on November 5, 2025, possibly due to broader market conditions or project-specific factors.
-
Comparative Analysis: During the market cycle, KAVA dropped from its all-time high of $9.12 to a low of $0.105588, while DOT declined from its peak of $54.98 to a current price of $2.855.
Current Market Situation (2025-11-16)
- KAVA current price: $0.13824
- DOT current price: $2.855
- 24-hour trading volume: KAVA $720,053.37 vs DOT $1,137,301.38
- Market Sentiment Index (Fear & Greed Index): 10 (Extreme Fear)
Click to view real-time prices:
- Check KAVA current price Market Price
- Check DOT current price Market Price
II. Core Factors Affecting KAVA vs DOT Investment Value
Supply Mechanism Comparison (Tokenomics)
- KAVA: Inflationary model with staking rewards, annual inflation between 3-20% based on protocol parameters
- DOT: Inflationary model with target inflation rate of 10% annually, with staking rewards to validators and nominators
- 📌 Historical pattern: Both tokens have inflationary models that incentivize staking participation, creating potential sell pressure during bear markets while encouraging long-term holding during bull markets.
Institutional Adoption and Market Applications
- Institutional holdings: Polkadot has attracted more institutional interest, with DOT featured in various crypto index funds and investment products
- Enterprise adoption: Polkadot's parachain ecosystem has gained more enterprise partnerships for cross-chain applications, while KAVA focuses on cross-chain DeFi solutions
- Regulatory attitudes: Both projects face similar regulatory scrutiny, though DOT's more decentralized governance may provide some regulatory advantages
Technical Development and Ecosystem Building
- KAVA technical upgrades: Kava 13 upgrade improved Cosmos IBC integration, enhancing cross-chain capabilities within the Cosmos ecosystem
- DOT technical development: Continuous parachain development with XCM (Cross-Consensus Messaging) functionality enabling secure cross-chain communication
- Ecosystem comparison: DOT has a more diverse ecosystem with parachains covering DeFi, identity, gaming and infrastructure, while KAVA focuses primarily on DeFi applications including lending and stablecoin issuance
Macroeconomic Factors and Market Cycles
- Performance in inflationary environments: DOT has shown slightly better resilience during inflation due to its broader ecosystem utility
- Macroeconomic monetary policy: Both tokens tend to be highly correlated with risk assets, showing sensitivity to interest rate changes and USD strength
- Geopolitical factors: DOT's global developer community and decentralized governance structure may provide more resilience to regional regulatory pressures
III. 2025-2030 Price Prediction: KAVA vs DOT
Short-term Prediction (2025)
- KAVA: Conservative $0.0787 - $0.1381 | Optimistic $0.1381 - $0.1630
- DOT: Conservative $2.1405 - $2.8540 | Optimistic $2.8540 - $3.2250
Mid-term Prediction (2027)
- KAVA may enter a growth phase, with prices expected in the range of $0.0948 - $0.2198
- DOT may enter a growth phase, with prices expected in the range of $1.7702 - $4.8680
- Key drivers: Institutional capital inflow, ETF, ecosystem development
Long-term Prediction (2030)
- KAVA: Base scenario $0.2306 - $0.3044 | Optimistic scenario $0.2306 - $0.3044
- DOT: Base scenario $4.9577 - $5.6517 | Optimistic scenario $4.9577 - $5.6517
View detailed price predictions for KAVA and DOT
Disclaimer
KAVA:
| 年份 |
预测最高价 |
预测平均价格 |
预测最低价 |
涨跌幅 |
| 2025 |
0.1630406 |
0.13817 |
0.0787569 |
0 |
| 2026 |
0.16566583 |
0.1506053 |
0.100905551 |
8 |
| 2027 |
0.21980843535 |
0.158135565 |
0.094881339 |
14 |
| 2028 |
0.23621500021875 |
0.188972000175 |
0.14928788013825 |
36 |
| 2029 |
0.248734395230343 |
0.212593500196875 |
0.206215695190968 |
53 |
| 2030 |
0.304476410981964 |
0.230663947713609 |
0.184531158170887 |
66 |
DOT:
| 年份 |
预测最高价 |
预测平均价格 |
预测最低价 |
涨跌幅 |
| 2025 |
3.22502 |
2.854 |
2.1405 |
0 |
| 2026 |
3.7689924 |
3.03951 |
1.8541011 |
6 |
| 2027 |
4.868079216 |
3.4042512 |
1.770210624 |
19 |
| 2028 |
5.08748320584 |
4.136165208 |
2.35761416856 |
44 |
| 2029 |
5.303597837958 |
4.61182420692 |
2.4442668296676 |
61 |
| 2030 |
5.65179056558046 |
4.957711022439 |
4.80897969176583 |
73 |
IV. Investment Strategy Comparison: KAVA vs DOT
Long-term vs Short-term Investment Strategy
- KAVA: Suitable for investors focused on DeFi applications and cross-chain solutions
- DOT: Suitable for investors interested in broader ecosystem development and interoperability
Risk Management and Asset Allocation
- Conservative investors: KAVA: 30% vs DOT: 70%
- Aggressive investors: KAVA: 50% vs DOT: 50%
- Hedging tools: Stablecoin allocation, options, cross-currency portfolios
V. Potential Risk Comparison
Market Risk
- KAVA: Higher volatility due to smaller market cap and lower liquidity
- DOT: Correlated with overall crypto market trends, subject to broader market sentiment
Technical Risk
- KAVA: Scalability, network stability
- DOT: Parachain auction dynamics, cross-chain security
Regulatory Risk
- Global regulatory policies may have different impacts on both tokens, with DOT potentially facing more scrutiny due to its broader ecosystem
VI. Conclusion: Which Is the Better Buy?
📌 Investment Value Summary:
- KAVA advantages: Focus on DeFi applications, potential for growth in cross-chain finance
- DOT advantages: Larger ecosystem, more institutional adoption, interoperability solutions
✅ Investment Advice:
- Novice investors: Consider DOT for its larger market cap and more established ecosystem
- Experienced investors: Diversify between KAVA and DOT based on risk tolerance and belief in respective ecosystems
- Institutional investors: Allocate more towards DOT due to its broader adoption and liquidity
⚠️ Risk Warning: The cryptocurrency market is highly volatile. This article does not constitute investment advice.
None
VII. FAQ
Q1: What are the key differences between KAVA and DOT?
A: KAVA focuses primarily on DeFi applications and cross-chain finance, while DOT has a broader ecosystem with parachains covering DeFi, identity, gaming, and infrastructure. DOT also has a larger market cap, more institutional adoption, and is considered more suitable for interoperability solutions.
Q2: Which token has performed better historically?
A: Historically, DOT has shown better performance. It reached its all-time high of $54.98 in November 2021, while KAVA's all-time high was $9.12. However, both tokens have experienced significant price declines since their peaks.
Q3: How do the supply mechanisms of KAVA and DOT compare?
A: Both KAVA and DOT have inflationary models. KAVA's annual inflation rate ranges between 3-20% based on protocol parameters, while DOT has a target inflation rate of 10% annually. Both models incentivize staking participation.
Q4: Which token is considered a better long-term investment?
A: DOT is generally considered a better long-term investment due to its larger ecosystem, more institutional adoption, and interoperability solutions. However, the choice depends on individual investment goals and risk tolerance.
Q5: What are the main risks associated with investing in KAVA and DOT?
A: Both tokens face market risks related to overall crypto market trends. KAVA has higher volatility due to its smaller market cap and lower liquidity. DOT faces risks related to parachain auction dynamics and cross-chain security. Both are subject to regulatory risks, with DOT potentially facing more scrutiny due to its broader ecosystem.
Q6: How do the 2030 price predictions for KAVA and DOT compare?
A: For 2030, KAVA's base scenario price range is predicted to be $0.2306 - $0.3044, while DOT's base scenario range is $4.9577 - $5.6517. These predictions suggest potentially higher percentage gains for KAVA, but higher absolute price levels for DOT.
Q7: How should investors allocate their portfolio between KAVA and DOT?
A: Conservative investors might consider allocating 30% to KAVA and 70% to DOT, while more aggressive investors might opt for a 50-50 split. The exact allocation should be based on individual risk tolerance and belief in the respective ecosystems.
* The information is not intended to be and does not constitute financial advice or any other recommendation of any sort offered or endorsed by Gate.


