This article offers a detailed investment comparison between Origin Protocol (OGN) and Kava (KAVA), exploring both tokens' historical price trends, supply mechanisms, and institutional adoption. It addresses key questions such as "Which is the better buy?" and provides insights into long-term vs short-term investment strategies. The article is ideal for novice, experienced, and institutional investors seeking to understand potential risks and returns of these blockchain titans in the gaming industry. Find dynamic market status updates at Gate, and explore OGN's and KAVA's unique technical ecosystems through comprehensive analysis.
Introduction: OGN vs KAVA Investment Comparison
In the cryptocurrency market, the comparison between Origin Protocol (OGN) and Kava (KAVA) has been an unavoidable topic for investors. The two not only differ significantly in market cap ranking, application scenarios, and price performance but also represent different positioning in the crypto asset space.
Origin Protocol (OGN): Launched in 2020, it has gained market recognition for its focus on decentralized finance (DeFi) and yield generation across multiple chains.
Kava (KAVA): Since its inception in 2019, it has been hailed as a cross-chain DeFi platform, providing services for mainstream digital assets.
This article will comprehensively analyze the investment value comparison between OGN and KAVA, focusing on historical price trends, supply mechanisms, institutional adoption, technological ecosystems, and future predictions, attempting to answer the question investors care about most:
"Which is the better buy right now?"
I. Price History Comparison and Current Market Status
OGN and KAVA Historical Price Trends
- 2021: OGN reached its all-time high of $3.35 on April 8, 2021.
- 2021: KAVA hit its all-time high of $9.12 on August 30, 2021.
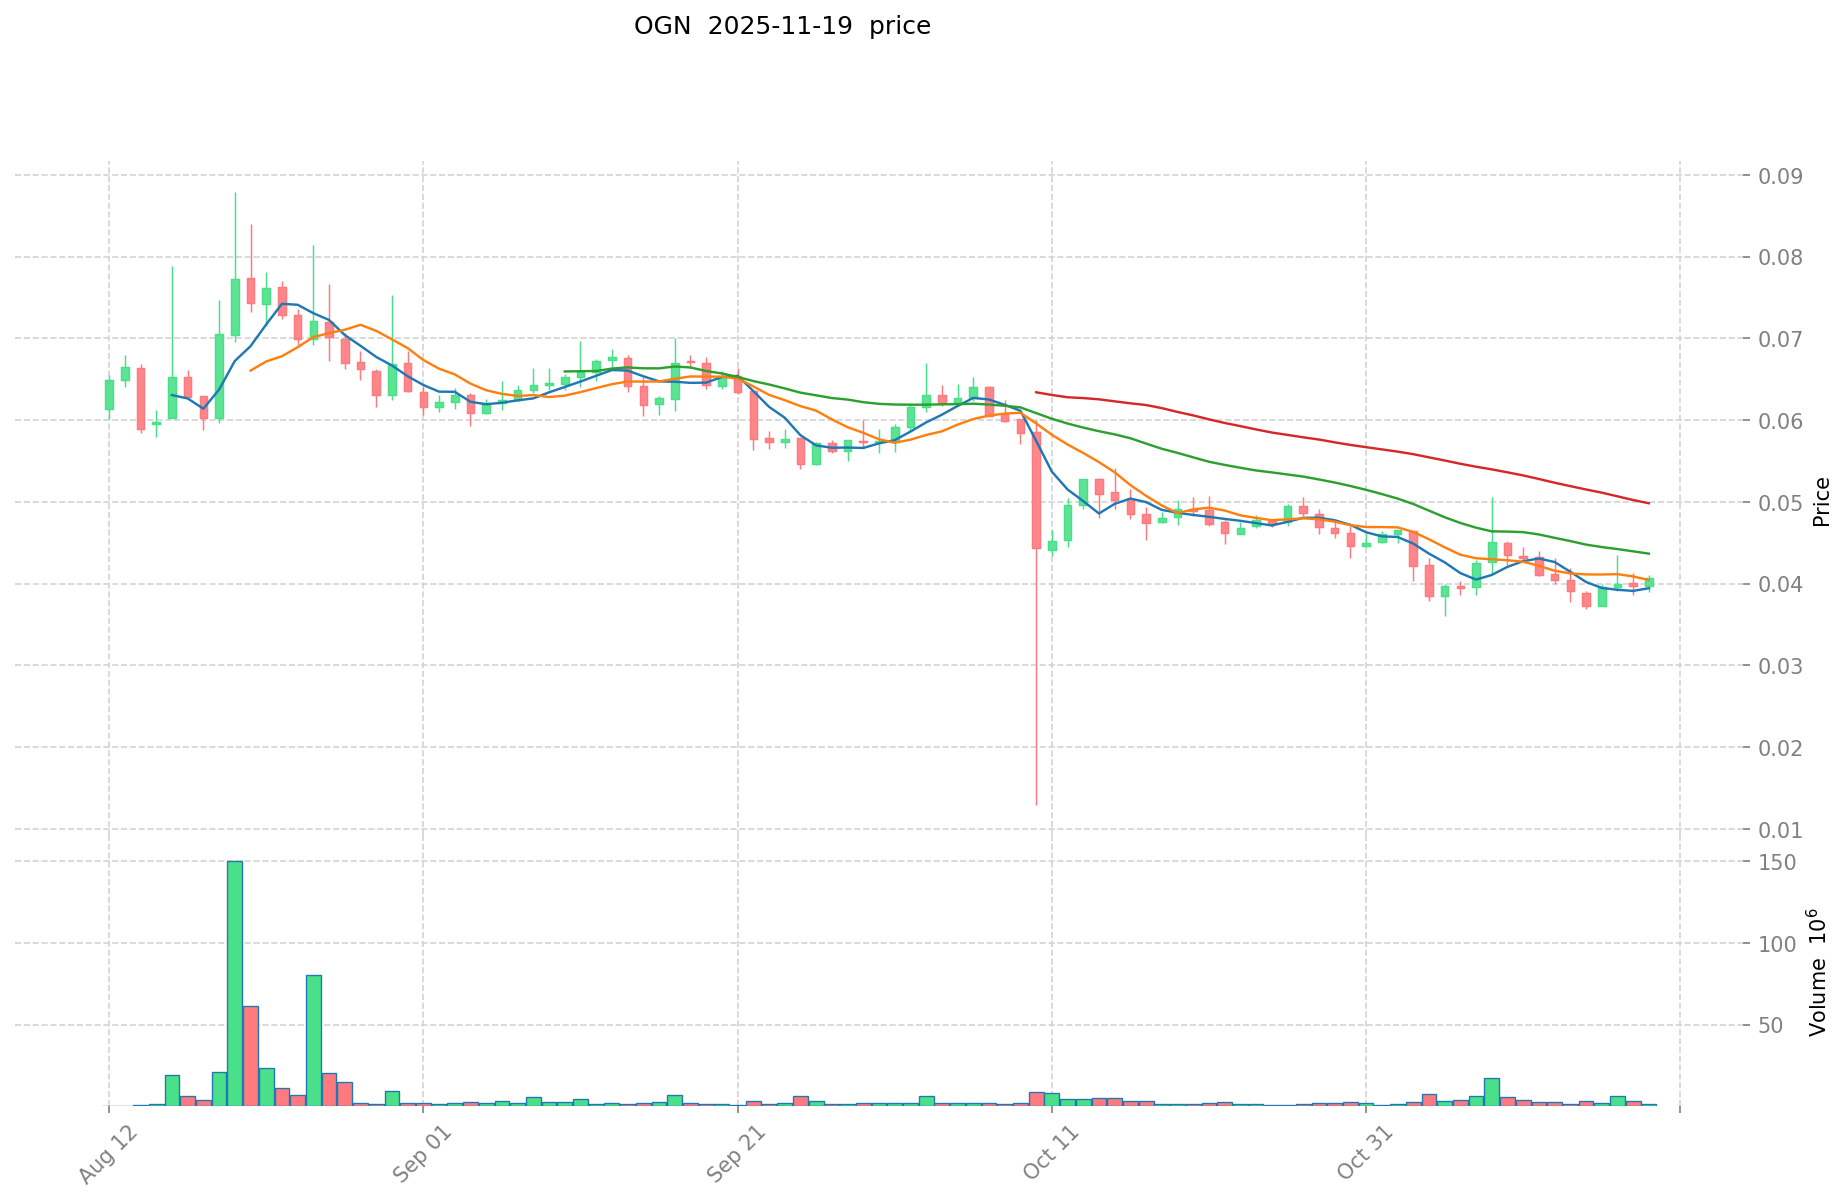
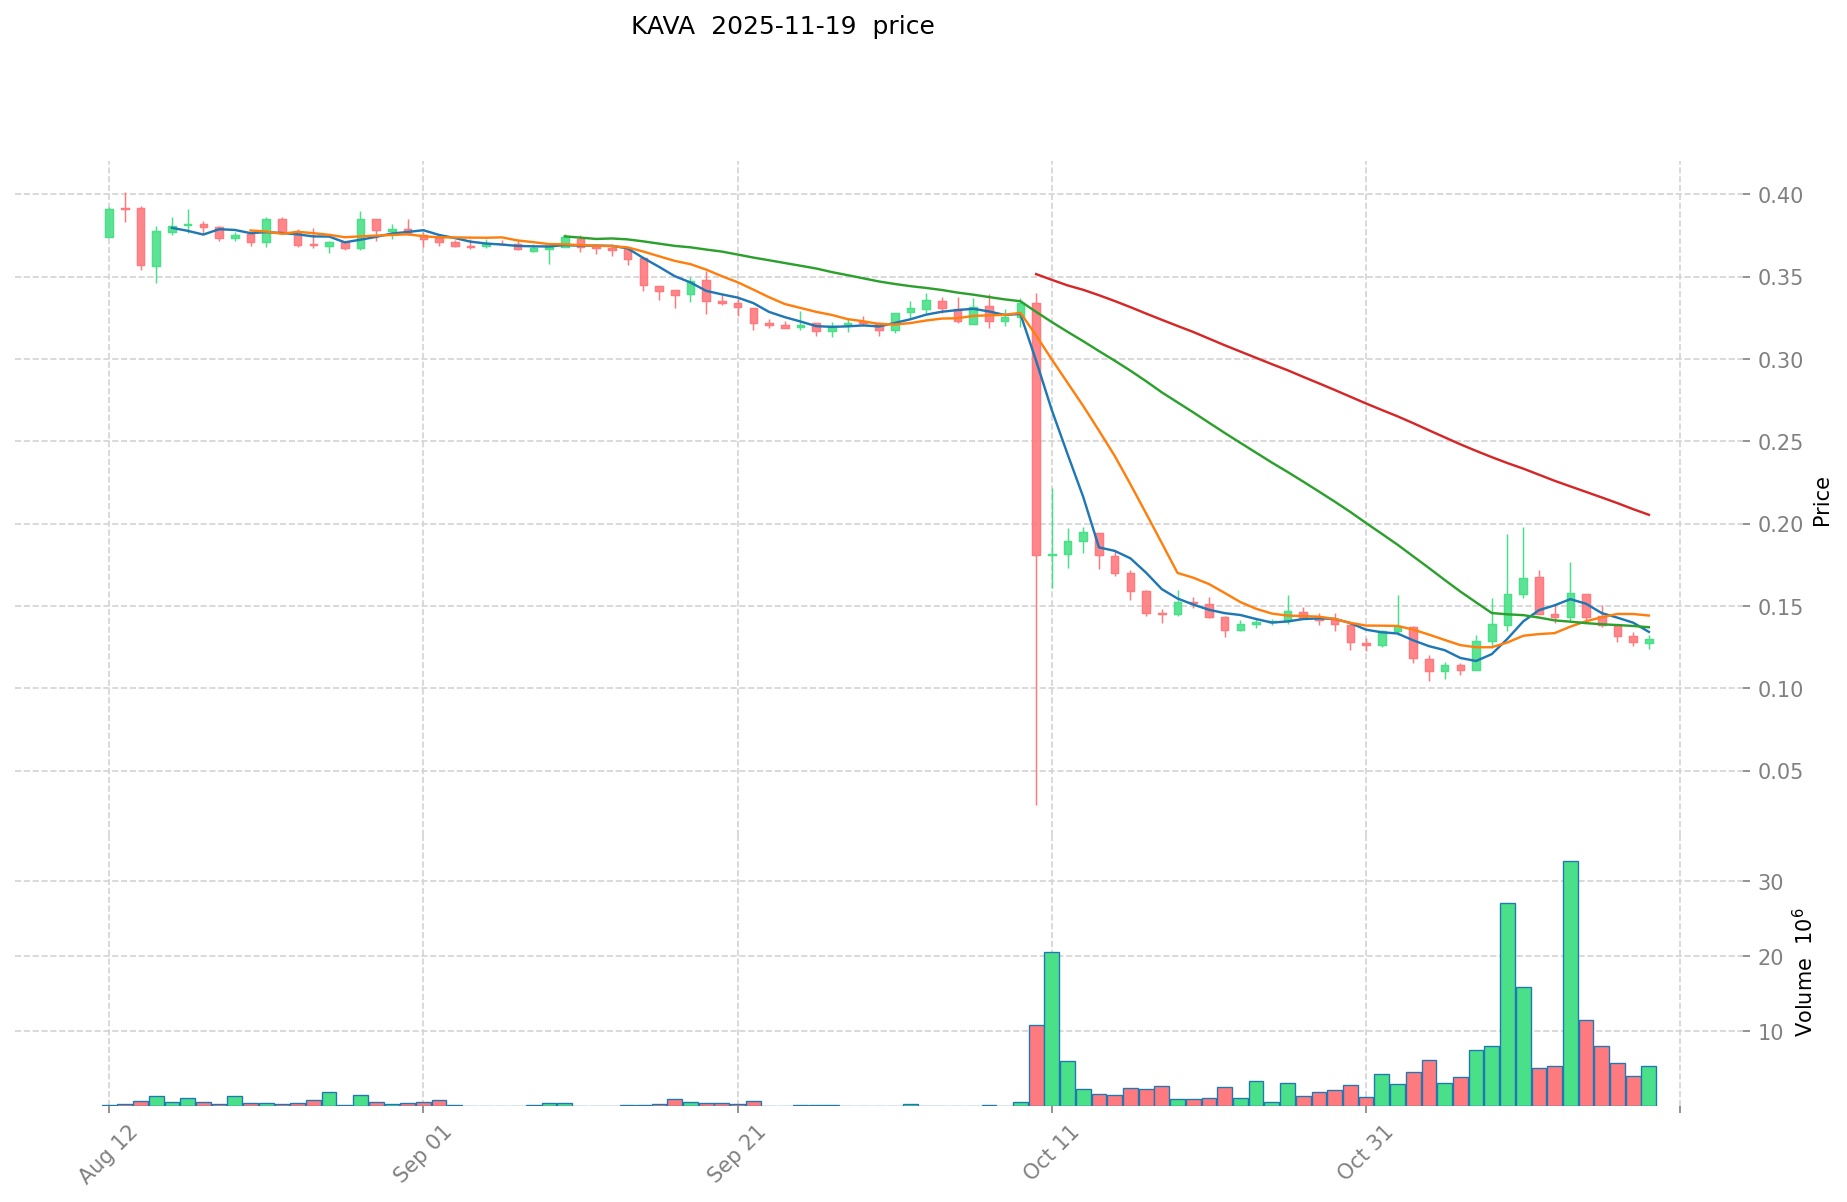
- Comparative analysis: Since their respective all-time highs, OGN has fallen to $0.03881, while KAVA has dropped to $0.12787.
Current Market Situation (2025-11-19)
- OGN current price: $0.03881
- KAVA current price: $0.12787
- 24-hour trading volume: OGN $57,829.83 vs KAVA $792,548.58
- Market sentiment index (Fear & Greed Index): 15 (Extreme Fear)
Click to view real-time prices:
- View OGN current price Market Price
- View KAVA current price Market Price
II. Core Factors Affecting the Investment Value of OGN vs KAVA
Supply Mechanism Comparison (Tokenomics)
-
OGN: Maximum supply capped at 1 billion tokens, with a gradually decreasing issuance rate designed to reduce selling pressure over time
-
KAVA: Inflationary model with block rewards, featuring regular token emissions to validators and delegators
-
📌 Historical Pattern: Fixed supply models like OGN's tend to create more scarcity-driven price appreciation over time, while inflationary models like KAVA's require sufficient utility and token burning mechanisms to offset dilution.
Institutional Adoption and Market Applications
- Institutional Holdings: KAVA has gained more institutional interest through its cross-chain DeFi platform and integration with major networks
- Enterprise Adoption: KAVA offers more enterprise-friendly solutions through its cross-chain money market, while OGN focuses more on consumer-facing applications through Origin Protocol
- Regulatory Attitudes: Both tokens face similar regulatory challenges in most jurisdictions as utility tokens, though KAVA's focus on DeFi infrastructure potentially exposes it to more regulatory scrutiny
Technical Development and Ecosystem Building
- OGN Technical Upgrades: Development of Origin Dollar (OUSD) and NFT marketplace (Origin Story) expands utility within the broader Origin ecosystem
- KAVA Technical Development: Multi-chain support across Ethereum and Cosmos ecosystems, with an interoperable platform that connects multiple blockchains
- Ecosystem Comparison: KAVA has stronger DeFi applications with lending and staking functions, while OGN has better NFT and e-commerce integrations
Macroeconomic and Market Cycles
- Performance in Inflationary Environments: Both tokens have limited proven track records as inflation hedges compared to larger cryptocurrencies
- Macroeconomic Monetary Policy: Interest rate hikes tend to negatively impact both tokens as risk assets, though KAVA's yield-generating capabilities may provide some offset
- Geopolitical Factors: KAVA's cross-chain functionality potentially offers more utility in fragmented regulatory environments
III. 2025-2030 Price Prediction: OGN vs KAVA
Short-term Prediction (2025)
- OGN: Conservative $0.0334 - $0.0389 | Optimistic $0.0389 - $0.0451
- KAVA: Conservative $0.0799 - $0.1289 | Optimistic $0.1289 - $0.1430
Mid-term Prediction (2027)
- OGN may enter a growth phase, with estimated price range $0.0292 - $0.0659
- KAVA may enter a steady growth phase, with estimated price range $0.1117 - $0.1852
- Key drivers: Institutional capital inflow, ETF, ecosystem development
Long-term Prediction (2030)
- OGN: Base scenario $0.0684 - $0.0841 | Optimistic scenario $0.0841 - $0.0841
- KAVA: Base scenario $0.1985 - $0.2283 | Optimistic scenario $0.2283 - $0.2283
View detailed price predictions for OGN and KAVA
Disclaimer: The above predictions are based on historical data and market trends. Cryptocurrency markets are highly volatile and subject to change. This information should not be considered as financial advice. Always conduct your own research before making investment decisions.
OGN:
| 年份 |
预测最高价 |
预测平均价格 |
预测最低价 |
涨跌幅 |
| 2025 |
0.0451124 |
0.03889 |
0.0334454 |
0 |
| 2026 |
0.052081488 |
0.0420012 |
0.028980828 |
8 |
| 2027 |
0.0658578816 |
0.047041344 |
0.02916563328 |
21 |
| 2028 |
0.060965581824 |
0.0564496128 |
0.032176279296 |
45 |
| 2029 |
0.07808110442496 |
0.058707597312 |
0.03933409019904 |
51 |
| 2030 |
0.08412505156823 |
0.06839435086848 |
0.045140271573196 |
76 |
KAVA:
| 年份 |
预测最高价 |
预测平均价格 |
预测最低价 |
涨跌幅 |
| 2025 |
0.1430346 |
0.12886 |
0.0798932 |
0 |
| 2026 |
0.146823084 |
0.1359473 |
0.131868881 |
6 |
| 2027 |
0.18521460152 |
0.141385192 |
0.11169430168 |
10 |
| 2028 |
0.1943268771444 |
0.16329989676 |
0.1290069184404 |
27 |
| 2029 |
0.218152332081684 |
0.1788133869522 |
0.137686307953194 |
39 |
| 2030 |
0.228255288444483 |
0.198482859516942 |
0.154816630423214 |
55 |
IV. Investment Strategy Comparison: OGN vs KAVA
Long-term vs Short-term Investment Strategies
- OGN: Suitable for investors focused on DeFi and NFT ecosystem potential
- KAVA: Suitable for investors seeking cross-chain DeFi infrastructure exposure
Risk Management and Asset Allocation
- Conservative investors: OGN: 30% vs KAVA: 70%
- Aggressive investors: OGN: 60% vs KAVA: 40%
- Hedging tools: Stablecoin allocation, options, cross-currency portfolio
V. Potential Risk Comparison
Market Risks
- OGN: Higher volatility due to lower market cap and trading volume
- KAVA: Potential dilution from inflationary token model
Technical Risks
- OGN: Scalability, network stability
- KAVA: Cross-chain interoperability challenges, smart contract vulnerabilities
Regulatory Risks
- Global regulatory policies may impact both tokens differently, with KAVA potentially facing more scrutiny due to its DeFi focus
VI. Conclusion: Which Is the Better Buy?
📌 Investment Value Summary:
- OGN advantages: Fixed supply model, NFT and e-commerce integrations
- KAVA advantages: Cross-chain functionality, stronger institutional adoption
✅ Investment Advice:
- Novice investors: Consider a balanced allocation with higher weight towards KAVA
- Experienced investors: Explore OGN for higher potential returns, while maintaining KAVA exposure
- Institutional investors: Focus on KAVA for its cross-chain DeFi infrastructure and institutional-grade solutions
⚠️ Risk Warning: The cryptocurrency market is highly volatile. This article does not constitute investment advice.
None
VII. FAQ
Q1: What are the main differences between OGN and KAVA?
A: OGN focuses on DeFi and yield generation across multiple chains, with a fixed supply model and NFT marketplace integration. KAVA is a cross-chain DeFi platform with an inflationary token model, offering services for mainstream digital assets and stronger institutional adoption.
Q2: Which token has performed better historically?
A: Both tokens reached their all-time highs in 2021, with OGN peaking at $3.35 and KAVA at $9.12. Since then, both have experienced significant declines, with OGN falling to $0.03881 and KAVA to $0.12787 as of 2025-11-19.
Q3: How do the supply mechanisms of OGN and KAVA differ?
A: OGN has a maximum supply capped at 1 billion tokens with a gradually decreasing issuance rate. KAVA uses an inflationary model with regular token emissions to validators and delegators.
Q4: Which token is more suitable for long-term investment?
A: OGN may be more suitable for investors focused on DeFi and NFT ecosystem potential, while KAVA is better for those seeking exposure to cross-chain DeFi infrastructure.
Q5: What are the primary risks associated with investing in OGN and KAVA?
A: OGN faces higher volatility due to its lower market cap and trading volume. KAVA risks potential dilution from its inflationary token model. Both face technical risks such as scalability and smart contract vulnerabilities, as well as regulatory challenges.
Q6: How do institutional adoption and market applications compare between OGN and KAVA?
A: KAVA has gained more institutional interest through its cross-chain DeFi platform and integration with major networks. It also offers more enterprise-friendly solutions, while OGN focuses more on consumer-facing applications.
Q7: What are the price predictions for OGN and KAVA by 2030?
A: By 2030, OGN is predicted to reach a base scenario of $0.0684 - $0.0841, with an optimistic scenario of $0.0841. KAVA is expected to reach a base scenario of $0.1985 - $0.2283, with an optimistic scenario of $0.2283.
* The information is not intended to be and does not constitute financial advice or any other recommendation of any sort offered or endorsed by Gate.


