主流K线形态深度解析终极指南

如何读懂最主流的K线形态
什么是K线?
K线图是技术分析中用于直观展现资产在特定时段内价格波动的基础图表工具。K线图最早起源于18世纪日本,至今已有数百年历史,长期用于通过识别形态洞察资产价格走势。如今,K线图已成为交易员和金融分析师分析历史价格、预测未来行情的重要工具。
理解K线形态的意义,是所有技术分析参与者的必备技能。K线分析的核心在于形态识别。多根K线连续排列,往往构成能预示价格上涨、下跌或横盘的典型形态。这些形态是反映市场情绪的直观信号,有助于发掘交易机会。掌握这些形态,是交易者基于技术分析做出理性决策的关键基础。
K线图是如何运作的?
以追踪某一资产(如股票或数字货币)在一周、一天或一小时等特定周期内的价格为例,K线图通过独特的图形,将这些价格数据进行可视化。
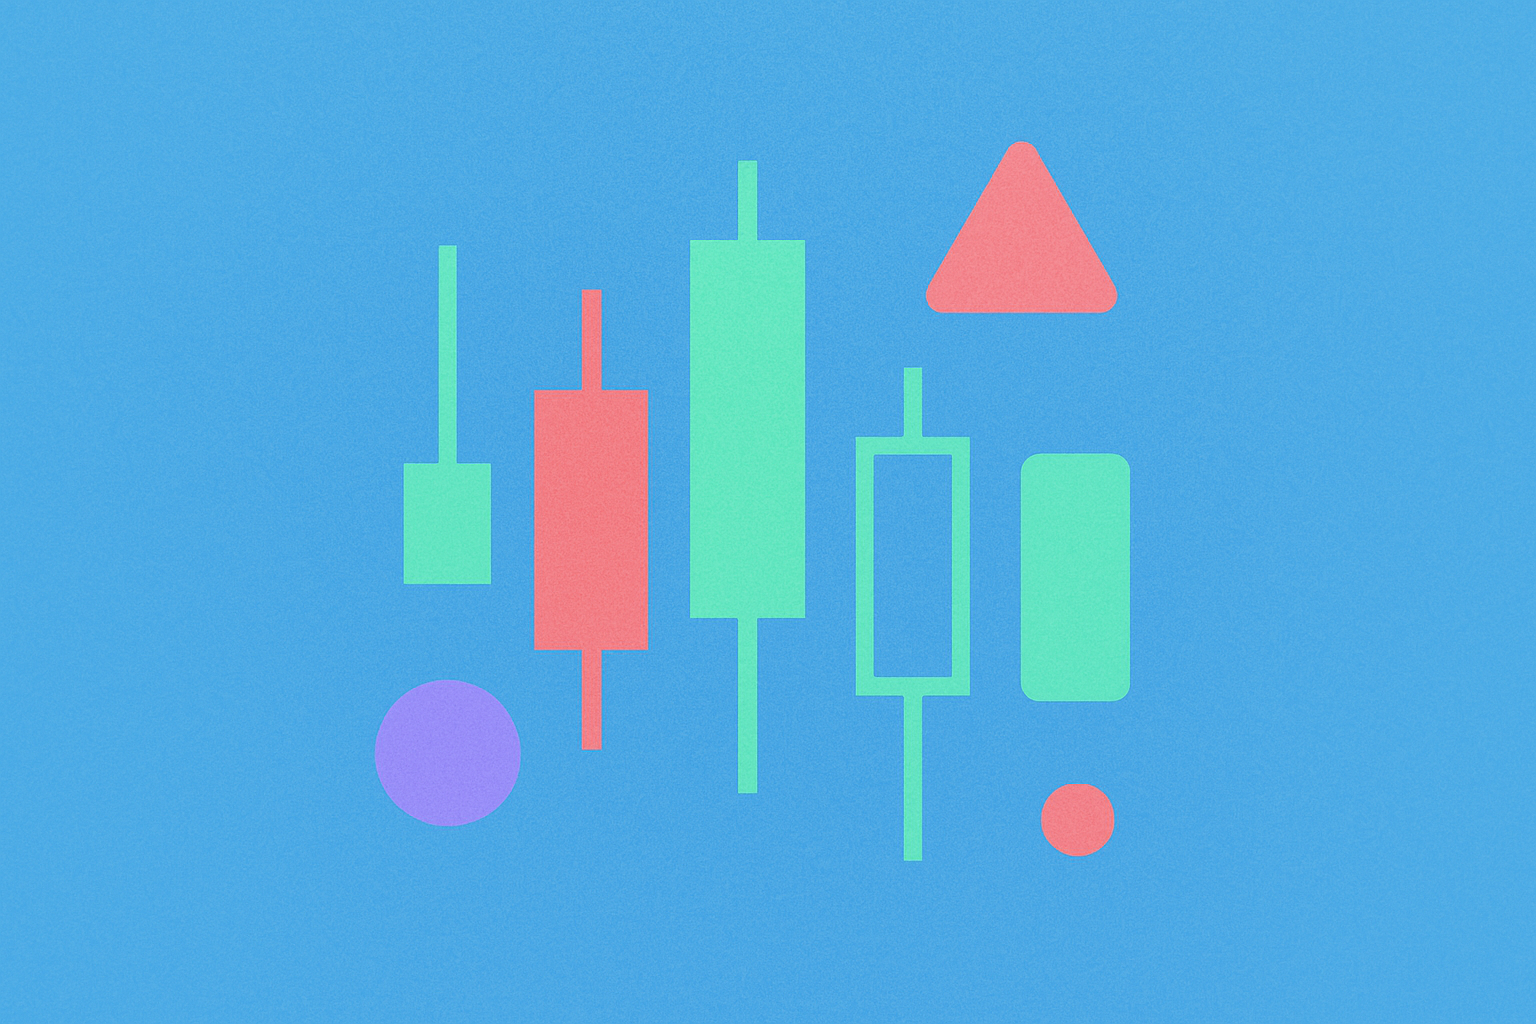
每根K线由两部分组成:实体和上下影线。K线实体呈现该周期的开盘价与收盘价区间,上下影线分别对应该周期的最高价和最低价。
颜色区分至关重要:绿色实体代表该周期价格上涨,显示多头情绪;红色实体则意味着价格下跌,体现空头市场。通过色彩,交易者能迅速判断市场方向和动能。
如何解读K线形态
K线形态由多根K线按特定顺序排列构成,每种形态都有不同的解读和市场意义。部分形态揭示市场买卖力量对比,部分则预示反转、趋势延续或市场犹豫。
需要注意,K线形态本身并非直接的买卖信号,而是分析当前行情、发掘潜在机会的工具。每个形态都应放在更广阔的市场环境下,结合周边价格走势和整体市场条件综合分析。
为了更好控制风险,很多交易者会将K线形态与其他分析方法结合使用。均线、RSI、MACD等技术指标常与K线形态配合,提高信号的可靠性。
K线形态还可与支撑/阻力位有效联用。在交易中,支撑位通常是买方力量大于卖方的价格区域,阻力位则是卖方力量占优的区间。将关键价格区间与K线形态结合,有助于提升交易信号的准确性。
牛市典型K线形态
锤头线(Hammer)
锤头线多见于下跌趋势末端,特征为长下影线至少为实体两倍。该形态表明,即便市场曾出现强烈抛压,买方依然将价格推回开盘位。锤头线可为红色或绿色,绿色锤头往往预示更强多头反应。此形态暗示下跌动能减弱,反转机会临近。
倒锤头线(Inverted Hammer)
倒锤头线结构与锤头线相似,但为长上影线、短下影线,且上影线至少为实体两倍。该形态常见于下跌趋势末端,预示可能转为上涨。长上影线反映价格下跌暂缓,尽管卖方最终将价格拉回开盘位,形态上仍反映空头力量减弱,多头有望发力。
三连阳(Three White Soldiers)
三连阳由三根连续的绿K线组成,每根开盘价在前一根实体内,收盘价高于前一根高点。通常下影线极短或无影,说明买方力量强劲,价格持续推高。交易者还会关注K线实体和影线长度。实体越大,多头动能越强,形态越可靠。
多头母子线(Bullish Harami)
多头母子线由一根长红K线后接一根完全被前一根实体包裹的小绿K线组成,可跨越两天及以上。该形态表明市场抛压放缓、或即将结束,属于盘整信号,预示下跌趋势有望反转。
熊市典型K线形态
上吊线(Hanging Man)
上吊线是锤头线的空头版本,常出现在上涨末端,实体短、下影线长。长下影线说明上涨后市场出现大量抛盘,尽管多头一度将价格拉回,但空头力量逐渐增强。若出现在长时间上涨后,上吊线是多头动能减弱的警示,提示可能反转。
射击星(Shooting Star)
射击星形态为长上影线、短实体、无下影线或下影线极短,实体靠近K线底部。虽与倒锤头线相似,但其出现在上涨趋势末端。射击星显示市场触及高点后空头掌控,价格回落。部分交易者在射击星出现时卖出或开空仓,另一些则等下一根K线确认后再操作。
三连阴(Three Black Crows)
三连阴由三根连续红K线组成,每根开盘价在上一根实体内,收盘价均低于上一根最低点,是三连阳的空头对应形态。理想状态下,K线无长上影线,反映持续卖压。通过K线实体和影线判断趋势延续性。
空头母子线(Bearish Harami)
空头母子线由一根长绿K线后接一根完全被前一根实体包裹的小红K线组成,可横跨两个及以上周期,常见于上涨末端,预示买方动能减弱,或将转为下跌。该形态显示买盘信心丧失,或是下跌前兆。
乌云盖顶(Dark Cloud Cover)
乌云盖顶由一根红K线组成,其开盘价高于前一根绿K线收盘,但收盘价低于前一根实体中点。若该形态伴随较大成交量,则表明市场动能由多转空。一些交易者会等第三根红K线确认后再操作。
三种延续K线形态
上升三法(Rising Three Methods)
上升三法出现在上涨趋势中,表现为三根小红K线短暂调整,随后上涨恢复。理想状态下,这三根红K线价格区间不超过前一根K线。大实体绿K线确认多头回归,趋势延续。此形态表明主升浪前的暂时回调。
下降三法(Falling Three Methods)
下降三法是上升三法的逆向表现,预示下跌趋势延续。小实体K线盘整后,空头重新掌控,出现大实体红K线,趋势持续下行。
十字星形态(Doji Candlestick Pattern)
十字星在开盘价与收盘价极为接近或完全一致时出现。期间价格虽有波动,最终仍收于开盘或附近。该形态反映市场买卖力量均衡、犹豫。具体解读需结合所在市场环境。
根据开盘、收盘线位置不同,十字星可分为墓碑十字、长脚十字和蜻蜓十字。墓碑十字上影线长,开盘、收盘接近底部,提示空头反转;长脚十字上下影线均长,开盘、收盘居中,表明市场观望;蜻蜓十字下影线长,开盘、收盘在顶部,具体多空还需结合环境判断。在数字资产等高波动市场,十字星也可指代“纺锤线”,即开盘、收盘极为接近的K线。
跳空缺口类K线形态
跳空缺口指金融资产开盘价高于或低于前一根K线收盘价,导致相邻K线间出现明显空档。许多K线形态会涉及缺口,但以缺口为核心的形态在数字资产市场不常使用,因为部分市场全天24小时交易,不同于传统股市有固定开市时段。
在流动性较差的市场,缺口仍可能出现,但通常仅反映流动性不足和买卖价差较大,而非价格变动或趋势反转的可靠信号。
K线形态实战应用要点
交易者在实际运用K线形态时应注意以下核心原则:
掌握形态基础
在运用K线形态进行交易前,交易者需充分掌握其基础知识,包括识读K线图和理解各种形态。对不熟悉的形态切勿盲目交易。扎实基础有助于避免误判信号、减少不必要的亏损。
多指标联用
K线形态虽能提供有效参考,但需配合其他技术指标共同判断。例如均线、RSI、MACD等与K线形态结合,能提升信号准确性和整体胜率。
多周期联动分析
分析K线形态时建议多周期观察。如分析日线时,可同步参考小时线、15分钟线,了解不同周期形态表现。多周期分析有助于发现短线与长线趋势共振,提高信号强度。
严格风险管理
所有交易策略都存在风险,K线形态亦如此。交易时务必坚持风险管理,如设置止损保护本金,避免频繁交易,只在风险回报合适时入场。合理仓位控制和本金安全应始终放在首位。
结语
K线形态是技术分析的重要组成部分,适用于不同经验水平的交易者。无论作为核心策略还是辅助参考,理解K线形态本质有助于提升交易决策质量。
需要强调,K线形态虽具参考价值,但并非万能。它们仅为市场买卖力量变化的直观指标,务必配合其他工具、信号确认及风险管理共同使用,从而降低亏损、提升整体胜率。多元分析方法结合,是构建稳健交易体系的关键。
常见问题
K线代表什么?
K线是一种图表工具,用于展示加密货币在特定周期内的开盘、收盘、最高、最低价。它通过形态帮助交易者直观理解价格波动和市场情绪。
什么是多头K线和空头K线?
多头K线收盘高于开盘,反映上涨动能;空头K线收盘低于开盘,反映下跌动能。
Candlestick在英文中的含义是什么?
Candlestick是加密货币交易中的K线形态,展示某一周期的开盘、收盘、最高和最低价。每根K线反映价格波动,实体为交易区间,影线为价格极端值。
三根K线法则是什么意思?
三根K线法则分析连续三根K线,判断趋势反转或延续。交易者用此形态捕捉潜在价格变动和市场方向变化,优化交易决策。
分享


热门加密货币


2025年如何从加密货币交易所提取资金:初学者指南

Hedera Hashgraph (HBAR):创始人、技术及2030年价格展望

如何购买加密货币:Gate.com详细指南

2025年如何交易比特币:初学者指南

Jasmy Coin:一个关于野心、炒作和希望的日本加密货币故事
IOTA (MIOTA) – 从Tangle起源到2025年价格展望

Gate Ventures 每周加密市场回顾(2026年3月23日)


Gate Ventures 每周加密市场回顾(2026年3月2日)
Gate Ventures 每周加密货币市场回顾(2026年2月23日)

Gate Ventures 本周加密货币回顾(2026年2月9日)
