This comprehensive comparison analyzes XCN and GRT, two emerging blockchain infrastructure projects, to guide investment decisions. XCN (Onyx Protocol backbone) ranks #161 with $382M market cap, while GRT (decentralized data indexing protocol) ranks #139 with $448M market cap. The article examines historical price trends, tokenomics, institutional adoption, technical ecosystems, and 2026-2031 price forecasts projecting XCN at $0.01351-$0.02333 and GRT at $0.05719-$0.08098. Investment strategies are tailored for conservative (30-40% XCN / 60-70% GRT) and aggressive (50-60% XCN / 40-50% GRT) investors. Risk factors including market volatility, technical development, and regulatory considerations are analyzed to help investors determine which asset aligns with their portfolio objectives on Gate.
Introduction: Investment Comparison Between XCN and GRT
In the cryptocurrency market, the comparison between XCN vs GRT has consistently been a topic investors cannot ignore. The two not only demonstrate notable differences in market cap ranking, application scenarios, and price performance, but also represent distinct positioning within the crypto asset landscape.
Onyxcoin (XCN): Serving as the backbone of web3 blockchain infrastructure powered by the Onyx Protocol, XCN has established its presence in the decentralized ecosystem. As of January 15, 2026, XCN ranks at #161 with a market capitalization of approximately $382 million and a circulating supply of 42.5 billion tokens.
The Graph (GRT): Since its launch in December 2020, GRT has been recognized as a decentralized protocol for indexing and querying blockchain data, primarily applied to Ethereum. Currently ranking at #139, GRT maintains a market cap of around $448 million with a circulating supply of 10.7 billion tokens, representing 98.84% of its maximum supply.
This article will provide a comprehensive analysis of XCN vs GRT investment value comparison, focusing on historical price trends, supply mechanisms, institutional adoption, technical ecosystems, and future projections, attempting to address investors' most pressing question:
"Which is the better buy right now?"
I. Historical Price Comparison and Current Market Status
Historical Price Trends of XCN (Coin A) and GRT (Coin B)
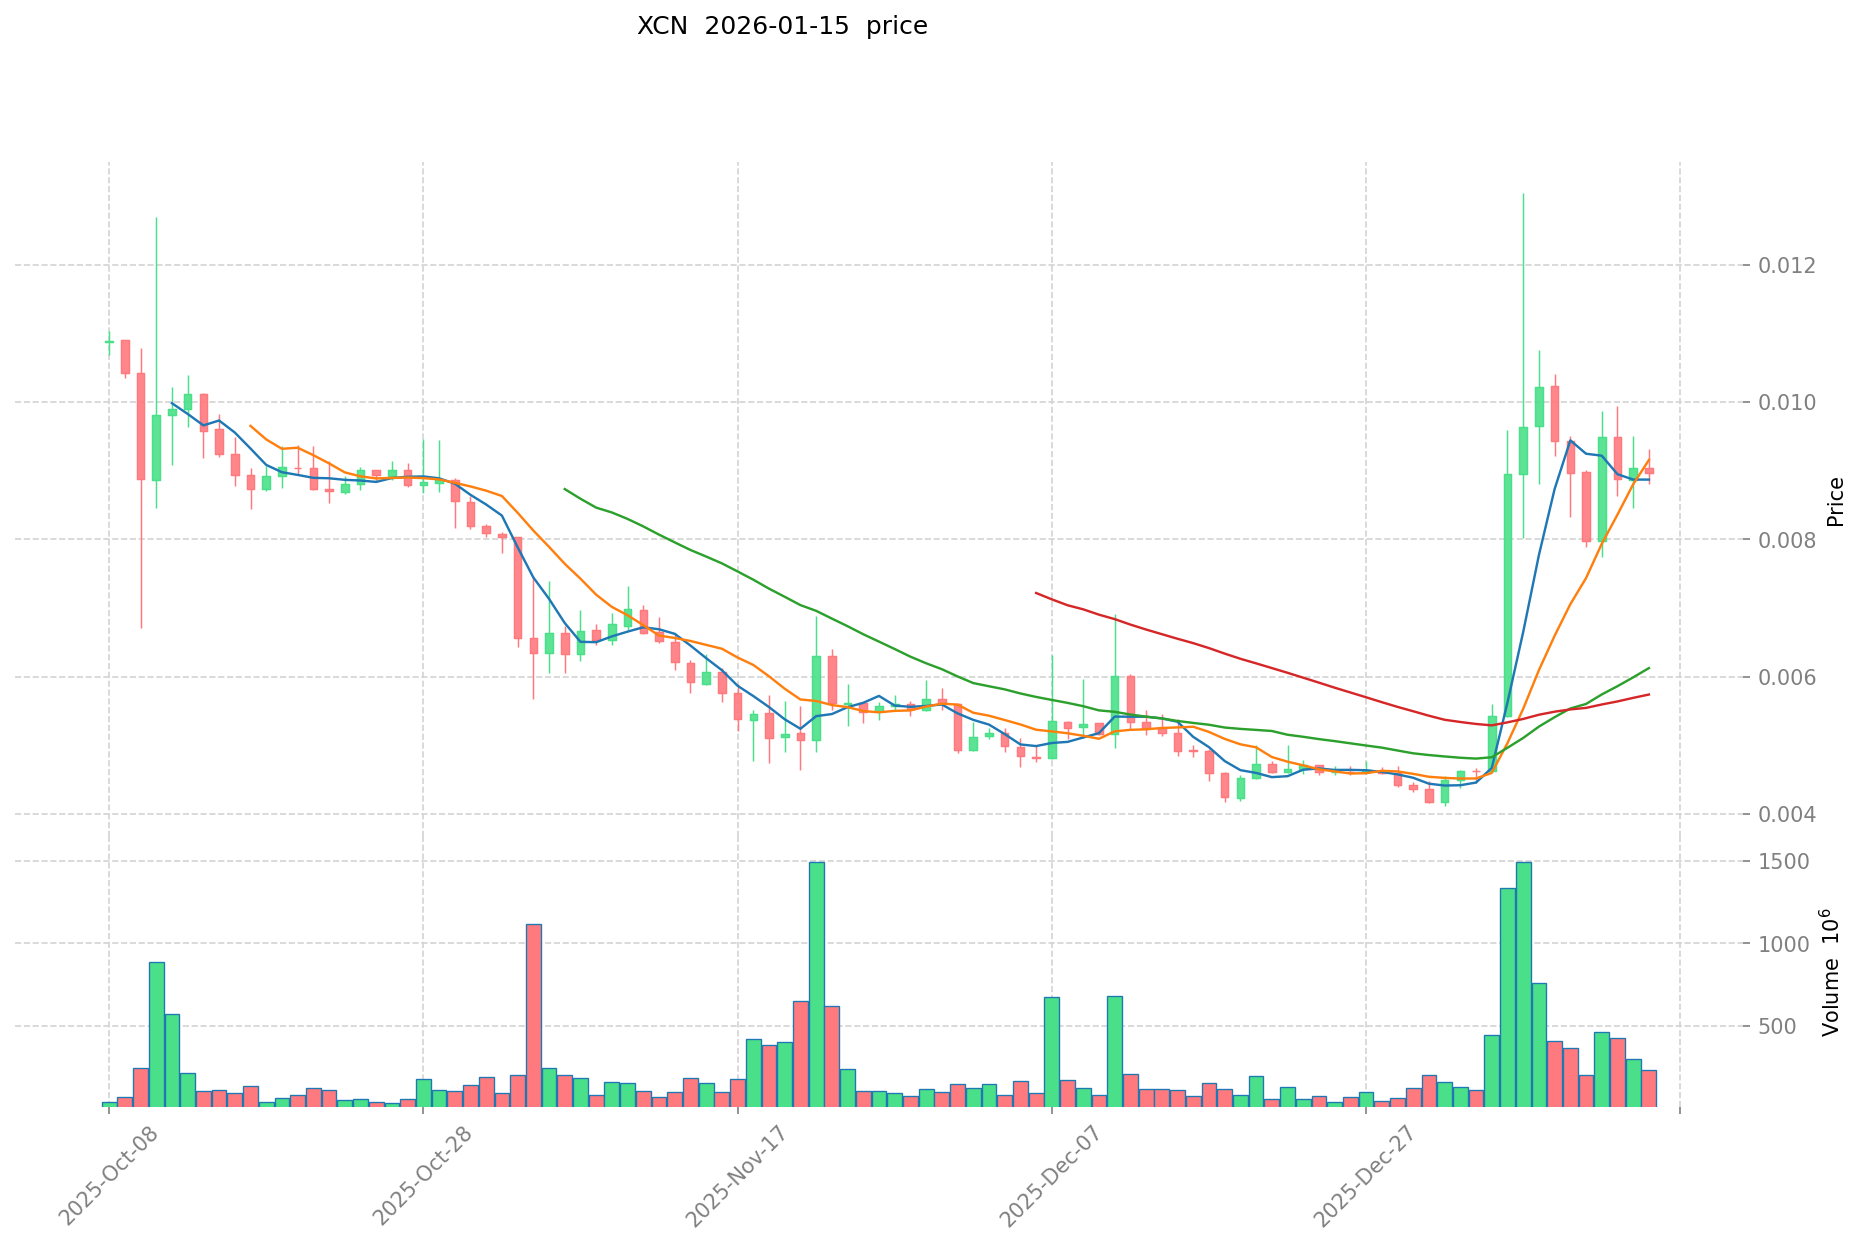
- 2022: XCN reached its all-time high of $0.184139 on May 27, 2022, during a period of heightened market activity. Subsequently, the price experienced substantial declines through market downturns.
- 2023: XCN recorded its all-time low of $0.0007055 on October 12, 2023, reflecting broader market corrections and reduced trading interest.
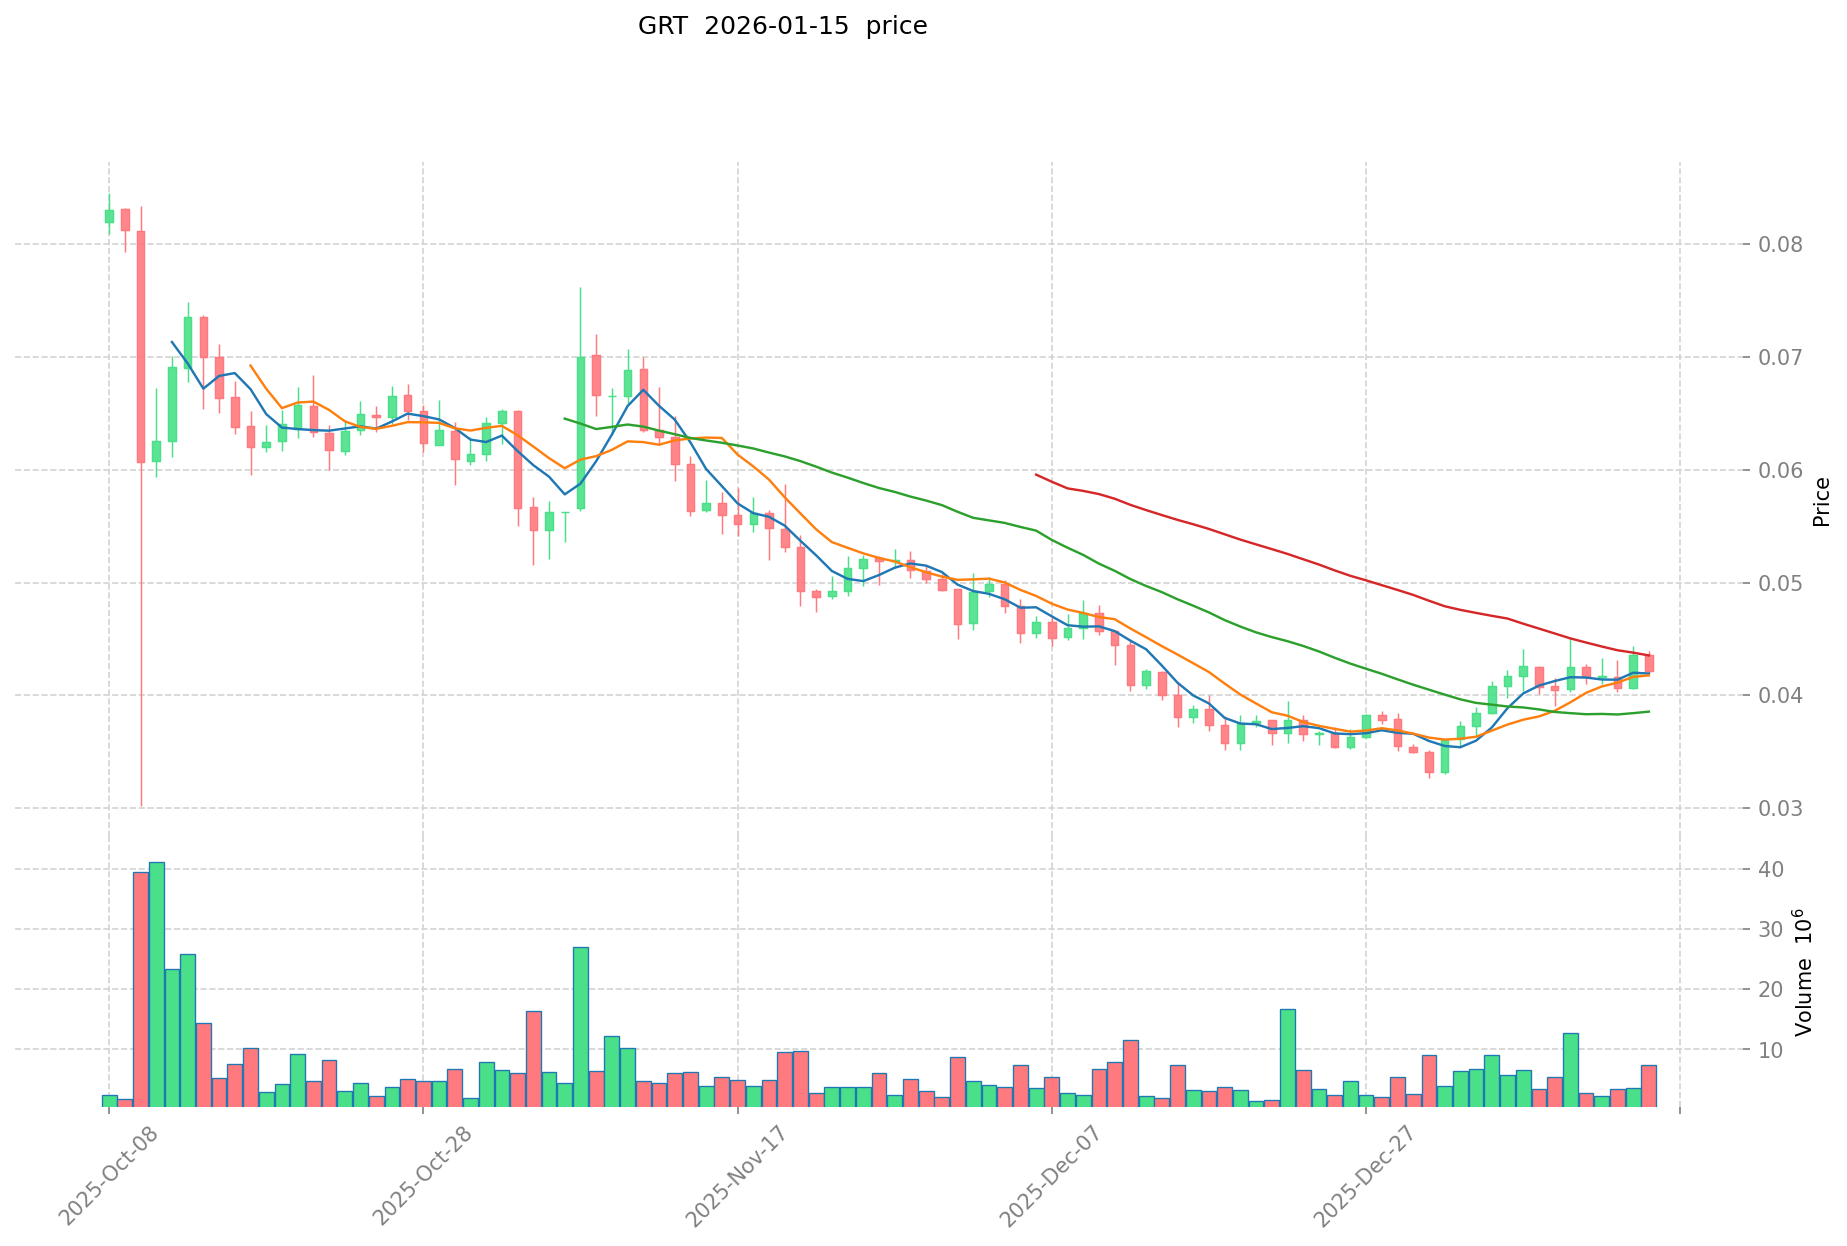
- 2021: GRT achieved its all-time high of $2.84 on February 12, 2021, coinciding with strong adoption in decentralized applications and indexing services.
- 2026: GRT reached its all-time low of $0.03272768 on January 1, 2026, as reference materials indicate recent price pressure.
- Comparative Analysis: During the 2021-2023 market cycle, XCN declined from its peak of $0.184139 to a low of $0.0007055, representing a substantial correction. In contrast, GRT fell from $2.84 to $0.03272768, also experiencing significant downward pressure but maintaining broader market recognition in blockchain infrastructure.
Current Market Status (2026-01-15)
- XCN Current Price: $0.008993
- GRT Current Price: $0.04195
- 24-Hour Trading Volume: XCN recorded $2,064,821.99 compared to GRT's $325,849.51
- Market Sentiment Index (Fear & Greed Index): 61 (Greed)
View real-time prices:
II. Core Factors Influencing XCN vs GRT Investment Value
Supply Mechanism Comparison (Tokenomics)
- XCN: Information regarding XCN's supply mechanism and tokenomics structure is limited in available materials.
- GRT: The Graph operates with a token model designed to incentivize network participants including indexers, curators, and delegators. Protocol upgrades and token economics are key elements of GRT's ecosystem development.
- 📌 Historical Pattern: Supply mechanisms influence price cycles through emission schedules, staking rewards, and network participation incentives. The relationship between token utility and protocol adoption can drive value dynamics over time.
Institutional Adoption and Market Application
- Institutional Holdings: Specific comparative data on institutional preference between XCN and GRT is not extensively detailed in the reference materials.
- Enterprise Adoption: GRT serves as infrastructure for Web3 applications through indexing and querying blockchain data. The Graph's protocol facilitates decentralized application development and data accessibility across multiple blockchain networks.
- Regulatory Context: Both assets operate within evolving regulatory frameworks across different jurisdictions. Market sentiment and regulatory developments can influence adoption trajectories and investment considerations.
Technical Development and Ecosystem Building
- XCN Technical Progress: Detailed information on recent technical upgrades or ecosystem developments for XCN is limited in the provided materials.
- GRT Technical Development: The Graph continues to advance its protocol with upgrades aimed at enhancing data indexing capabilities and expanding Web3 infrastructure. The protocol's development roadmap focuses on improving network efficiency and supporting broader blockchain ecosystems.
- Ecosystem Comparison: GRT plays a foundational role in Web3 data infrastructure, supporting DeFi applications, decentralized data queries, and blockchain analytics. The ecosystem's growth correlates with Web3 technology adoption and developer activity.
Macroeconomic Context and Market Cycles
- Performance in Inflationary Environments: Crypto assets generally exhibit varying correlations with traditional inflation hedges. Specific comparative performance data between XCN and GRT in inflationary contexts requires more detailed historical analysis.
- Macroeconomic Monetary Policy: Interest rate adjustments, US dollar strength, and broader monetary policy shifts influence crypto market liquidity and risk appetite. Both assets may experience price movements influenced by these macro factors.
- Geopolitical Factors: Cross-border transaction demand, international policy developments, and global economic conditions contribute to overall crypto market dynamics. GRT's role in decentralized infrastructure may position it within trends toward data sovereignty and decentralized technology adoption.
III. 2026-2031 Price Forecast: XCN vs GRT
Short-term Forecast (2026)
- XCN: Conservative $0.00809 - $0.00919 | Optimistic $0.01351
- GRT: Conservative $0.03448 - $0.04205 | Optimistic $0.05719
Mid-term Forecast (2028-2029)
- XCN may enter a moderate growth phase, with projected prices ranging from $0.01253 to $0.01689 in 2028, and $0.01471 to $0.01719 in 2029
- GRT may enter a consolidation phase, with projected prices ranging from $0.03057 to $0.06836 in 2028, and $0.03470 to $0.06382 in 2029
- Key drivers: institutional capital flows, ETF developments, ecosystem expansion
Long-term Forecast (2031)
- XCN: Baseline scenario $0.01157 - $0.01961 | Optimistic scenario $0.02333
- GRT: Baseline scenario $0.05765 - $0.06478 | Optimistic scenario $0.08098
View detailed price predictions for XCN and GRT
Disclaimer
XCN:
| Year |
Predicted High Price |
Predicted Average Price |
Predicted Low Price |
Price Change |
| 2026 |
0.01351371 |
0.009193 |
0.00808984 |
2 |
| 2027 |
0.0168029654 |
0.011353355 |
0.0088556169 |
26 |
| 2028 |
0.01689379224 |
0.0140781602 |
0.012529562578 |
56 |
| 2029 |
0.0171894336042 |
0.01548597622 |
0.014711677409 |
72 |
| 2030 |
0.02287278687694 |
0.0163377049121 |
0.010292754094623 |
81 |
| 2031 |
0.023330242614478 |
0.01960524589452 |
0.011567095077766 |
118 |
GRT:
| Year |
Predicted High Price |
Predicted Average Price |
Predicted Low Price |
Price Change |
| 2026 |
0.057188 |
0.04205 |
0.034481 |
0 |
| 2027 |
0.06152756 |
0.049619 |
0.04416091 |
18 |
| 2028 |
0.0683551344 |
0.05557328 |
0.030565304 |
32 |
| 2029 |
0.063823133416 |
0.0619642072 |
0.034699956032 |
47 |
| 2030 |
0.06666729052648 |
0.062893670308 |
0.04968599954332 |
49 |
| 2031 |
0.08097560052155 |
0.06478048041724 |
0.057654627571343 |
54 |
IV. Investment Strategy Comparison: XCN vs GRT
Long-term vs Short-term Investment Strategies
-
XCN: May be suitable for investors seeking exposure to Web3 blockchain infrastructure developments through the Onyx Protocol ecosystem. The asset's positioning within decentralized infrastructure could appeal to those monitoring emerging protocol adoption and ecosystem expansion over extended timeframes.
-
GRT: May be suitable for investors interested in established Web3 data infrastructure with demonstrated utility in blockchain indexing and querying services. The protocol's role in supporting decentralized applications across multiple networks could attract those evaluating foundational infrastructure assets.
Risk Management and Asset Allocation
-
Conservative Investors: A balanced approach might consider allocation ratios such as XCN: 30-40% vs GRT: 60-70%, reflecting GRT's more established market position and infrastructure role. Conservative strategies typically emphasize assets with demonstrated utility and broader market recognition.
-
Aggressive Investors: Higher-risk tolerance portfolios might explore allocation ratios such as XCN: 50-60% vs GRT: 40-50%, incorporating potential upside from emerging protocol developments while maintaining exposure to established infrastructure assets.
-
Hedging Tools: Portfolio risk management may incorporate stablecoin allocations for liquidity preservation, options strategies for downside protection, and cross-asset diversification to mitigate concentration risk within specific protocol categories.
V. Potential Risk Comparison
Market Risk
-
XCN: The asset demonstrates substantial price volatility, as evidenced by historical price movements from peak to trough levels. Trading volume fluctuations and market cap positioning at #161 may contribute to liquidity considerations during market stress periods.
-
GRT: While maintaining a higher market cap ranking at #139, GRT has experienced considerable price corrections from historical highs. Market sentiment shifts, broader crypto market cycles, and Web3 adoption trends influence price dynamics and volatility patterns.
Technical Risk
-
XCN: Technical development information and network performance metrics require ongoing monitoring. Protocol scalability, network stability, and ecosystem integration capabilities represent areas for continued evaluation.
-
GRT: As blockchain indexing infrastructure, technical considerations include network efficiency, data accuracy, protocol upgrade execution, and potential vulnerabilities in decentralized query systems. The protocol's ability to scale with increasing Web3 data demands remains a key technical factor.
Regulatory Risk
- Global regulatory frameworks continue to evolve across different jurisdictions, impacting crypto asset classifications, trading requirements, and institutional participation. Both XCN and GRT operate within this dynamic regulatory landscape. Infrastructure protocols like GRT may face regulatory considerations related to data services and network operations, while emerging protocols encounter varying degrees of regulatory clarity across markets. Policy developments regarding decentralized technologies, cross-border transactions, and digital asset classifications can influence market access and adoption trajectories for both assets.
VI. Conclusion: Which Is the Better Buy?
📌 Investment Value Summary:
-
XCN Characteristics: Positioned within Web3 blockchain infrastructure through the Onyx Protocol, with a current market cap of approximately $382 million and ranking at #161. The asset demonstrates significant historical price volatility and maintains a substantial circulating supply of 42.5 billion tokens.
-
GRT Characteristics: Established as decentralized protocol infrastructure for blockchain data indexing and querying since December 2020, with a market cap of around $448 million and ranking at #139. The protocol serves foundational roles in Web3 application development and maintains high circulating supply percentage at 98.84% of maximum supply.
✅ Investment Considerations:
-
Beginner Investors: May consider starting with thorough research into each protocol's fundamental purpose, ecosystem role, and market positioning. Understanding basic concepts of blockchain infrastructure, tokenomics, and market dynamics forms the foundation for informed decision-making. Gradual exposure through small position sizes and continuous learning about protocol developments can help build familiarity with the assets.
-
Experienced Investors: May evaluate both assets within broader portfolio context, considering factors such as correlation with other holdings, infrastructure thesis alignment, and risk-adjusted return expectations. Technical analysis of price patterns, on-chain metrics monitoring, and ecosystem development tracking can inform position sizing and entry timing decisions.
-
Institutional Investors: May assess both protocols through frameworks evaluating infrastructure utility, adoption metrics, regulatory positioning, and liquidity characteristics. Due diligence processes might incorporate protocol governance analysis, technical audit reviews, market structure evaluation, and alignment with institutional investment mandates regarding digital infrastructure exposure.
⚠️ Risk Disclaimer: Cryptocurrency markets exhibit extreme volatility and substantial risk. Historical performance does not indicate future results. This content does not constitute investment advice, and individuals should conduct independent research and consult qualified financial advisors before making investment decisions.
VII. FAQ
Q1: What are the key differences between XCN and GRT in terms of their primary use cases?
XCN serves as the backbone token for the Onyx Protocol's Web3 blockchain infrastructure, while GRT functions as the decentralized protocol for indexing and querying blockchain data, primarily supporting Ethereum and other blockchain networks. GRT has established a more defined role in Web3 data infrastructure since its December 2020 launch, providing essential indexing services for decentralized applications. XCN's specific ecosystem applications within the Onyx Protocol are less extensively documented, representing an emerging infrastructure project with ongoing development. The fundamental distinction lies in GRT's proven utility as data infrastructure versus XCN's positioning within a developing protocol ecosystem.
Q2: How do the current market capitalizations and rankings of XCN and GRT compare?
As of January 15, 2026, GRT maintains a higher market position at rank #139 with approximately $448 million market capitalization, compared to XCN's rank #161 with approximately $382 million market cap. GRT demonstrates a price of $0.04195 versus XCN's $0.008993, though XCN shows higher 24-hour trading volume at $2,064,821.99 compared to GRT's $325,849.51. The circulating supply differs substantially, with XCN at 42.5 billion tokens and GRT at 10.7 billion tokens (representing 98.84% of maximum supply). These metrics suggest GRT maintains broader market recognition and established positioning within the crypto infrastructure sector.
Q3: Which asset presents higher risk-reward potential based on historical price performance?
XCN demonstrates more extreme volatility, declining from its May 2022 peak of $0.184139 to an October 2023 low of $0.0007055, representing a substantial correction range. GRT experienced a decline from its February 2021 all-time high of $2.84 to $0.03272768 in January 2026, also showing considerable downside but maintaining relatively higher current price levels. From current prices, conservative 2026 forecasts project XCN potentially ranging $0.00809-$0.01351, while GRT ranges $0.03448-$0.05719. The broader percentage potential upside for XCN comes with correspondingly higher volatility risk and less established market positioning compared to GRT's infrastructure role.
Q4: What allocation strategy might suit different investor risk profiles when considering both assets?
Conservative investors might consider a 30-40% XCN / 60-70% GRT allocation, emphasizing GRT's established infrastructure role and broader market recognition while maintaining limited exposure to XCN's emerging protocol potential. Aggressive investors with higher risk tolerance could explore 50-60% XCN / 40-50% GRT ratios, incorporating greater exposure to XCN's potential upside while maintaining GRT as a foundational infrastructure holding. Both strategies benefit from stablecoin allocations for liquidity management and cross-asset diversification to mitigate concentration risk. Portfolio construction should align with individual risk tolerance, investment timeframes, and overall exposure to crypto infrastructure assets.
Q5: How do technical development and ecosystem maturity compare between the two protocols?
GRT demonstrates more extensive technical documentation and established ecosystem presence, providing blockchain data indexing services that support Web3 application development across multiple networks. The protocol continues advancing through upgrades focused on network efficiency and expanded blockchain ecosystem support. XCN's technical development details and ecosystem integration remain less extensively documented in available materials, representing an earlier-stage infrastructure project. The maturity difference reflects GRT's longer operational history since December 2020 versus XCN's emerging positioning. Investors evaluating technical risk should consider protocol development transparency, network performance metrics, and ecosystem adoption indicators.
Q6: What macroeconomic factors might influence the relative performance of XCN versus GRT?
Both assets face similar macroeconomic influences including interest rate policies, US dollar strength, and overall crypto market liquidity conditions. GRT's established role in Web3 infrastructure may position it to benefit from broader decentralized technology adoption trends and increased developer activity during favorable market cycles. XCN's performance may correlate more closely with emerging protocol adoption patterns and Web3 blockchain infrastructure investment flows. Regulatory developments regarding digital infrastructure services could differentially impact both assets based on their specific protocol functions. Inflationary environments and monetary policy shifts influence overall crypto market risk appetite, affecting both assets through broader market sentiment and capital allocation patterns.
Q7: What are the primary regulatory considerations investors should monitor for both assets?
Both XCN and GRT operate within evolving global regulatory frameworks affecting crypto asset classifications, trading requirements, and institutional participation standards. GRT faces potential regulatory considerations related to data services, network operations, and its role as blockchain infrastructure supporting decentralized applications. XCN encounters regulatory clarity challenges common to emerging protocol tokens across different jurisdictions. Policy developments regarding decentralized technologies, cross-border digital transactions, and infrastructure service classifications may influence market access and adoption trajectories for both assets. Investors should monitor jurisdiction-specific regulatory announcements, institutional custody developments, and policy frameworks addressing blockchain infrastructure protocols.
Q8: Based on long-term price forecasts through 2031, which asset shows stronger projected growth potential?
Long-term forecasts through 2031 project XCN's baseline scenario ranging $0.01157-$0.01961 with optimistic potential reaching $0.02333, representing approximately 159% upside from current prices under optimistic conditions. GRT's 2031 baseline projects $0.05765-$0.06478 with optimistic scenarios reaching $0.08098, representing approximately 93% upside from current levels. While XCN shows higher percentage potential appreciation, this comes with correspondingly greater uncertainty given its earlier-stage positioning and less established market presence. GRT's projections reflect more stable growth expectations aligned with Web3 infrastructure adoption trends. These forecasts remain highly speculative and subject to numerous variables including technology adoption, market cycles, and competitive developments within the blockchain infrastructure sector.
* The information is not intended to be and does not constitute financial advice or any other recommendation of any sort offered or endorsed by Gate.