Bitcoin Plunges Below $90,000: $520M Liquidation Wave Hits as On-Chain Data Flashes Bearish Signals

Last Updated 2026-03-26 22:30:32
Reading Time: 1m
Bitcoin’s price came under sharp selling pressure, dropping below $90,000 and triggering more than $520 million in liquidations over 24 hours. On-chain metrics indicate there may be additional downside risk. This article analyzes the underlying causes and examines key support levels to watch going forward.

Bitcoin Market Turmoil: Why Did the Price Drop Below $90,000?
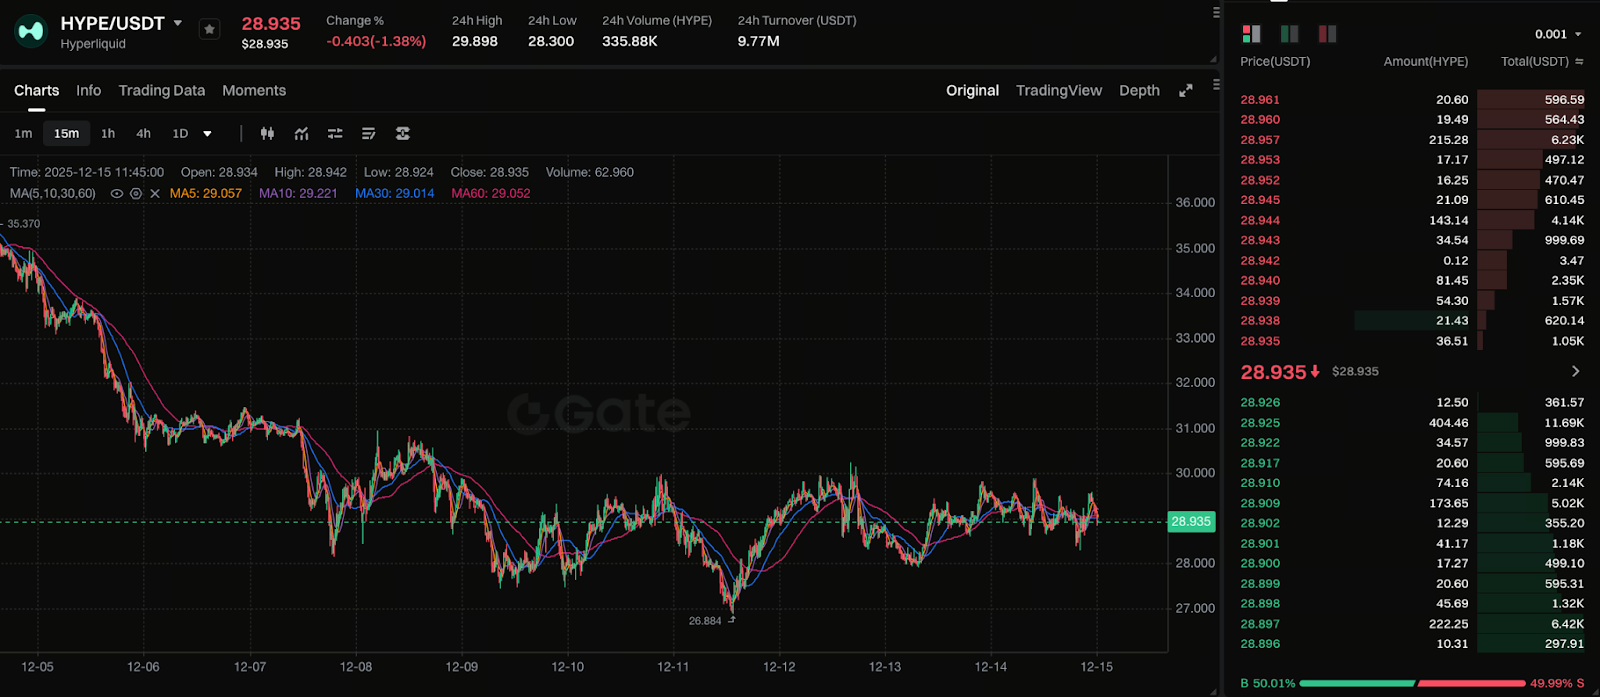

Chart: https://www.gate.com/trade/BTC_USDT

Recently, Bitcoin (BTC) saw a sharp pullback amid significant volatility across the global crypto market. The price quickly dropped below the crucial $90,000 psychological and technical support level, triggering a swift shift in market sentiment from caution to outright panic. According to the latest data, BTC briefly fell to around $88,000 before fluctuating within a high-volatility range.

This downturn results from a combination of macroeconomic factors, market structure, and capital flows—rather than a single cause.

Multiple Bearish Drivers: Core Reasons for Bitcoin’s Downward Pressure

Macroeconomic uncertainty has become a major headwind for risk assets. After the Federal Reserve released its latest policy signals, market expectations for the future economic outlook and monetary policy trajectory diverged, causing risk appetite to cool sharply.

High leverage across the crypto market further fueled the sell-off. When prices broke through key support levels, a wave of liquidations hit highly leveraged long positions, intensifying short-term selling pressure and accelerating the price decline.

$520M Liquidation Wave: Panic Selling Intensifies

Within 24 hours of Bitcoin’s steep drop, the crypto market saw more than $520 million in forced liquidations. Of this total, roughly $379 million came from long positions, highlighting the market’s previous overexposure to bullish bets.

Liquidation waves often fuel a self-reinforcing feedback loop:

  • Forced selling triggered by liquidations
  • Prices fall further
  • Additional positions are liquidated

This chain reaction not only increases volatility but also erodes market confidence, prompting some investors to proactively reduce their risk exposure.

Bearish On-Chain Data: Short-Term Downside Risk Persists

On-chain metrics also signal a bearish outlook. Sentiment indicators like the on-chain “Bull Score” have dropped to historical lows, reflecting continued market pessimism. At the same time, realized losses have yet to reach the levels typically seen during periods of “extreme panic,” suggesting, based on historical trends, that the true medium- to long-term buying window may not have fully materialized.

Additionally, the share of put positions in the BTC options market has increased, indicating that institutions and professional traders continue to hedge against further downside risk.

Federal Reserve Policy Impact: Risk Assets Under Pressure

From a broader macro perspective, recent statements from the Federal Reserve have deeply influenced market sentiment. While rates were nominally cut, the policy statement emphasized economic uncertainty, prompting investors to reassess the value of risk assets in their portfolios.

This shift in sentiment is evident not only in equities but also in the crypto market, as risk-off flows drive capital toward more defensive asset classes.

Key Support Levels and Investor Strategies

Amid heightened volatility, the market is focused on the following support zones:

  • Around $90,000: a major psychological and technical support level
  • Around $87,000: a lower support zone driven by sentiment and market structure

If BTC holds within these ranges, a short-term technical rebound remains possible. For investors with lower risk tolerance, reducing positions, managing leverage, and maintaining liquidity should remain top priorities. Long-term investors should monitor on-chain data, capital flows, and macroeconomic conditions to determine whether the market is approaching a more attractive entry point.

Conclusion: Short-Term Volatility Does Not Signal a Long-Term Trend Reversal

Overall, Bitcoin’s break below $90,000 reflects a phase of adjustment caused by macroeconomic headwinds and high leverage, not a fundamental rejection of its long-term value.

In a market defined by rising uncertainty, rationally managing volatility, prioritizing risk controls, and making decisions based on both on-chain and macro signals will prove more effective than simply betting on market direction.

Author: Max
Disclaimer
* The information is not intended to be and does not constitute financial advice or any other recommendation of any sort offered or endorsed by Gate.
* This article may not be reproduced, transmitted or copied without referencing Gate. Contravention is an infringement of Copyright Act and may be subject to legal action.

Related Articles

AI-Native Settlement Layers: How United Stables Is Building the Next Financial Rail
Beginner

AI-Native Settlement Layers: How United Stables Is Building the Next Financial Rail

Stablecoins were originally designed as dollar substitutes within exchanges, primarily used for asset pricing and trade settlement. As on-chain financial ecosystems have matured, their role has expanded beyond simple payments to include collateral assets, cross-chain liquidity mediums, and unified settlement units. In particular, as AI systems and automated agents begin to participate directly in economic activity, demand has risen sharply for programmable value units capable of instant settlement. This shift is pushing stablecoins toward the role of foundational financial infrastructure.
2026-03-25 03:16:17
The ve(3,3) Flywheel Explained: How AERO Tokenomics Powers Aerodrome’s DeFi Economy
Beginner

The ve(3,3) Flywheel Explained: How AERO Tokenomics Powers Aerodrome’s DeFi Economy

In the competition for DeFi liquidity, high-inflation mining alone is no longer enough to build lasting advantages. Aerodrome applies the ve(3,3) economic model to redesign token emissions, voting mechanisms, and revenue distribution, creating a liquidity flywheel centered on governance and cash flow. This article examines AERO tokenomics, the veAERO locking mechanism, and protocol revenue models to explain how Aerodrome builds a sustainable DeFi economic system.
2026-03-25 06:41:58
How Does PAXG Work? In-Depth Overview of the Physical Gold Tokenization Mechanism
Beginner

How Does PAXG Work? In-Depth Overview of the Physical Gold Tokenization Mechanism

PAXG (Pax Gold) is a tokenized asset backed by physical gold, issued by the fintech company Paxos and traded on the Ethereum blockchain as an ERC-20 token. The core concept is to tokenize physical gold on-chain, with each PAXG token representing ownership of a certain amount of gold. This structure enables investors to hold and trade gold in the form of a digital asset.
2026-03-24 19:12:51
Aerodrome Tokenomics: How ve(3,3) Powers Base's Most Profitable DEX
Beginner

Aerodrome Tokenomics: How ve(3,3) Powers Base's Most Profitable DEX

AERO is the native token of Aerodrome Finance, a core decentralized exchange and liquidity protocol in the Base ecosystem. It is primarily used for liquidity incentives and ecosystem operations. veAERO is a governance NFT that users receive by locking AERO, representing both voting power and the right to share protocol revenue. Through a dual track structure of AERO as a utility token and veAERO as a governance credential, Aerodrome separates liquidity usage value from long term governance power, allowing participants to act as liquidity providers, governance decision makers, and revenue sharers within the same system.
2026-03-25 06:40:31
How is the price of PAXG determined? Pegging mechanism, trading depth, and influencing factors
Beginner

How is the price of PAXG determined? Pegging mechanism, trading depth, and influencing factors

PAXG (Pax Gold) is a tokenized asset backed by physical gold reserves, launched by fintech firm Paxos and issued as an ERC-20 token on the Ethereum blockchain. The core concept is to digitally represent real-world gold assets, allowing investors to hold and trade gold via the blockchain network. Because each PAXG token corresponds to a specific quantity of physical gold, its price is theoretically expected to closely track the global gold market.
2026-03-24 19:11:40
Hybrid Collateral Stablecoins: Inside United Stables' Stability and Yield Architecture
Beginner

Hybrid Collateral Stablecoins: Inside United Stables' Stability and Yield Architecture

In the early stages of the crypto market, traditional stablecoins mainly relied on single-reserve or single-collateral models. Their primary focus was price stability and payment convenience, which allowed them to become foundational tools for on-chain trading and capital flows. As the market has entered a more mature financial phase, however, this structure has begun to reveal limitations, including high concentration risk and the difficulty of balancing liquidity with yield. These constraints have driven the evolution toward multi-layer collateral and portfolio-based designs, such as the dual-layer hybrid collateral architecture proposed by United Stables, which seeks to redefine the underlying logic of stable assets.
2026-03-25 03:17:39