Price is the outcome; on-chain is the process.
In the blockchain market, many participants rely on candlestick charts (K-lines) to gauge trends. However, the true determinant of trend sustainability is how capital enters, how tokens are transferred, and whether profit-taking positions are being cashed out uncontrollably. The real value of on-chain data isn't about "miraculous predictions"—it's about shifting the market narrative from sentiment to verifiable behavioral evidence.
Why On-Chain Data Is Critical in the Early Bull Run
The hallmark of an early bull run isn't "relentless gains," but "structural repair amid repeated volatility." Focusing solely on price during this period can leave you vulnerable to false breakouts and misleading volatility. However, by also monitoring on-chain data, you can more accurately identify whether a primary trend is truly taking shape.
On-chain data offers three core advantages:
- Verifiability: Capital flows, address activity, and token distribution can all be continuously tracked.
- Leading Indicator: Structural changes often occur on-chain before they become evident in price.
- Noise Resistance: Compared to short-term news shocks, on-chain slow variables are far more stable.
Thus, when assessing the sustainability of a bull run, the key isn't "how much prices have risen," but "whether the underlying structure is improving."
Six Recurring Signals Before Every Bull Run
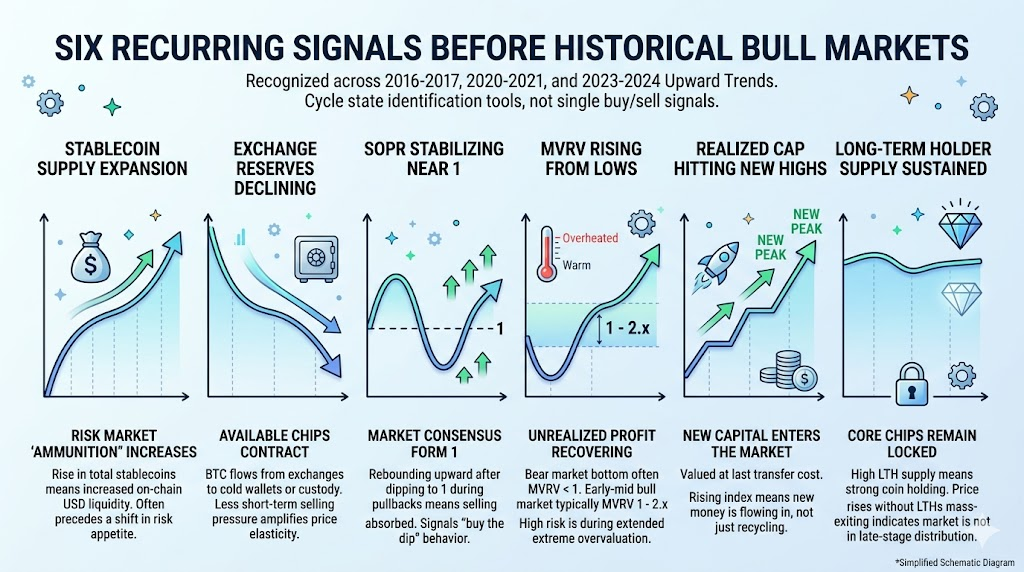
The following signals have repeatedly surfaced during the bullish phases of 2016–2017, 2020–2021, and 2023–2024. They're not single-point buy/sell signals, but tools for identifying cyclical market states.
Stablecoin Supply Expansion: More "Ammunition" for Risk Markets
Rising stablecoin supply essentially means more on-chain USD liquidity. Historically, sustained expansion of stablecoin supply has often preceded a resurgence in market risk appetite.
Declining Exchange Reserves: Fewer Tokens Available for Sale
When BTC moves from exchanges to cold wallets, custody accounts, or long-term addresses, the amount of tokens available for short-term sale decreases. When supply contracts while demand recovers, price elasticity is typically amplified.
SOPR Stabilizes Near 1
SOPR measures whether on-chain spent outputs are being realized at a profit.
- SOPR > 1: The majority are realizing profits.
- If SOPR approaches 1 during a pullback and then rises again, it usually signals that selling pressure has been absorbed.
Historically, this marks the market's shift toward a "buy-the-dip" consensus.
MVRV Recovers from Lows, But Avoids Overheating
MVRV gauges unrealized profit levels.
- Bear market bottoms often see MVRV < 1.
- Early to mid bull runs typically see MVRV return to the 1–2.x range.
- True high-risk zones emerge during sustained, overheated plateaus.
Realized Cap Continues to Hit New Highs
Realized Cap represents the total capital valued at the last transfer cost. A rising Realized Cap means new capital is consistently entering the market, not just internal rotation of existing capital.
Long-Term Holder Supply Remains Elevated
A high LTH supply indicates a strong lock-up of core tokens. If prices rise and LTH does not rapidly decline, it usually means the market hasn't entered the late-stage distribution phase.
The 2026 On-Chain Data Landscape (as of April 2026 Public Disclosure)
Let's place recent public data into the same framework, focusing on direction and portfolio relationships over absolute values.
1. Liquidity: Stablecoin Supply Remains High
According to public data, as of April 2026, the total stablecoin market cap is approximately $318.6 billion–$320 billion. This size demonstrates that on-chain liquidity remains robust, providing the "fuel" needed for risk assets to move higher.
2. Cost: Realized Cap Continues to Rise
Public data shows BTC Realized Cap is around $1.06 trillion. This typically means both new and existing capital are being repriced, with the long-term cost basis rising—rather than prices being driven solely by short-term leverage.
3. Profitability: MVRV Is Mid-Range, Not Overheated
MVRV is currently around 1.26, placing it in the "profit recovery but not overheated" zone. Compared to historical market tops, this is more indicative of a mid-stage structure rather than a late-stage bubble.
4. Token Supply: Long-Term Holder Supply Remains High
LTH Supply is around 14.65 million BTC by public metrics. This suggests the market's core token holdings remain stable; unless we see rapid, continuous distribution, the structure remains resilient.
5. Breadth: Profit Supply Percentage Not at Extremes
Percent Supply in Profit is currently in the 53%–58% range. Historical market tops are marked by extremely high profit coverage rates; at present, we have not reached the typical "market-wide profit frenzy" phase.
6. Demand: ETF Flows Show Signs of Recovery
Media reports show that in March 2026, US spot BTC ETFs saw about $1.32 billion in net monthly inflows, with strong single-day inflows in early April. While this is off-chain data, it's a critical indicator for validating the return of new demand.
Current Market Phase: Early, Middle, or Late?
| Dimension |
2017 Early Bull |
2020 Early Bull |
2026 Current (as of April data) |
Current Phase Indication |
| Stablecoins (Liquidity) |
Small early, surge later |
Continuous expansion, more "ammunition" for risk assets |
High total (~$318.6B–$320B) |
Liquidity base intact, supports continuation over exhaustion |
| Exchange Reserves (Tradable Tokens) |
Declining, tradable supply tightens |
Significant drop, clear supply contraction |
Multiple sources show low range |
Supply side remains tight, indicative of continuation |
| MVRV (Unrealized Profit) |
Rises from lows, overheats later |
Recovers then expands, overheats late |
~1.26, mid-range recovery |
No late-stage mania signals |
| SOPR (Profit-Taking Behavior) |
Rises after nearing 1 during pullbacks |
Supported near 1 multiple times |
Oscillates around 1, rebalancing |
Buying support remains, continuation logic |
| LTH (Long-Term Holders) |
Mainly holding early, distribution increases late |
High for long, distribution accelerates late |
~14.65M BTC, still high |
Old tokens not exiting en masse, not late-stage |
| Profit Percentage (Supply in Profit) |
Rises from median to high, extremes late |
Very high in mid-late stage |
~53%–58%, not extreme |
Profit recovery, not overheated |
Overlaying historical patterns with current data points to a pragmatic conclusion: the market is closer to a bull run continuation or reaccumulation phase, not a classic late-stage mania.
Supporting evidence for this view:
- Stablecoin supply remains high, liquidity is intact;
- Realized Cap is climbing, signaling new capital inflows;
- MVRV and profit percentages are not at extreme levels;
- LTH supply remains elevated, with no signs of broad distribution.
However, it's critical to monitor for inflection points. If the following occur simultaneously, defensive action should be taken:
- SOPR repeatedly breaks below 1 with weak rebounds;
- Exchange reserves rise consistently, signaling an increase in tradable tokens;
- LTH supply drops rapidly, indicating old tokens are being cashed out quickly;
- Profit indicators plateau at high levels, accompanied by broad declines in risk assets.
Actionable Weekly Tracking Template
You don't need to monitor dozens of indicators—consistency is key. Focus weekly on these five groups:
- Liquidity: Weekly changes in total stablecoin market cap; net issuance and cross-chain movements of major stablecoins.
- Profit Structure: MVRV range; whether SOPR remains above 1; changes in profit supply percentage.
- Token Structure: BTC exchange reserve trends; LTH/STH supply rotation.
- Demand & Activity: Trends in active addresses and number of trades; whether capital is concentrated in a single narrative or spread across multiple zones.
- External Inflows: ETF net inflow trends; whether macro liquidity changes support risk appetite.
Four Common Pitfalls in On-Chain Research
The biggest risk in on-chain research is "tracking the right indicators, but misreading the context." Common mistakes include:
- Focusing on a single indicator: Any metric can be misleading in isolation; always use a portfolio approach.
- Relying on single-day data: On-chain short-term noise is high; always review at least weekly trends.
- Confusing correlation with causation: Indicators moving together don't imply direct causality; always cross-validate.
- Ignoring off-chain factors: ETFs, regulation, and macro interest rates can significantly alter on-chain dynamics.
Conclusion: Use Evidence Chains to Judge Trends, Not Emotions
On-chain data can't guarantee you'll always "buy the bottom or sell the top," but it can consistently improve your success rate in identifying market cycles.
As of April 2026 public data, the market is best described as a "structurally bullish, rhythmically volatile" mid-stage: liquidity is present, cost bases are rising, profits are recovering, but there are no signs of classic late-stage overheating.
For content creators, researchers, and traders, the most valuable practice isn't declaring "the bull run is here," but being able to answer these three questions every week:
- Is new capital consistently entering?
- Are old tokens beginning systematic distribution?
- Is the profit structure approaching overheating?
As long as these three answers remain healthy, the trend has the foundation to continue; once they deteriorate together, risk management must take precedence over narrative.