SanDisk (SNDK) independently listed on the Nasdaq in 2025 after spinning off from Western Digital. SNDK stock carries the NAND wafer, SSD, and embedded flash memory businesses, with performance closely tied to NAND pricing, SSD shipments, and capital expenditure.
Post-spinoff, SNDK and WDC operate under different tickers and separate financial reporting. Using Western Digital's combined data can distort cycle assessments. A more reliable approach divides indicators into three layers: business (NAND supply and SSD demand), financial (profitability and cash conversion), and trading (ticker and capital scope), then cross-validates them instead of relying on single-quarter revenue changes alone.
Why Indicator Scope Matters for SNDK Stock Analysis
SNDK analysis must rely on SanDisk Corporation's independent disclosures, not Western Digital's pre-spinoff combined figures. SanDisk Spinoff and the WDC/SNDK Relationship defines post-spinoff business boundaries: WDC keeps HDD, SNDK takes Flash and SSD. Pre-spinoff data blends both technology tracks, so using it directly for SNDK cycle analysis introduces structural errors.
SNDK's cycle drivers differ from WDC's HDD logic and cannot be simplistically compared to Micron's DRAM framework. SNDK vs WDC vs Micron outlines the boundaries for peer comparison. When reading financial reports, verify the continuing operations scope, spin-off one-time adjustments, and whether management guidance applies to SNDK as a standalone entity.
| Scope Type |
Common Confusion Point |
Verification Key |
| Pre-spinoff combined scope |
Using WDC's historical Flash data as SNDK's baseline |
Refer to SNDK's independent post-listing disclosures |
| Simplistic peer comparison |
Applying DRAM cycles to explain NAND moves |
Separate NAND and DRAM supply-demand dynamics |
| Brand vs. entity |
Treating the SanDisk consumer brand as total revenue |
Differentiate enterprise SSD, client, and embedded segments |
| Stock ticker |
Mistakenly selecting WDC or another storage stock |
Confirm Nasdaq ticker SNDK and SanDisk Corporation |
Only after unifying the indicator scope can subsequent interpretations of revenue, gross margin, and NAND cycle indicators become comparable.
How to Read SNDK Revenue and Gross Margin
SNDK revenue comes from NAND chips, enterprise and client SSDs, and embedded flash memory. SNDK Business Structure and Product Matrix breaks down product lines by application. Revenue analysis should consider both total and mix: enterprise SSDs command higher margins, client SSDs are more price-sensitive, and embedded/automotive segments face certification cycle lags.
Gross margin is SNDK's most critical earnings quality metric. Higher average NAND prices, a larger share of high-margin categories, and improved utilization support margin expansion; oversupply or channel destocking can compress it. If revenue grows but margin declines, cross-validate with NAND prices, category ASPs, and inventory to isolate volume and price effects.
How NAND Prices and Shipments Signal Cycles
SNDK stock is tightly linked to the NAND Flash industry cycle, with cycle indicators as the primary tool for gauging market position. The transmission chain: wafer capex shapes supply, cloud infrastructure and PC replacement cycles drive shipments, and average NAND prices then flow into SSD pricing and margins.
On the supply side, track capacity additions and utilization. On the demand side, separate enterprise SSDs (cloud capex, AI clusters) from client SSDs (PC upgrades, channel inventory). Prices must be cross-checked against shipment volumes and product mix.
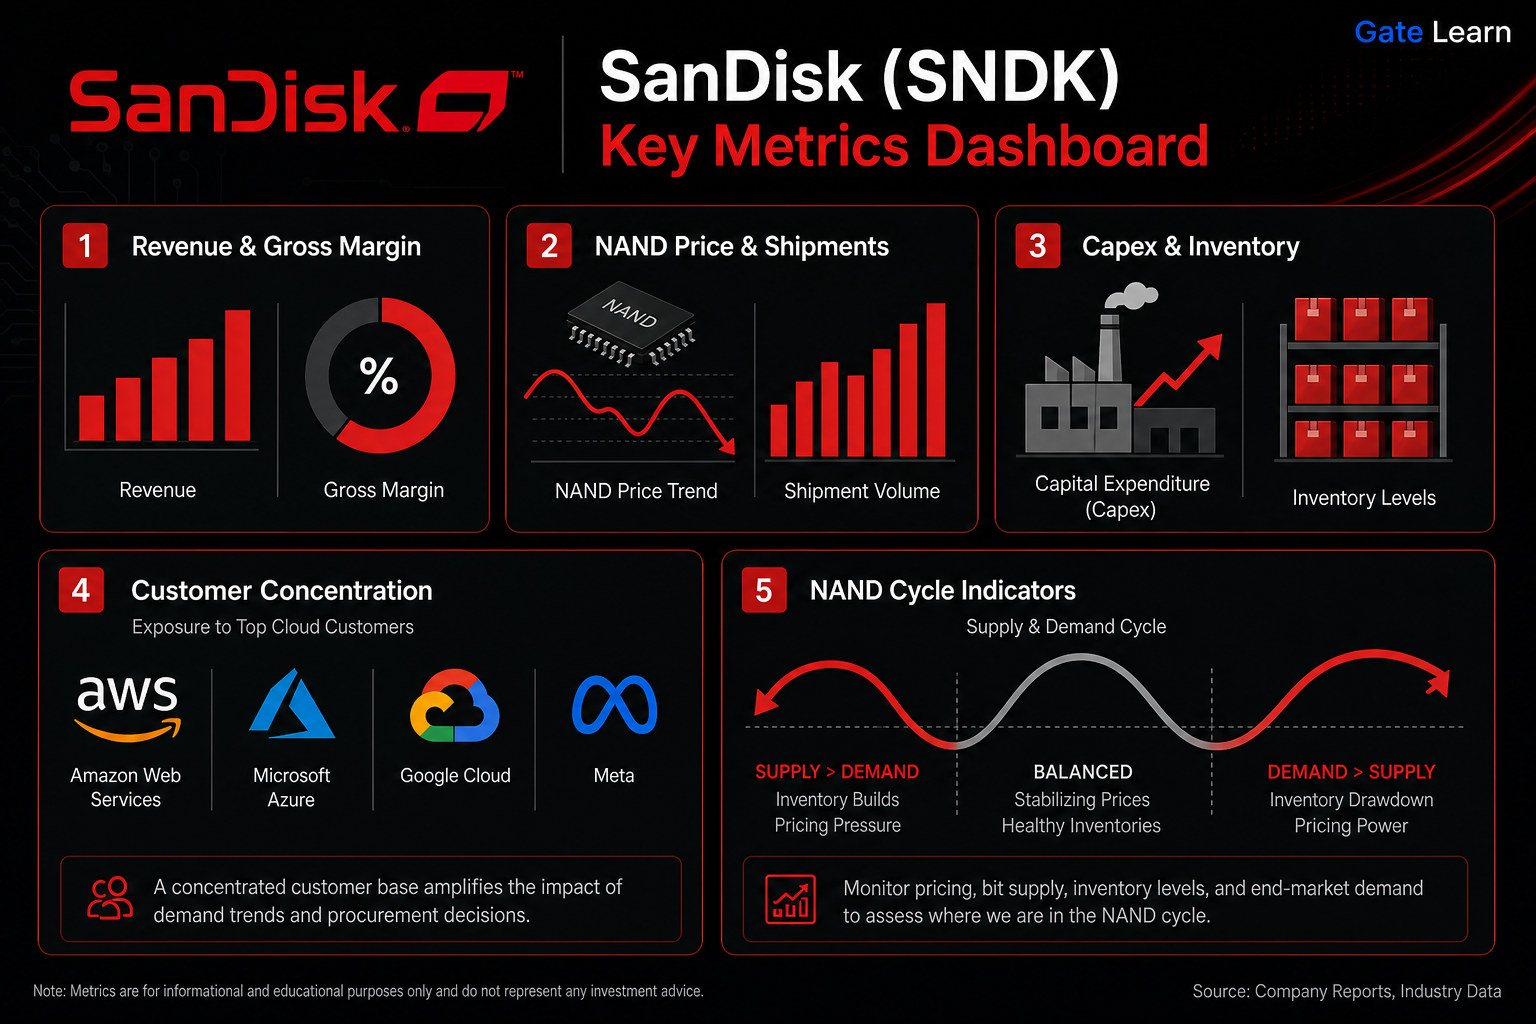 Figure 1. SNDK Core Metrics Dashboard: Revenue and Gross Margin, NAND Price and Shipments, Capex and Inventory, and Customer Concentration form the backbone of NAND cycle analysis.
| NAND Cycle Indicator |
Supply-Side Signal |
Demand-Side Signal |
Implications for SNDK |
| Average NAND Price |
Capacity additions, competitive landscape |
Inventory drawdown, downstream restocking |
Affects chip margin and pricing power |
| SSD Shipments |
Product certification, capacity |
Cloud procurement, PC upgrade cycle |
Drives revenue scale and high-margin mix |
| Capacity Utilization |
Fab ramp-up, process yield |
— |
Impacts unit cost and marginal profit |
| Channel Inventory |
Manufacturer and distributor stocking |
End-market sell-through |
Leads or lags price inflection points |
If prices recover but shipments stall, supply may be shrinking; if shipments grow but prices decline, volume may be substituting for price. SNDK cycle judgment requires combining both sets of signals.
What Capex and Inventory Turnover Reveal
Capital expenditure (Capex) determines the medium- to long-term NAND supply curve. SNDK's investments in process node transitions and wafer capacity shape future unit costs; capex expansion typically precedes capacity additions, which can later pressure prices. Inventory turnover reflects channel health: high levels often signal a destocking cycle with margin compression, while falling inventory may accompany restocking and shipment improvements. Inventory days, impairment charges, and management commentary in SNDK earnings are supplementary cycle indicators. The alignment of capex with free cash flow is also critical, as financial flexibility may be tested during downturns.
How Customer Concentration Drives Earnings Volatility
SNDK serves cloud providers, OEMs, automotive electronics, and industrial clients. Large cloud customers' bulk purchases or project delays can significantly impact single-quarter shipments; rising concentration amplifies reliance on a few demand sources. Automotive and embedded projects have longer cycles, with revenue recognition potentially lagging consumer channel swings. The share of top five customers and downstream industry distribution in earnings reports should be factored into the risk framework. Customer concentration is a fundamental variable; Buy SNDK on Gate involves separate trading execution risks (ticker, USDT scope, platform rules) that require independent checks.
SNDK Stock Risk Checklist
The table below organizes NAND cycle indicators, spinoff scope, and platform trading fields into an item-by-item checklist. It does not constitute buy or sell advice.
| Check Item |
What to Verify |
Risk Type |
| Stock Ticker and Entity |
Page shows SNDK, SanDisk Corporation, not WDC |
Trade misselection |
| Financial Report Scope |
Use SNDK independent disclosures, not WDC combined history |
Analysis bias |
| Revenue Structure |
Enterprise / Client / Embedded share and trends |
Business structure |
| Gross Margin |
Overall and category movement direction |
Earnings quality |
| Average NAND Price |
Consistency with peers and own ASP |
Cycle position |
| SSD Shipments |
Shipments by scenario and channel inventory |
Demand strength |
| Capital Expenditure |
Capex scale and capacity ramp timing |
Supply forward look |
| Inventory Turnover |
Inventory levels and impairment signs |
Cycle lag indicator |
| Customer Concentration |
Top customer share and purchasing patterns |
Earnings volatility |
| Free Cash Flow |
Operating cash flow vs. capex and debt |
Financial flexibility |
| Platform Rules |
Trading hours, fees, USDT transfers, regional restrictions |
Execution risk |
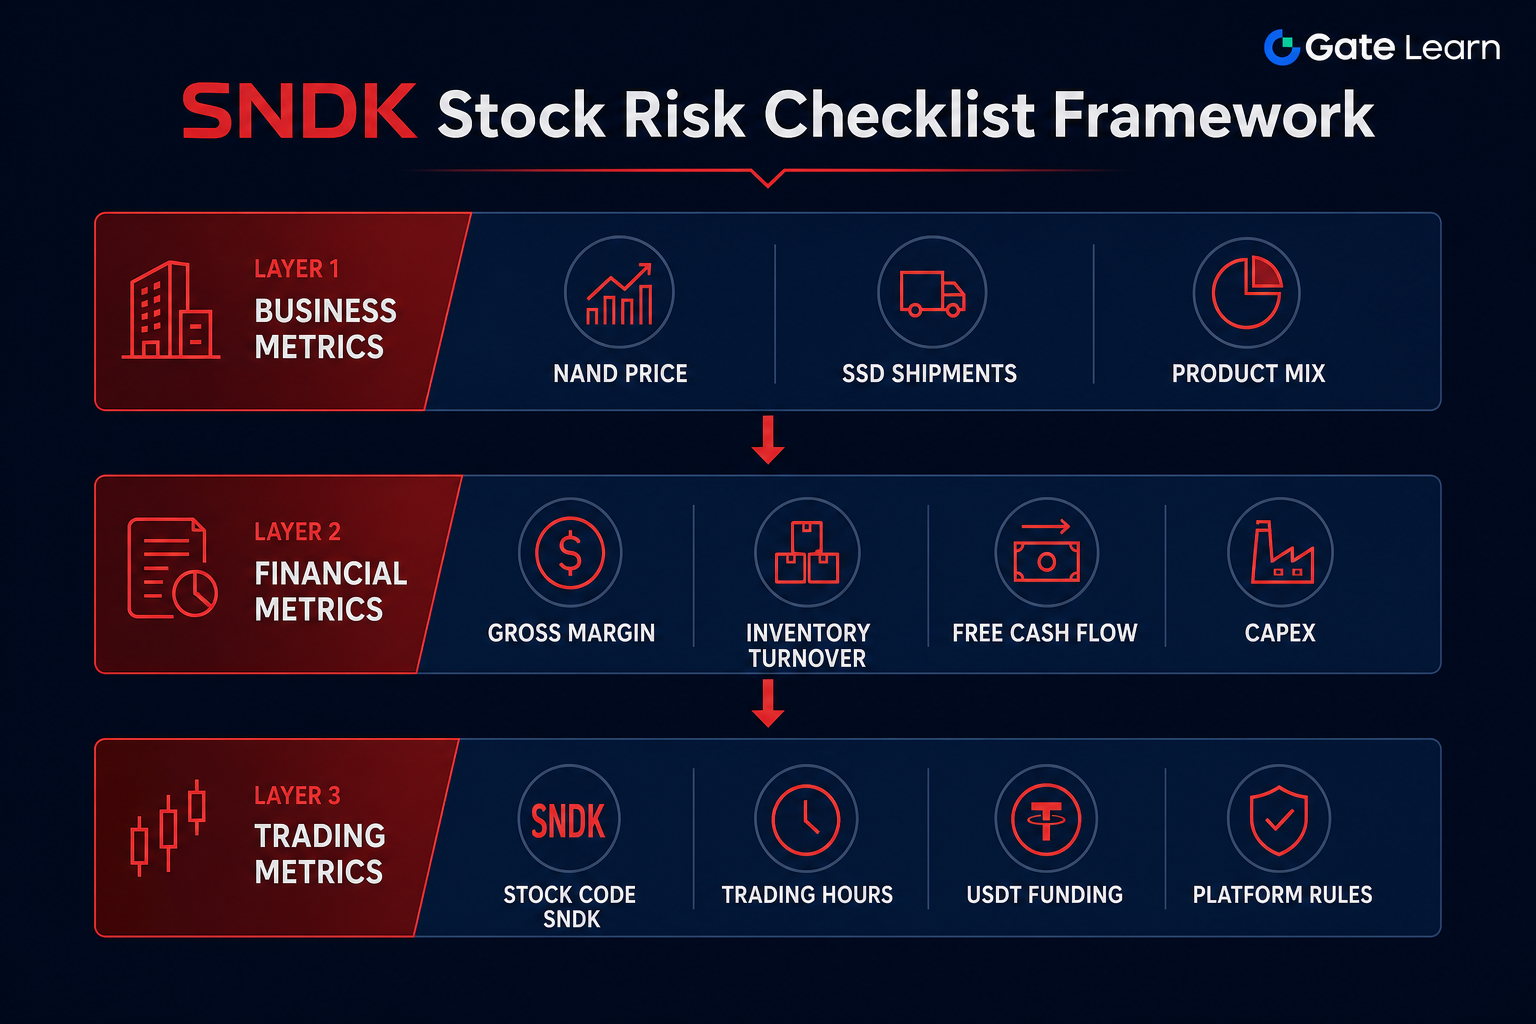 Figure 2. SNDK Stock Risk Checklist Framework: Cross-validating business, financial, and trading layers reduces single-data misinterpretation and ticker confusion.
Even when business indicators improve, the trading-layer ticker must still be confirmed. A live trading page does not mean the NAND cycle has turned. SNDK and WDC should each maintain separate independent check records.
Summary
SNDK stock analysis should center on NAND cycle indicators: revenue and gross margin reflect price transmission; average NAND price and SSD shipments depict supply-demand dynamics; capex and inventory provide forward signals; and customer concentration affects volatility. Post-spinoff, rely on SNDK's independent financial reports and distinguish technology lines when comparing with WDC and Micron. Cross-validating business, financial, and trading layers reduces scope confusion and single-indicator misinterpretation.
FAQ
What is the key metric for analyzing SNDK stock?
Core metrics include total revenue and gross margin, average NAND price, SSD shipments by scenario, capex, inventory turnover, customer concentration, and free cash flow. SNDK offers pure NAND cycle exposure, and the gross margin–NAND price linkage is typically the primary entry point for assessing earnings quality.
What are SNDK's NAND cycle indicators?
NAND cycle indicators cover supply-side factors (capacity additions, node migration, utilization), demand-side factors (enterprise and client SSD shipments, channel inventory), and price-side factors (average NAND price, category ASPs). Always read price, volume, and inventory within the same framework—avoid judging cycles from price alone.
Can SNDK and WDC financials be directly compared?
No. Post-spinoff, WDC is HDD-centric while SNDK is NAND Flash– and SSD-centric, with different revenue structures, margin characteristics, and capex logic. Historical analysis must use each company's independent disclosures, not Western Digital's pre-spinoff combined data for SNDK evaluations.
Does a rising gross margin mean SNDK's cycle has improved?
Not necessarily. A rising margin may come from NAND price increases, a higher share of high-margin categories, or short-term supply cuts, and could coincide with falling shipments. Cross-validate with NAND price trends, SSD shipments, inventory levels, and management's outlook.
Why should you verify the stock ticker before researching SNDK?
SNDK and WDC trade separately on the Nasdaq as distinct companies with different business cycles. When reviewing trades or holdings, confirm the ticker is SNDK and the entity is SanDisk Corporation to avoid confusion with Western Digital or other storage stocks. Search for SNDK on Gate Stocks to verify the page information.
What does customer concentration mean for SNDK?
Changes in procurement pace by large cloud customers or OEMs can significantly impact single-quarter revenue and shipments. Higher concentration amplifies dependence on a few demand sources. When analyzing earnings, note the top five customer share and downstream industry distribution to better assess volatility sources.


