Clear trend confirmation through volatility-adjusted signals is one of SuperTrend's strengths, whereas EMA lends itself to analysing trend direction, momentum, and pullback opportunities. Choosing between them comes down to the balance a swing trader wants between objective signal changes and flexible price-action analysis.
TL;DR
-
SuperTrend produces clear bullish and bearish states by combining price with Average True Range-based volatility bands.
-
EMA follows the weighted average of recent prices and is more flexible for analysing trend slope, pullbacks, crossovers, and momentum.
-
SuperTrend generally provides simpler entry and exit confirmation, but its signals may arrive after a reversal has already started.
-
EMA usually reacts more smoothly to developing price structure, although repeated crossings can create false signals in sideways markets.
-
Neither indicator forms a complete swing-trading system without price structure, support and resistance, liquidity, and risk controls.
| Feature |
SuperTrend |
EMA |
| Main input |
Price and ATR-based volatility |
Weighted recent prices |
| Primary purpose |
Trend confirmation and directional state |
Trend direction and price smoothing |
| Signal format |
Line switches above or below price |
Slope, price position, pullbacks, or crossovers |
| Reaction to volatility |
Automatically adjusts through ATR |
Responds only through price changes |
| Typical swing use |
Confirming entries and managing exits |
Finding trends and pullback areas |
| Main weakness |
Can reverse after price has already moved |
Can produce repeated signals in ranges |
| Ease of interpretation |
Relatively direct |
More flexible but more subjective |
The central difference is that SuperTrend converts price and volatility into a directional signal, whereas EMA provides a continuously changing reference line. SuperTrend therefore offers a more structured verdict, while EMA leaves more room for interpreting market structure.
What Is the SuperTrend Indicator and How Does It Use Average True Range?
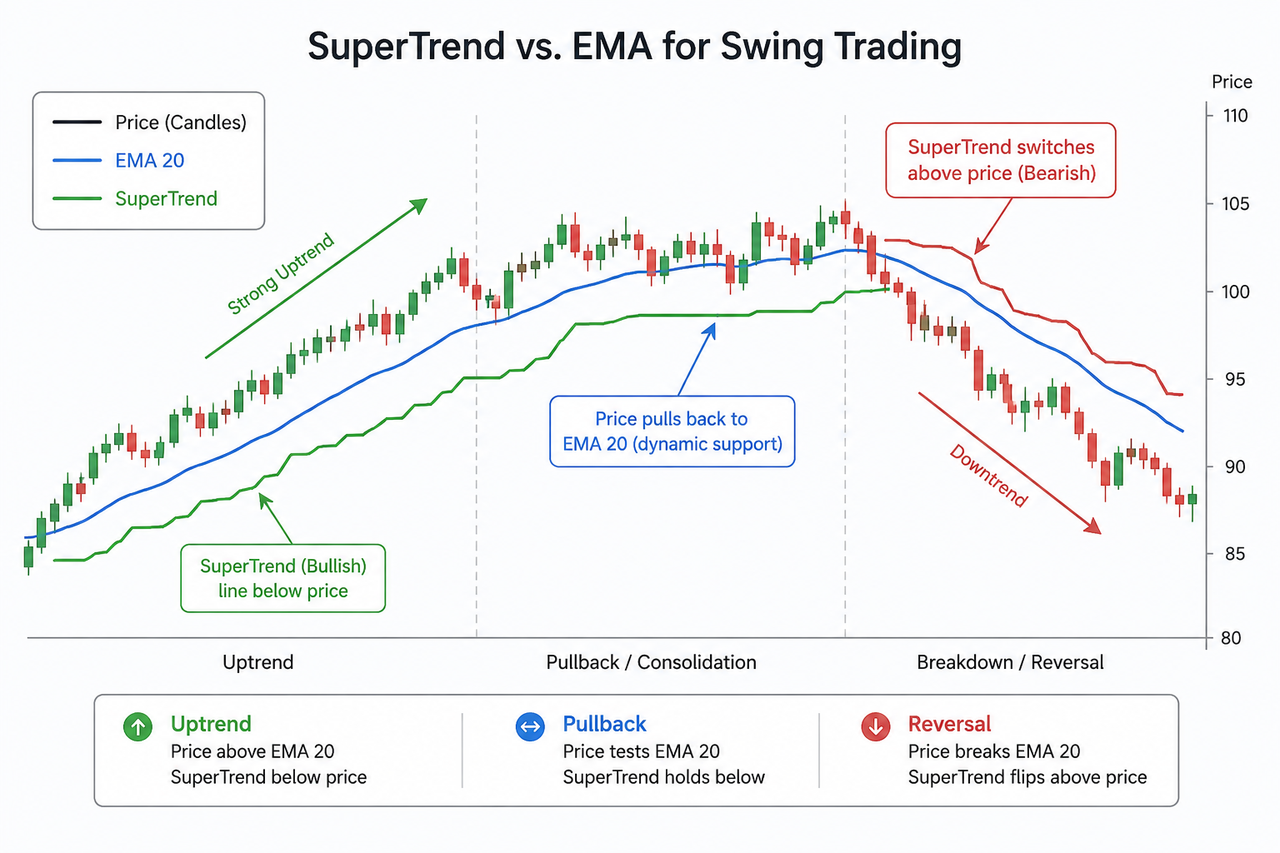
SuperTrend is a technical analysis tool and trend following tool that uses Average True Range to place a volatility-adjusted line above or below price for identifying market trends and reading market movements. A line below price commonly represents a bullish condition, while a line above price commonly represents a bearish condition.
The indicator was developed by Olivier Seban in 2009.
The indicator begins with a central price value, often calculated from the high and low of each candle. An ATR value, often set to a standard range of 10 to 14 periods and multiplied by a selected factor, is then added to and subtracted from that midpoint to create potential upper and lower bands. The active line changes sides when price satisfies the indicator’s reversal conditions.
This design makes the SuperTrend indicator visually direct. In uptrends, the line typically appears green below price, while in downtrends a red line usually sits above price. Those color shifts create binary color-coded buy and sell signals, giving traders clear buy or sell signals without needing to compare several moving averages before reading the current trend.
SuperTrend does not predict the exact beginning of a trend. Because its calculation depends on past price and volatility, confirmation normally occurs after price has already moved far enough to trigger a change, which shows how the supertrend indicator works by reacting to the asset's volatility rather than forecasting reversals in advance.
What Is the EMA Indicator?
The exponential moving average tracks an asset’s weighted average price over a selected number of periods, giving recent candles more influence than older candles. Its main purpose is to smooth price action while remaining responsive to new market information.
Swing traders may analyse an EMA through four related observations:
-
The direction of its slope
-
The position of price relative to the line
-
Price reactions near the EMA
-
Crossovers between faster and slower averages
A rising EMA 20 indicator can support a short-term bullish bias when price forms higher highs and higher lows above it. A falling EMA can support a bearish bias when price remains below the line and market structure continues forming lower highs.
The selected period changes how the indicator behaves. EMA 20 follows recent price action relatively closely, while EMA 50 provides a smoother view of the broader swing trend. The practical difference between these settings is outlined through the comparison of EMA 20 and EMA 50 for swing trading.
Unlike SuperTrend, an EMA does not automatically label the market bullish or bearish. Traders must interpret its slope, price position, separation, and surrounding structure.
SuperTrend vs. EMA: How Do Their Calculations Differ?
SuperTrend explicitly includes market volatility, while EMA derives its value entirely from a weighted series of prices. This calculation difference explains most of their contrasting behaviour.
The EMA formula applies a smoothing multiplier:
Multiplier = 2 ÷ (selected period + 1)
A 20-period EMA uses a multiplier of approximately 0.0952. The latest closing price receives that weighting, while the previous EMA carries most of the remaining influence. The resulting line changes gradually as new candles appear.
SuperTrend normally uses a process based on the average true range atr, which is typically set to 10 to 14 periods in standard configurations:
Basic upper band = Midpoint + ATR × multiplier
Basic lower band = Midpoint − ATR × multiplier
When ATR rises, it is used here to measure market volatility, so the bands move farther from price. When volatility contracts, the distance narrows. The indicator therefore changes its signal threshold as market conditions become more or less volatile.
This adjustment can help SuperTrend avoid reacting to every small movement during a volatile period. However, a wider band may also delay a reversal signal. EMA does not widen according to ATR, but sharp price changes still pull a short-period EMA more quickly than a long-period EMA.
Which Indicator Gives Better Swing-Trading Entries?
EMA generally provides earlier areas of interest, while SuperTrend provides clearer confirmation after price establishes directional movement. The better entry tool depends on whether the trader prefers responsiveness or confirmation.
During an established uptrend, price may retreat toward a rising EMA before continuing higher. This interaction can identify a potential pullback area without requiring the EMA itself to change direction. The trader can then evaluate candle behaviour, a previous swing level, volume, and the broader trend, and many traders also use support and resistance levels or fibonacci retracement levels to refine entry and exit points around pullbacks.
SuperTrend takes a more rule-based approach. A bullish switch places the active line below price, indicating that price has moved sufficiently relative to the ATR-adjusted bands. This may reduce subjective interpretation, but the entry can occur farther from the reversal point, and the signal is usually more useful in trending markets than in choppy transitions.
Consider a hypothetical bullish transition:
-
Price forms a higher low near a previous support zone.
-
EMA 20 begins turning upward as price recovers.
-
Price closes above the EMA before SuperTrend changes state.
-
Volatility expands and SuperTrend switches below price two candles later.
A supertrend strategy can use EMA for earlier context while SuperTrend handles confirmation.
The EMA provides the earlier observation, while SuperTrend supplies later confirmation. Neither signal proves that the advance will continue. The higher low and support reaction remain important because they establish where the bullish interpretation becomes invalid.
Which Indicator Is Better for Trend Confirmation?
SuperTrend is generally easier to use for direct trend confirmation because it maintains a defined bullish or bearish state. EMA offers more detailed information but requires interpretation of several factors.
A bullish SuperTrend reading remains active while the line stays below price. A bearish reading remains active while the line stays above price. This structure can help traders avoid reacting to minor countertrend candles that do not trigger a complete signal change.
EMA confirmation depends on context. Price above a rising EMA usually carries more bullish significance than price above a flat or falling EMA. Increasing separation between price and the average may indicate momentum, but excessive separation can also mean the move has become extended.
Longer-term confirmation may involve more than one average. EMA 20 above EMA 50, with both lines rising, reflects stronger bullish alignment than a single price crossover. However, closely related moving averages should not be mistaken for independent evidence because they are calculated from the same price series.
Experienced traders often combine SuperTrend with other indicators instead of relying on it alone, using a confirmation tool to seek more reliable signals. This is especially useful when adding other technical indicators in choppy conditions, where confirmation helps avoid false signals.
Traders primarily concerned with trend strength rather than direction may also examine the Average Directional Index. As a confirmation tool for trend strength, it can show whether directional movement is strengthening or weakening, while SuperTrend or EMA identifies how price is positioned within that movement. The relative strength index can also validate momentum when used with SuperTrend or EMA.
Which Indicator Provides Better Exit Signals and Fewer False Signals?
SuperTrend usually provides more explicit trailing exit signals, while EMA allows exits to be adapted to price structure and trading style. As a trailing stop reference, the SuperTrend line can assist traders who want to manage risk and define exit points. In that sense, it often makes buy and sell decisions clearer, while EMA exits usually require more interpretation.
In a bullish position, the SuperTrend line rises beneath price as the market advances. A bearish switch may signal that the earlier trend condition has ended, and many traders place stop-loss orders along or just beyond the line as it rises beneath price. The distance between price and the line changes with ATR, allowing the exit threshold to account for volatility.
EMA-based exits can use several rules, while SuperTrend tends to provide more explicit sell signals based on line reversals:
-
Price closes below a rising EMA.
-
The EMA changes from rising to flat or falling.
-
A short-period EMA crosses below a longer-period EMA.
-
Price breaks both the EMA and a confirmed swing low.
A single close below EMA 20 may be too sensitive for some swing trades, particularly when the broader trend remains intact. A break below EMA 50 may filter more noise but surrender a larger part of the move.
The Parabolic SAR indicator follows a related trailing stop approach, although its acceleration factor causes the plotted points to move progressively closer to price as a trend develops. SuperTrend instead adjusts its distance through ATR-based volatility, which can make sell signals more responsive in fast conditions.
EMA generally provides better information during orderly trends and pullbacks, while SuperTrend becomes most useful when price develops enough direction to maintain a stable signal; the supertrend indicator reliable mostly in trending markets and less dependable in sideways conditions. Both indicators struggle when the market lacks sustained movement.
| Market condition |
SuperTrend behaviour |
EMA behaviour |
| Strong directional trend |
Maintains a stable bullish or bearish state |
Shows a clear slope and sustained price separation |
| Controlled pullback |
May retain the existing signal |
Can identify a dynamic pullback area |
| Sideways consolidation |
May switch repeatedly as bands are crossed |
Often becomes flat with repeated price crossings |
| Sudden volatility expansion |
Bands widen through ATR |
Short EMA reacts quickly to price |
| Early reversal |
May confirm after the initial move |
Slope and price position may change earlier |
In a strong trend, either indicator can be useful. The main difference appears during transitions. EMA often begins changing before SuperTrend completes a reversal, but that sensitivity also creates more premature warnings. SuperTrend filters part of this noise at the cost of later confirmation, and trend traders often prefer less sensitive settings so the signal holds the current trend longer during sustained moves. That said, supertrend indicator's reliability varies by asset, timeframe, settings, and market conditions.
Should Swing Traders Use SuperTrend and EMA Together?
SuperTrend and EMA can be combined as technical analysis tools within a broader trading strategy when each indicator has a separate role rather than being counted as duplicate confirmation. EMA can define trend structure and pullback areas, while SuperTrend can confirm direction or support trailing exits.
A structured combination may use:
-
EMA 50 to identify the broader trend direction.
-
EMA 20 to monitor short-term pullbacks.
-
SuperTrend to confirm that the directional state still agrees with the setup.
-
Swing highs and lows to establish invalidation.
-
Position sizing to limit the effect of an incorrect signal.
SuperTrend can also be paired with RSI for trend validation during pullbacks or continuation setups.
For example, price above rising EMA 20 and EMA 50 may establish a bullish context. A pullback toward EMA 20 can create an area for closer observation. If SuperTrend remains bullish and price forms a higher low, the combined evidence is stronger than a SuperTrend switch or EMA touch viewed alone. Fibonacci retracement can add confluence around likely reaction zones, while nearby resistance levels can help frame where continuation may stall. A stochastic oscillator may help time entries, but it should not replace trend confirmation.
Adding more trend indicators does not automatically improve a setup. MACD, EMA, and moving-average ribbons all derive substantial information from historical prices. A MACD indicator may contribute momentum analysis, but it should not be treated as entirely independent from EMA-based evidence.
SuperTrend vs. EMA: Which Should Swing Traders Choose?
Choose SuperTrend when the strategy needs direct trend-state changes, volatility-adjusted signals, and a relatively simple trailing reference. Choose EMA when the strategy needs earlier trend observations, pullback analysis, adjustable time horizons, and closer integration with price structure.
Consider using both when:
-
EMA defines the broad directional bias.
-
Price pulls back within an established trend.
-
SuperTrend confirms that the directional state remains active.
-
A swing level supplies a logical invalidation point.
Consider neither as a standalone signal when price is moving sideways, liquidity is thin, volatility is event-driven, or the chart lacks clear swing structure.
The practical winner in SuperTrend vs. EMA is therefore determined by function rather than universal accuracy. SuperTrend offers clearer confirmation and exit logic. EMA offers greater flexibility for analysing how a trend develops. Swing traders still need independent risk controls because both indicators are lagging calculations based on historical market data.
Educational disclaimer: Technical indicators cannot guarantee trading outcomes. Digital assets are volatile, and indicator signals may fail during rapid price changes, low-liquidity conditions, or sideways markets. Traders should independently evaluate position size, leverage, execution risk, and invalidation levels.
Conclusion
SuperTrend and EMA approach swing trading from different perspectives rather than competing for the same role. SuperTrend offers straightforward, volatility-adjusted trend confirmation and trailing signals, while EMA provides a flexible view of trend direction, momentum, and pullbacks. The more effective choice depends on the trading strategy, market conditions, and level of confirmation required. Many swing traders combine both indicators with price action and sound risk management to make more informed trading decisions.
FAQs
Is SuperTrend better than EMA for swing trading?
SuperTrend is better for traders who prefer direct bullish and bearish signals, while EMA is better for analysing trend slope, pullbacks, and changing momentum. The stronger choice depends on the trader’s entry, confirmation, and exit rules.
Which EMA works best with SuperTrend?
EMA 20 can support shorter swing setups, while EMA 50 can provide a smoother broader-trend filter. No EMA period works best across every asset, timeframe, or volatility condition, because different settings balance noise filtering against more timely signals depending on timeframe and trading style.
Does SuperTrend react faster than EMA?
SuperTrend does not always react faster because it must satisfy ATR-based reversal conditions. A short-period EMA may begin changing direction before SuperTrend switches, although the earlier EMA response may also produce more false signals.
Can SuperTrend and EMA give conflicting signals?
SuperTrend and EMA can conflict during pullbacks and early reversals. Price may move below a short EMA while SuperTrend remains bullish, indicating that short-term momentum has weakened without confirming a full directional change.
Are SuperTrend and EMA leading indicators?
SuperTrend and EMA are lagging indicators because both use historical price data. They can organize current market information but cannot reliably predict future price direction.







