The core difference among VOOG, VOO, and VUG is the index each tracks: VOOG covers only the growth-style slice of the S&P 500, VOO covers the full S&P 500, and VUG offers broader U.S. large-cap growth exposure that is not a pure S&P 500 Growth slice. All three are Vanguard-issued U.S. equity ETF stocks with similar tickers, but their index universes and style boundaries are not the same.
Under the issuer–index–product framework mapped in Vanguard S&P 500 Growth ETF (VOOG), a side-by-side review should confirm each benchmark name first, then compare style exposure, holdings concentration, and expense-ratio disclosure. When the goal is completing a buy or sell flow with stablecoins on Gate Stocks, trade VOOG with USDT walks through funding preparation, ticker search, and order checks. The aim of comparison is a reusable classification boundary—not a judgment of which fund is better.
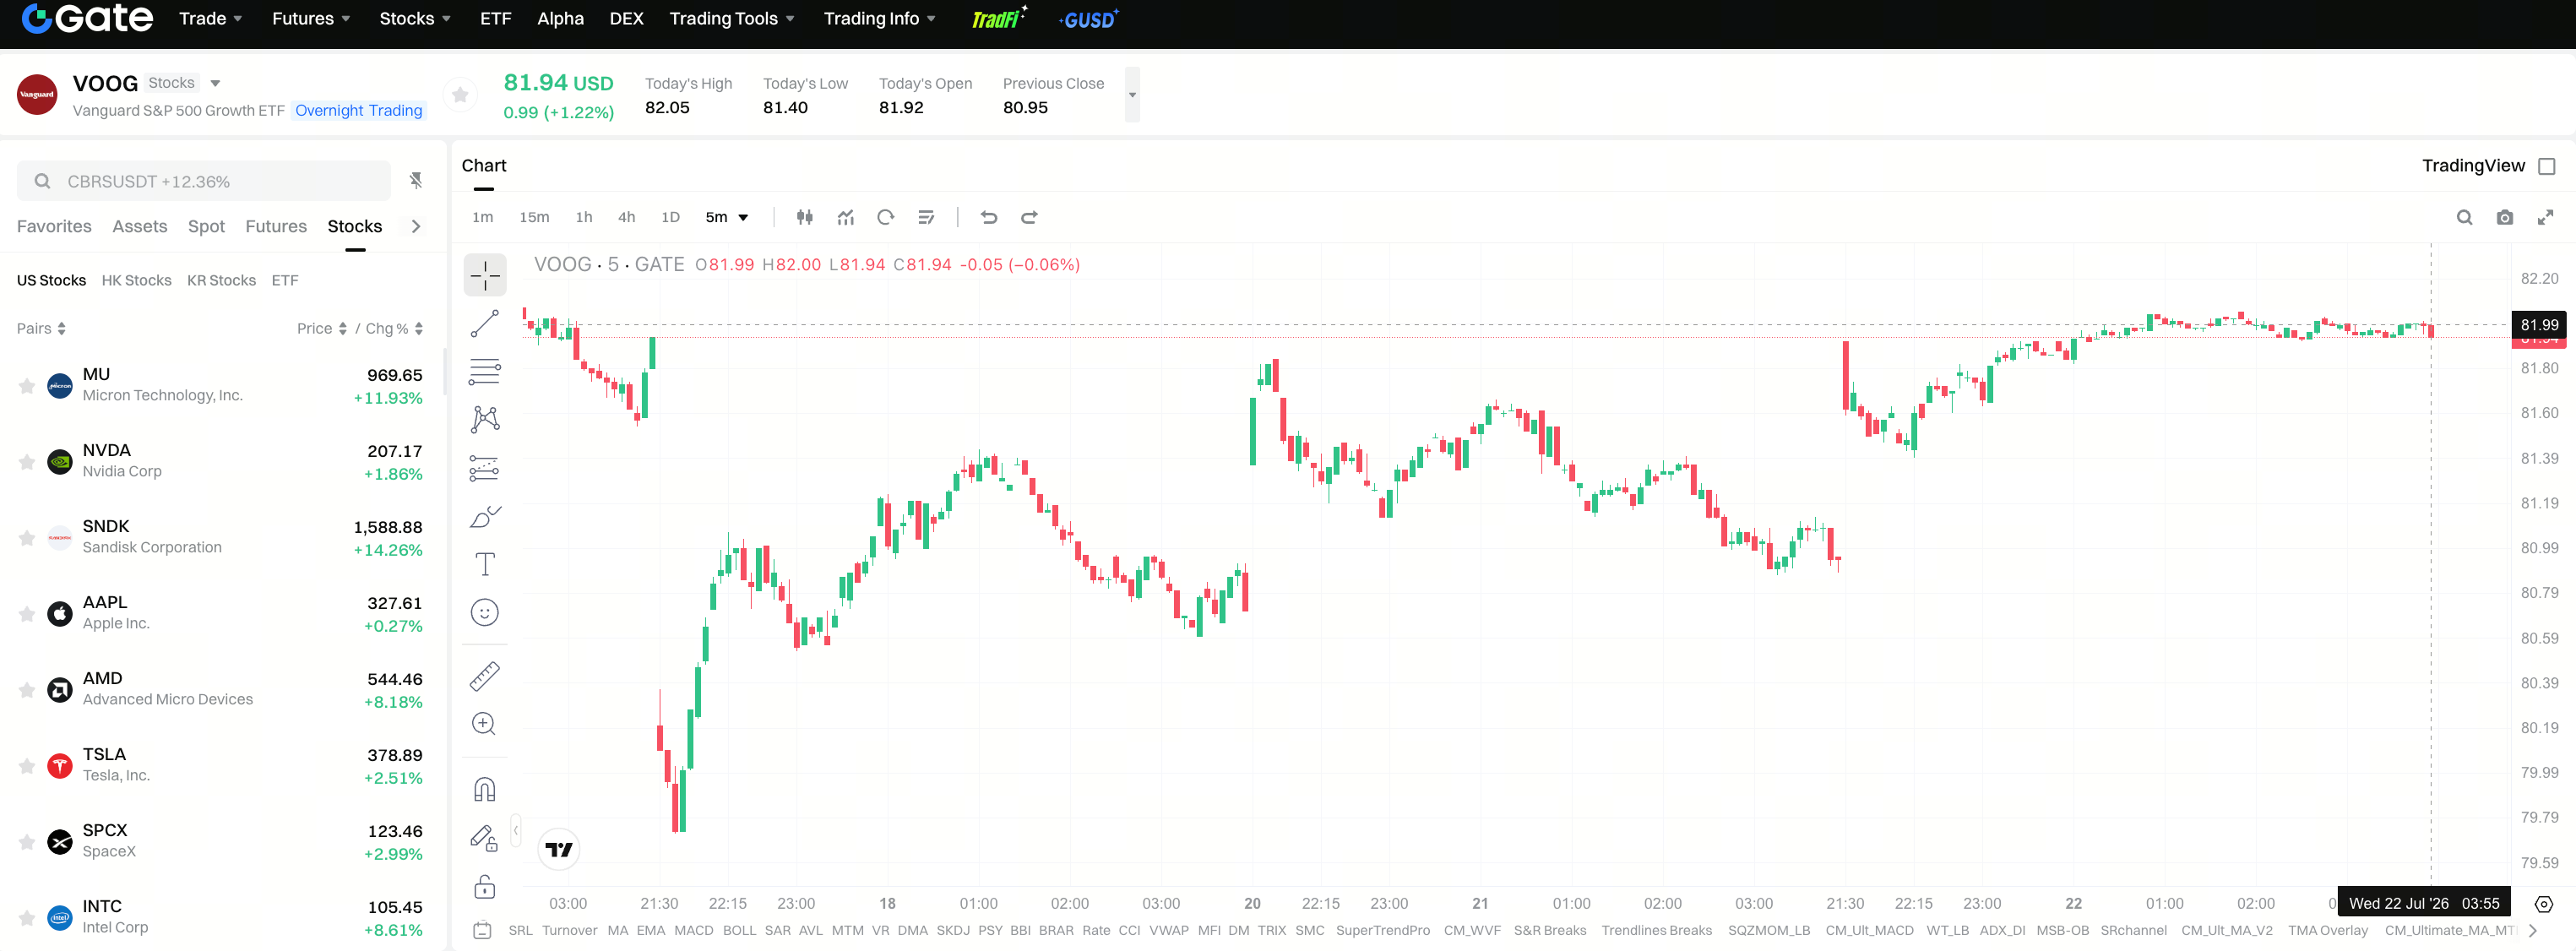
What Is VOOG?
VOOG is the Vanguard S&P 500 Growth ETF, ticker VOOG, issued by Vanguard and positioned to track the S&P 500 Growth Index as a U.S. equity ETF stock. Holding VOOG means holding the growth-style side of the S&P 500 represented by that ETF's shares—not a single company's equity and not a crypto token.
The S&P 500 Growth Index starts from S&P 500 large-cap constituents and assigns growth versus value characteristics using style factors such as sales growth, earnings change, and valuation, then includes the growth side in the index. VOOG uses a full-replication strategy and seeks to hold constituent securities in index weights. Per Vanguard product-page disclosure, VOOG's expense ratio is about 0.07%. Expense ratio is a fund-level management and related cost figure; it is not a return promise and does not replace bid–ask spreads or platform trading fees.
When searching Gate Stocks or similar venues, verify that the page ticker is VOOG and that the issuer name matches Vanguard S&P 500 Growth ETF, so VOOG is not confused with nearby codes such as VOO or VUG. Gate Stocks · VOOG can be used to confirm the full name and ticker display fields.
What Is VOO?
VOO is the Vanguard S&P 500 ETF, ticker VOO, issued by Vanguard and positioned to track the full S&P 500 Index as a U.S. equity ETF stock. VOO includes growth, value, and other style constituents within the large-cap universe and is closer to "U.S. large-cap overall" exposure than to growth alone.
Per Vanguard product-page materials, VOO holds index constituents with a full-replication approach and seeks market-cap-weighted alignment with the S&P 500. The expense ratio disclosed on the product page is about 0.03%. Relative to VOOG, both products sit in the U.S. large-cap equity universe and are passive index ETFs, but their index boundaries differ: VOO does not exclude value-style constituents, while VOOG tracks only the growth-style slice.
When studying VOO, keep "large-cap overall" separate from "large-cap growth slice." Describing VOO as "growth-tilted like VOOG" conflates style-split logic. Ticker verification matters equally: VOO and VOOG differ by a single letter, so the full product name and benchmark must match before any order is submitted.
What Is VUG?
VUG is the Vanguard Growth ETF, ticker VUG, issued by Vanguard and positioned to track the CRSP US Large Cap Growth Index as a U.S. growth equity ETF stock. VUG provides broader U.S. large-cap growth exposure and is not equivalent to a "pure S&P 500 Growth slice."
Per Vanguard product-page materials, VUG seeks to replicate holdings weights according to the target index composition; the expense ratio disclosed on the product page is about 0.03%. VUG's benchmark is compiled by CRSP; constituent screening and methodology are typically wider than a growth index cut only from the S&P 500. Writing VUG as "tracking the same index as VOOG" is therefore incorrect.
When comparing VOOG and VUG, both carry a "growth" label, but the index provider, constituent universe, and split rules differ. Aligning "which growth index is tracked" before comparing sector tilts or top weights prevents treating different growth universes as the same exposure.
How Do VOOG, VOO, and VUG Differ at a Glance?
The table below summarizes product positioning, tracking index, exposure boundary, style reading, and expense-ratio disclosure across the three funds. The purpose is structural comparison—not a ranking of which is better.
| Dimension |
VOOG |
VOO |
VUG |
| Full name |
Vanguard S&P 500 Growth ETF |
Vanguard S&P 500 ETF |
Vanguard Growth ETF |
| Tracking index |
S&P 500 Growth Index |
S&P 500 Index |
CRSP US Large Cap Growth Index |
| Exposure boundary |
S&P 500 growth-style slice |
Full S&P 500 large-cap universe |
Broader U.S. large-cap growth; not a pure S&P 500 Growth slice |
| Style reading |
Large-cap growth (after style split) |
Large-cap blend (growth + value) |
Large-cap growth (wider universe) |
| Replication (public description) |
Full replication |
Full replication |
Seeks to replicate index weights |
| Expense ratio (approx., product-page disclosure) |
0.07% |
0.03% |
0.03% |
The table shows that "all Vanguard U.S. equity ETFs" only signals a similar issuer and product form; the tracking index determines exposure differences. VOOG and VOO share the S&P 500 universe but split it differently; VOOG and VUG share a growth label but use different benchmark systems. Expense-ratio differences are cost-parameter comparisons and do not imply return advantages or which fund is "more economical."
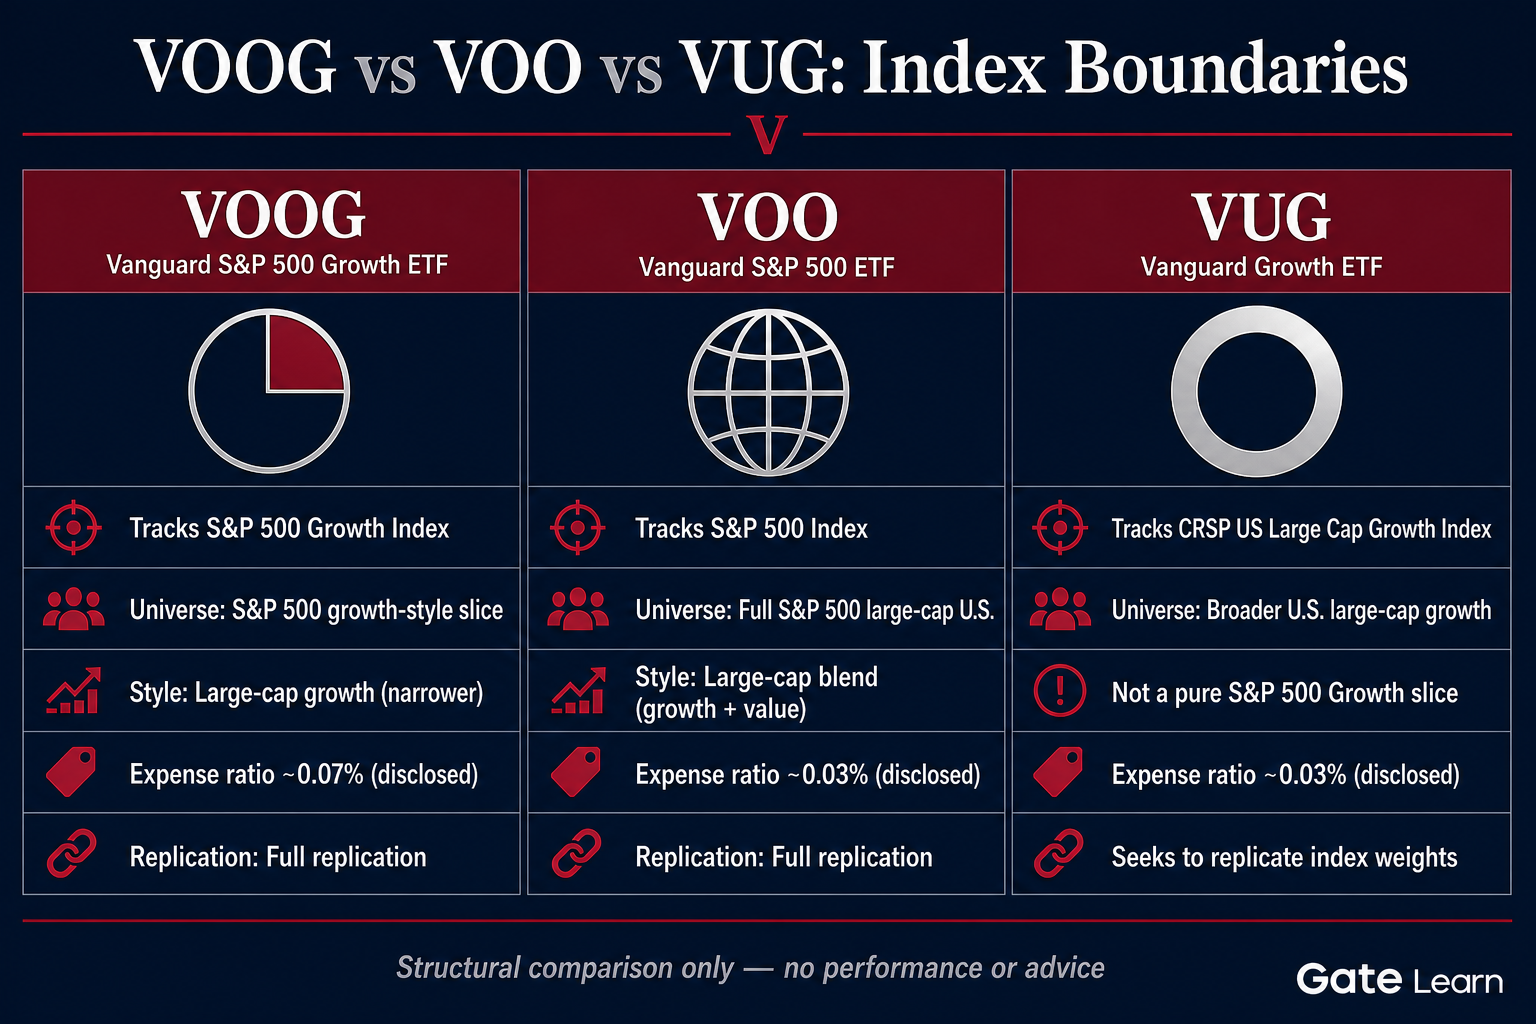 Figure 1. Index-boundary comparison for VOOG, VOO, and VUG: the S&P 500 Growth slice, the full S&P 500, and the broader CRSP U.S. large-cap growth universe.
Which Dimensions Should Be Compared? (Index Boundary, Style, Concentration, Expense, and More)
A horizontal review works best when five fixed dimensions are used, so conclusions are not drawn from "growth" or "large-cap" labels alone.
Index boundary
Write each benchmark's full name first: VOOG → S&P 500 Growth Index; VOO → S&P 500 Index; VUG → CRSP US Large Cap Growth Index. Index boundary sets the maximum eligible universe for constituents and is the premise for every later comparison.
Style exposure
VOO includes growth, value, and other styles; VOOG keeps only the growth side within the S&P 500; VUG exposes growth factors inside a wider large-cap growth universe. Even under a shared "growth" label, distinguish "S&P 500 internal split" from "CRSP large-cap growth" as two different paths.
Concentration and sector tilt
Growth-style indexes often tilt more toward information technology and other heavy growth sectors and toward a smaller set of large growth stocks; a broad S&P 500 is relatively more diversified across styles. Concentration changes with periodic index rebalances; fund holdings disclosures and index methodology are the source of truth—not a single-date top-holdings list treated as permanent structure.
Expense ratio
Expense ratio describes the publicly disclosed fund-level management and related cost figure. VOOG is about 0.07%; VOO and VUG are about 0.03% each (all per Vanguard product-page disclosure). Expense ratio is not return, and it does not replace platform trading fees, bid–ask spreads, or tax effects.
Ticker and trading-entry verification
On Gate Stocks or brokerage pages, verify the subject full name separately with VOOG, VOO, and VUG. Near-identical tickers are the most common execution-layer mix-up; index research conclusions do not replace order-field checks.
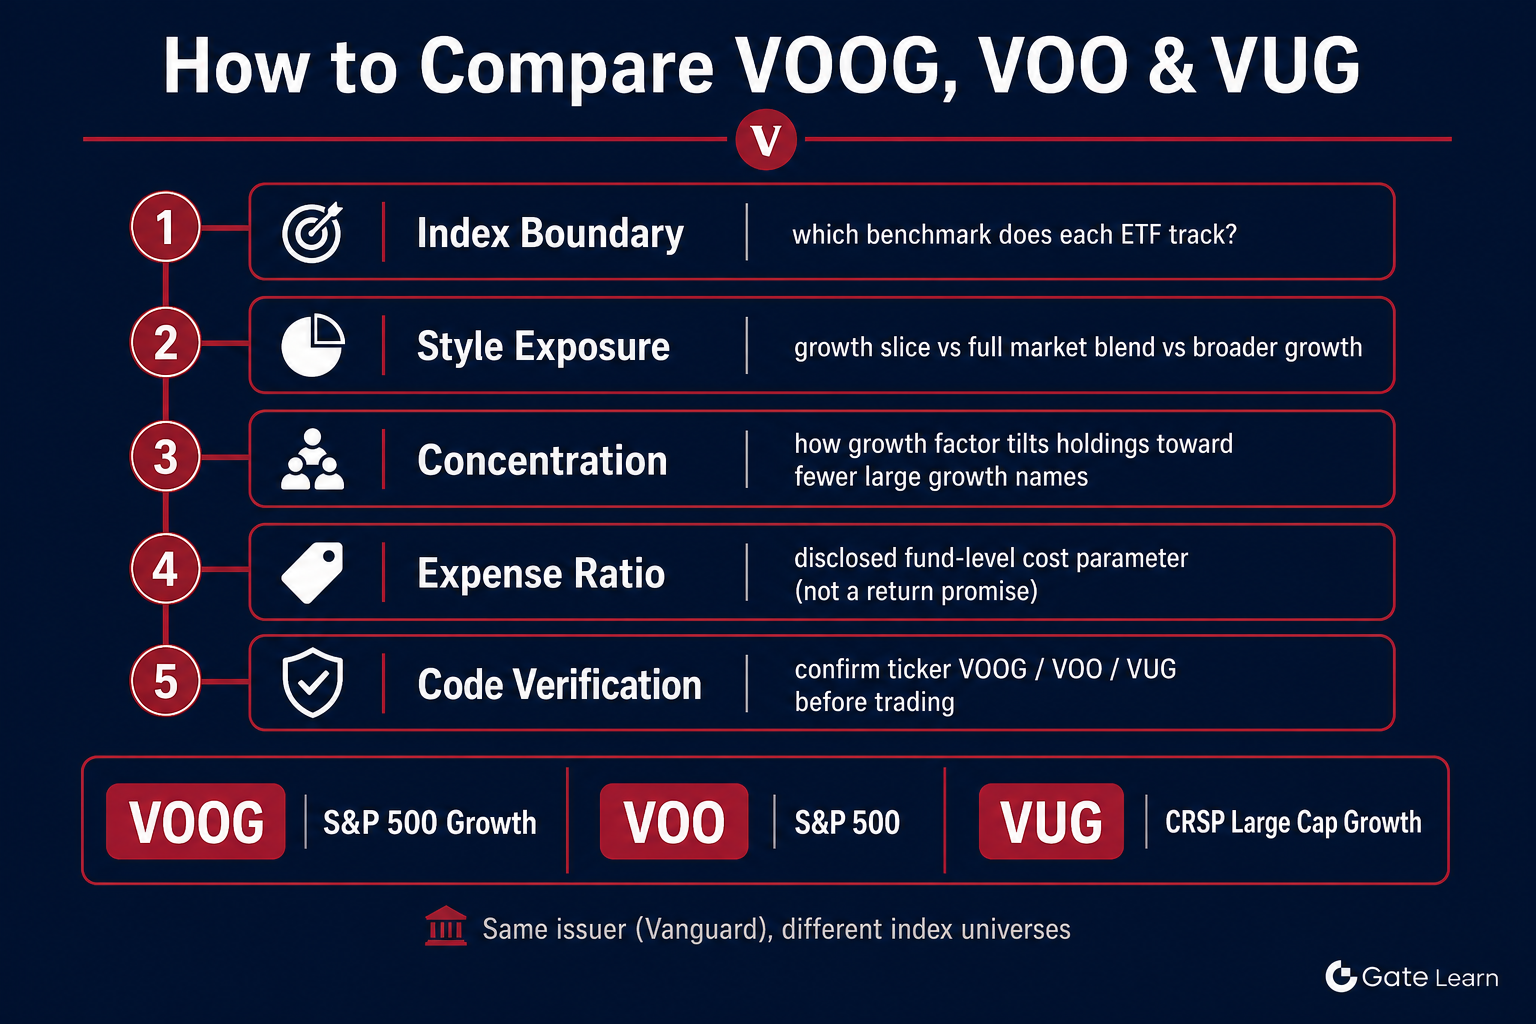 Figure 2. Five comparison dimensions for VOOG, VOO, and VUG: index boundary, style exposure, concentration, expense ratio, and ticker verification.
What Are the Limitations of This Comparison?
Structural comparison aids classification, but horizontal reviews still carry clear limits that must be read alongside any conclusion.
Index methodologies are not directly convertible
S&P style splits and CRSP growth classification rules differ. VOOG holdings cannot be "scaled" into VUG, and VUG cannot be simply trimmed into an "S&P 500 Growth subset." Factor definitions, rebalance cadence, and constituent eligibility do not transfer across index providers.
Point-in-time holdings are not permanent structure
Top weights and sector shares change with index adjustments and company market-cap moves. Inferring long-term style from one disclosure day's top-ten list overstates static concentration.
Expense ratios cannot be extrapolated into net-return gaps
Expense ratio only describes a fund cost parameter; realized outcomes also depend on tracking difference, dividend reinvestment, trading spreads, and platform fees. Writing an expense-ratio gap as a "long-term return gap" misuses the metric.
Trading execution and index research sit on different layers
Gate Stocks and traditional brokerages may differ in account funding conventions, session rules, and fee display. After index boundaries are understood, ticker, order type, and available funds still need separate verification on the trading page so structural comparison is not mistaken for an operating playbook.
No better-or-worse ranking
The three products map to different exposure goals: large-cap overall aligns with VOO's index boundary; an S&P 500-internal growth slice aligns with VOOG; broader U.S. large-cap growth requires understanding VUG's CRSP benchmark. The comparison framework answers "how they differ," not "which one to choose."
Summary
VOOG, VOO, and VUG are all Vanguard U.S. equity ETF stocks; the core difference is the tracking index. VOOG anchors to the S&P 500 Growth Index with full replication, and its expense ratio is about 0.07% per disclosure; VOO anchors to the full S&P 500, with an expense ratio of about 0.03%; VUG anchors to the CRSP US Large Cap Growth Index, offering broader growth exposure that is not a pure S&P 500 Growth slice, with an expense ratio of about 0.03%. Comparison should align index boundaries first, then verify concentration, expense ratios, and trading tickers, while keeping comparison limits separate from execution checks.
FAQ
What is the difference between VOOG and VOO?
VOO is the Vanguard S&P 500 ETF and tracks the full S&P 500; VOOG is the Vanguard S&P 500 Growth ETF and tracks only the growth-style slice (S&P 500 Growth Index). Both sit in the U.S. large-cap equity universe, but their index boundaries differ: VOO covers growth, value, and other styles, while VOOG concentrates on the growth side.
What is the difference between VOOG and VUG?
VUG is the Vanguard Growth ETF and tracks the CRSP US Large Cap Growth Index, offering broader U.S. large-cap growth exposure that is not equivalent to a pure S&P 500 Growth slice. VOOG explicitly anchors to the S&P 500 Growth Index; comparison should confirm each benchmark and constituent universe first, then compare style exposure and cost parameters.
What index does VOOG track?
VOOG tracks the S&P 500 Growth Index. That index screens and weights S&P 500 large-cap constituents by growth-style factors; constituents and weights adjust periodically under index rules. VOOG uses full replication to align holdings with index composition as closely as practicable.
What is VOOG's expense ratio?
Per Vanguard product-page disclosure, VOOG's expense ratio is about 0.07%. That figure is a fund expense-ratio disclosure used to describe management and related fee levels; it is not a return promise and does not replace bid–ask spreads or platform trading fees. VOO and VUG expense ratios are about 0.03% each per their respective product-page disclosures.
What risks apply when trading VOOG?
Main risks include growth-style and market volatility, style tilt from concentrated index weights, ETF tracking difference versus the index, and execution issues such as selecting the wrong ticker (for example, VOO or VUG by mistake), order rules, and fee conventions. Structural comparison can reduce the cognitive risk of mixing up index boundaries, but it does not remove market price volatility; risk discussion identifies variables and is not a buy or sell recommendation.







