For anyone following the energy market, understanding the differences between XLE and XOP is useful not only for understanding how energy ETFs are constructed, but also for seeing the market characteristics of different types of companies within the U.S. energy value chain.
Positioning of XLE and XOP
Although XLE and XOP are both U.S. energy ETFs, they do not focus on the same layer of the market.
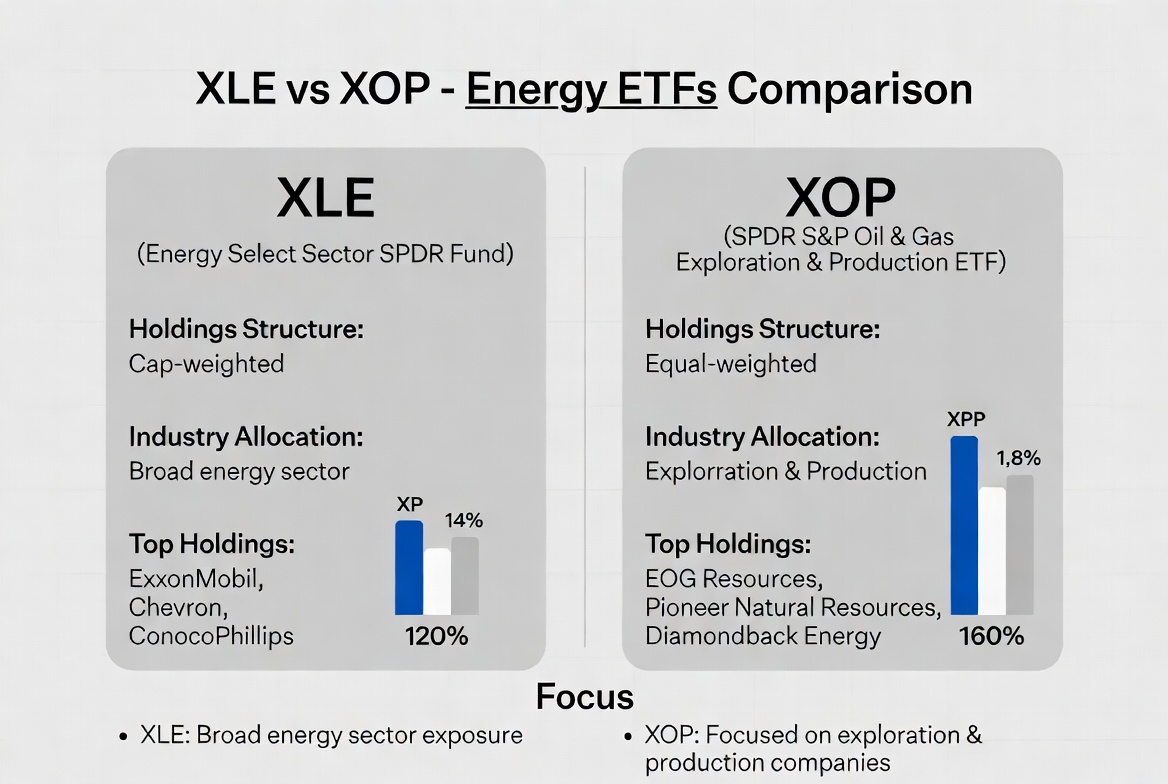
XLE places more emphasis on the overall performance of the U.S. energy industry. Its holdings usually span multiple areas, including oil production, natural gas operations, refining and processing, and integrated energy groups, allowing it to reflect the overall operating condition of large U.S. energy companies. For many market participants, XLE serves as an important window into the traditional U.S. energy sector.
By comparison, XOP has a more focused scope. XOP mainly covers oil and gas exploration and production companies, with an emphasis on the market performance of upstream resource companies in the energy value chain. Because these companies’ revenue is more closely tied to crude oil and natural gas prices, XOP often reflects the impact of energy commodity price cycles more directly.
From a market positioning perspective, XLE is closer to a “U.S. energy industry ETF,” while XOP is closer to a “U.S. oil and gas exploration and production ETF.”
This distinction means that although both ETFs belong to the energy sector, they actually reflect different layers of energy industry logic. XLE focuses more on the integrated operating capabilities of large energy companies, while XOP focuses more on how changes in oil and gas resource prices affect the profitability of upstream companies.
Differences in Portfolio Structure Between XLE and XOP
The biggest difference between XLE and XOP comes from their weighting structure. XLE follows a model led by industry leaders, with large integrated energy companies usually holding relatively high weights. As a result, a small number of major companies can have a significant impact on the ETF’s performance.
XOP, on the other hand, is closer to an equal weighted allocation approach. The ETF spreads its weight across a larger number of oil and gas exploration and production companies, reducing the influence of any single company on overall performance. The structural differences between the two are as follows:
| Comparison Factor |
XLE |
XOP |
| Core Companies |
Integrated energy giants |
Oil and gas exploration companies |
| Weighting Structure |
Concentrated in leaders |
Relatively balanced |
| Industry Coverage |
Full energy value chain |
Upstream oil and gas production |
| Company Size |
Mainly large companies |
Mix of mid sized and large companies |
| Volatility Level |
Relatively lower |
Relatively higher |
This difference means that even though the two ETFs both belong to the energy sector, they may perform differently during the same period.
Differences in Sector Allocation Between XLE and XOP
XLE places greater emphasis on the overall energy industry ecosystem. In addition to oil production, companies held by XLE usually also engage in natural gas production, refining, transportation, sales, and international energy trading. This allows XLE to reflect operating conditions across multiple parts of the energy value chain.
By contrast, XOP has a more concentrated industry focus. Its main holdings usually come from oil and gas exploration and production companies, so its sector allocation leans more toward the upstream part of the energy value chain. Changes in oil and gas resource prices often have a more direct impact on the profitability of these companies.
From the perspective of the value chain, XLE is closer to an “energy industry ETF,” while XOP is closer to an “oil and gas production ETF.”
Differences in Risk and Return Characteristics Between XLE and XOP
Risk and return characteristics are among the clearest differences between the two. Because XLE holds many large energy companies, and these companies usually have stable balance sheets, mature business systems, and strong cash flow capabilities, its overall volatility is relatively lower.
The oil and gas production companies held by XOP depend more heavily on changes in energy commodity prices. When oil prices rise, their profitability may improve quickly. When oil prices fall, their profitability may also come under pressure just as quickly.
For this reason, XOP often shows higher volatility and stronger cyclical sensitivity.
Looking at historical energy cycles, XOP’s upside potential and drawdowns have typically both been greater than those of XLE.
Differences in Energy Cycle Sensitivity Between XLE and XOP
The energy cycle is an important factor affecting the performance of both ETFs. When international crude oil prices enter an upward cycle, upstream oil and gas companies are often among the first to benefit. Since XOP mainly allocates to these companies, it is usually more sensitive to oil price movements.
XLE can also benefit from rising energy prices, but large integrated energy companies have more diversified sources of revenue, so the impact of higher oil prices is usually more moderate.
During a strong energy market, XOP may often rise more than XLE.
During a downturn in the energy market, XLE can usually show better stability thanks to the stronger risk resilience of large companies.
In effect, the two ETFs offer different ways to participate in the energy cycle.
Use Cases for XLE and XOP in Different Market Environments
XLE and XOP play different roles under different market conditions. When the market is focused on the long term allocation value of the energy industry, XLE usually receives more attention. Large energy companies have more mature business structures and global market footprints, making XLE a useful indicator for observing the U.S. energy sector.
When the market is focused on rising oil prices, energy shortages, or resource cycles, attention to XOP usually increases. Because its holdings are more sensitive to oil and gas prices, XOP can more easily reflect the market impact of changes in the energy cycle.
In recent years, as global energy security issues have gained attention and energy market volatility has increased, some TradFi CFD products have also begun covering energy ETFs. In addition to participating through traditional brokerage accounts, some users also follow market changes in XLE or XOP through CFD products that support price tracking for energy assets.
Conclusion
XLE and XOP are both U.S. energy sector ETFs, but they represent different energy investment logic. XLE focuses on large integrated energy companies, emphasizing industry representation and stability. XOP focuses on oil and gas exploration and production companies, placing more emphasis on resource cycles and energy price sensitivity.
At their core, XLE represents the ecosystem of major U.S. energy companies, while XOP more directly represents the U.S. oil and gas production industry itself. Understanding the differences between the two helps build a fuller picture of the energy market’s industry structure and cyclical characteristics.
FAQs
What Is the Biggest Difference Between XLE and XOP?
XLE mainly holds large integrated energy companies, while XOP mainly holds oil and gas exploration and production companies. As a result, their industry coverage and risk profiles differ significantly.
Why Is XOP Usually More Volatile Than XLE?
The revenue of companies held by XOP depends more heavily on crude oil and natural gas prices, making it more sensitive to changes in the energy cycle and usually more volatile in the market.
Does XLE Invest Only in Oil Companies?
No. XLE covers oil, natural gas, refining, energy transportation, and integrated energy companies, reflecting important parts of the overall energy value chain.
Usually, yes. Because XOP focuses on oil and gas exploration and production companies, oil price movements often have a more direct effect on company profitability.
Which Better Represents the U.S. Energy Industry, XLE or XOP?
XLE usually provides a better reflection of the overall U.S. energy industry because it has broader coverage and includes large integrated energy companies.
How Can XLE and XOP Be Traded?
XLE and XOP can be traded through brokerage accounts that support the U.S. stock market. Some platforms also offer energy ETF related TradFi CFD products for tracking price movements in the energy sector.