Date: Sun, Dec 21 2025 | 10:26 AM GMT
The broader cryptocurrency market has continued to struggle with uneven and choppy price action over the past several weeks, a phase that began after the sharp sell-off on October 10. That correction pushed Ethereum (ETH) lower by nearly 26% over the last 60 days, keeping sustained pressure across the altcoin market. **Stellar (XLM) **has been no exception, remaining under selling pressure as risk appetite across the sector stays muted.
**XLM **is down more than 29% over the past two months, but beneath the surface, the weekly chart is starting to reveal a technical structure that could lay the groundwork for a potential rebound if key levels continue to hold.
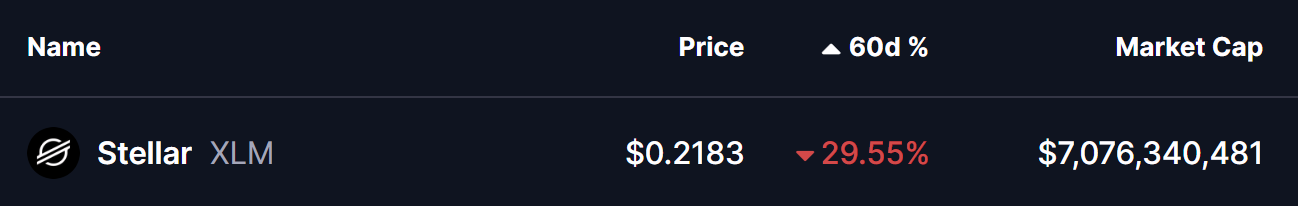
Source: Coinmarketcap
Descending Triangle Structure Comes Into Focus
On the weekly timeframe, XLM has been trading within a large descending triangle formation. This pattern is defined by a series of lower highs pressing against a relatively flat support base, reflecting consistent selling pressure from the top while buyers defend the same demand zone below. While descending triangles are often viewed as bearish continuation structures, repeated defenses of the base can also precede sharp upside reactions, particularly when broader market sentiment is already pessimistic.
The chart shows XLM once again pulling back into the critical $0.20–$0.22 support region. This zone has acted as a reliable demand area throughout the year, with each visit producing long lower wicks and swift reactions from buyers. These candle structures suggest that accumulation is taking place, even as price continues to respect the descending trendline from above. Despite months of pressure, sellers have so far been unable to force a decisive breakdown below this floor.
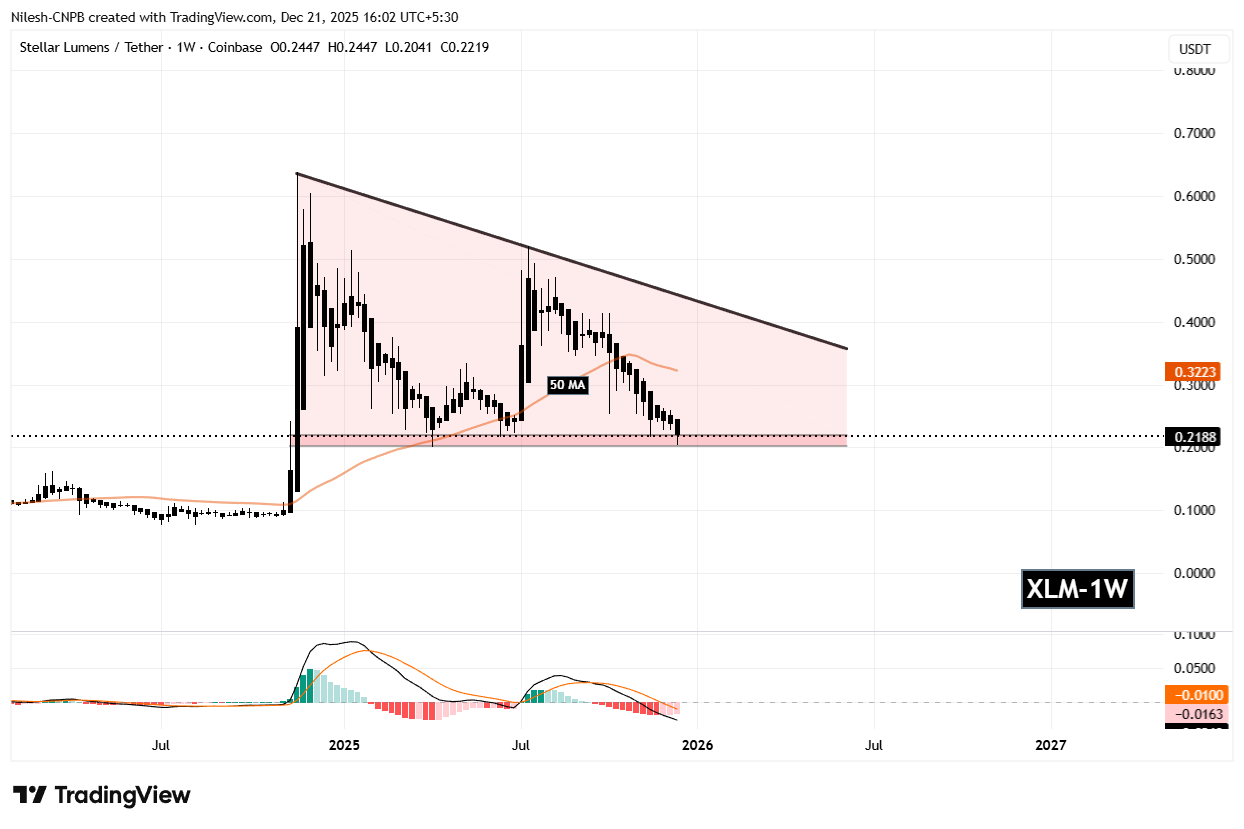
Stellar (XLM) Daily Chart/Coinsprobe (Source: Tradingview)
At the same time, XLM is trading below its 50-week moving average, currently near the $0.32 region. This moving average has historically marked important shifts in trend direction, and price behavior around it often determines whether rallies can gain traction or fade quickly.
What’s Next for XLM?
As long as the $0.20–$0.22 support zone remains intact, the probability of a rebound stays firmly on the table. A sustained defense of this level could allow XLM to stabilize and attempt a move back toward the descending trendline resistance near $0.32. This area aligns closely with the 50-week moving average, making it a key zone that bulls would need to reclaim to signal improving market structure.
A decisive weekly close above the descending trendline would be a notable technical development. Such a move would invalidate the bearish bias of the triangle and could open the door for a broader trend reversal, especially if accompanied by rising volume and improving momentum across the wider crypto market.
That said, the downside risk remains clearly defined. A weekly close below the $0.20 support would confirm a breakdown from the triangle and could expose XLM to deeper declines, with the next major support area sitting closer to the $0.13 region.
For now, Stellar sits at a pivotal inflection point. With price pressing against long-term support and sellers struggling to force a breakdown, the coming weeks are likely to be decisive in determining whether XLM can stage a meaningful rebound or extend its broader corrective trend.
Disclaimer: The views and analysis presented in this article are for informational purposes only and reflect the author’s perspective, not financial advice. Technical patterns and indicators discussed are subject to market volatility and may or may not yield the anticipated results. Investors are advised to exercise caution, conduct independent research, and make decisions aligned with their individual risk tolerance.
Disclaimer: The information on this page may come from third parties and does not represent the views or opinions of Gate. The content displayed on this page is for reference only and does not constitute any financial, investment, or legal advice. Gate does not guarantee the accuracy or completeness of the information and shall not be liable for any losses arising from the use of this information. Virtual asset investments carry high risks and are subject to significant price volatility. You may lose all of your invested principal. Please fully understand the relevant risks and make prudent decisions based on your own financial situation and risk tolerance. For details, please refer to
Disclaimer.
Related Articles
Analysis: BTC has not yet rapidly surged to $80,000, and after gold's rally slows down, funds may flow back into the crypto market.
Bitcoin fluctuates above $72,000, while Ethereum rises slightly. The market experiences consolidation; despite Bitcoin successfully breaking through the $70,000 mark, it has not quickly surged toward $80,000. In the context of easing tensions in the Middle East, risk assets are boosted. Derivatives data shows bullish sentiment remains strong, but gold-linked token futures contracts decline, indicating capital flowing into cryptocurrencies. In the options market, demand for high-strike call options increases, and overall volatility remains stable.
GateNews11m ago
Assess whether DOGE holds above $0.088 as whale selling pressure increases
Dogecoin (DOGE) is facing strong selling pressure since breaking below $0.1. During this prolonged downtrend, DOGE has broken the support level of $0.09 and touched a low of $0.088 before a slight rebound.
At the time of writing, DOGE is trading at $0.092, up 2.56% in the past 24 hours, reflecting increased volatility.
TapChiBitcoin24m ago
Hyperliquid Just Did $2.9T - The CEX Era Officially Ended
Bitcoin experienced an 8.12% increase in March 2026 after two months of losses. Historical data indicates March is typically strong for Bitcoin, with hopes for continued gains amidst market volatility and cautious sentiments among traders.
Coinfomania31m ago
After -25% Bloodbath… Bitcoin Is +8% – Too Late to Buy?!
Bitcoin experienced an 8.12% increase in March 2026, turning around losses from the previous months. Historically, March has been strong for Bitcoin, showing average gains and a potential for renewed market confidence, even as traders remain cautious about future trends.
Coinfomania46m ago
Dogecoin Price Pressures Mount as $0.08 Support Nears Break
Key Insights:
Dogecoin maintains a firm bearish structure as consecutive lower highs and lower lows reinforce sustained downside pressure across higher timeframes.
The $0.08 level aligns with value area low and historical demand, making it a decisive zone for near-term market
CryptoFrontNews1h ago
Pi Network Explodes 50% – The Rebound Everyone Missed!
Pi Network has experienced a price rebound, rising from $0.128 to approximately $0.1819, approaching a key resistance at $0.20. Traders are optimistic, but liquidity remains low, leading to potential volatility in the market.
Coinfomania1h ago

