𝙉𝙑𝘿𝘼 𝙖𝙣𝙙 𝘼𝙄 𝙎𝙚𝙘𝙩𝙤𝙧 𝙊𝙪𝙩𝙡𝙤𝙤𝙠 𝟮𝟬𝟮𝟲 — 𝙈𝙖𝙧𝙠𝙚𝙩 𝙎𝙩𝙧𝙪𝙘𝙩𝙪𝙧𝙚, 𝙑𝙖𝙡𝙪𝙖𝙩𝙞𝙤𝙣 & 𝙏𝙧𝙖𝙙𝙞𝙣𝙜 𝙎𝙩𝙧𝙖𝙩𝙚𝙜𝙮
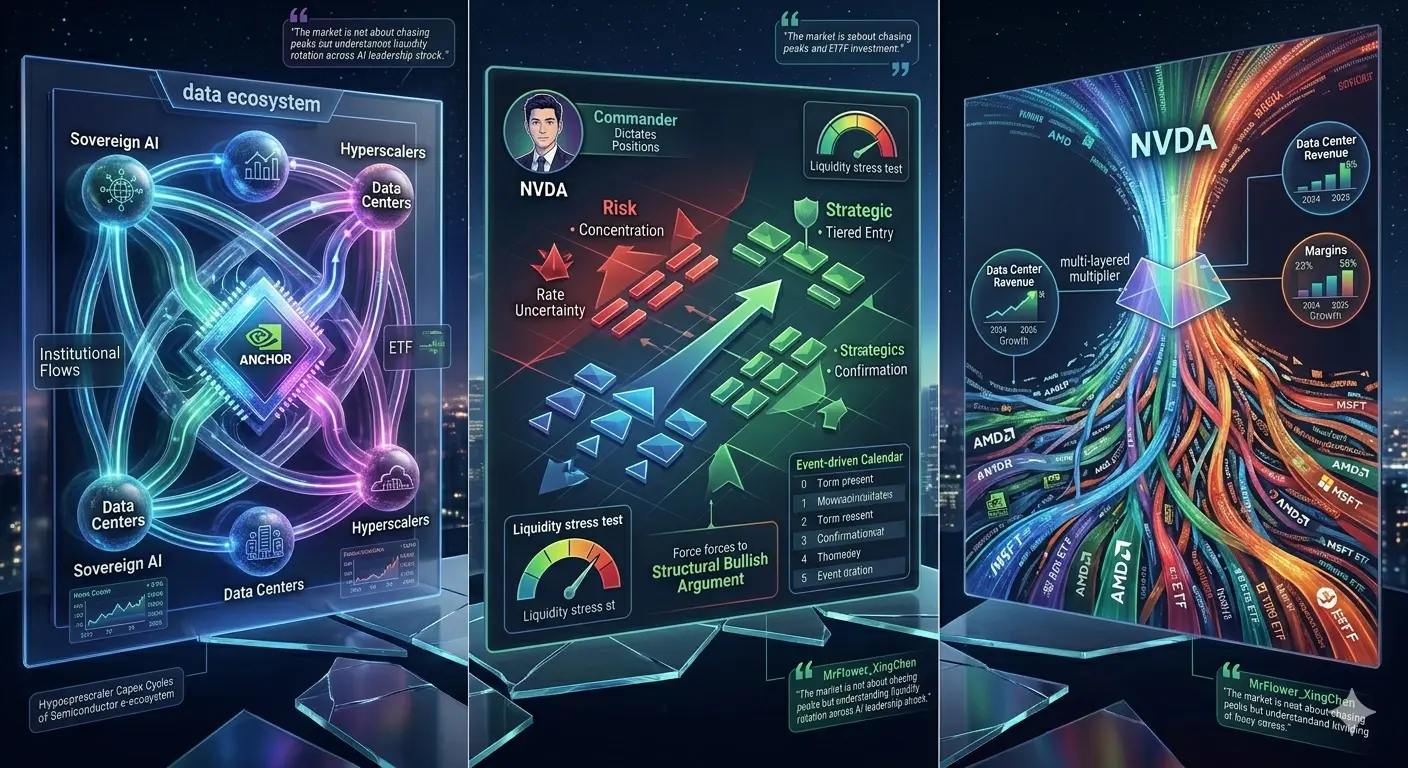
The current U.S. equity landscape is still heavily dominated by the AI-driven capital cycle, and within this cycle, NVIDIA Corporation remains the central liquidity magnet of the entire semiconductor ecosystem. The key thesis in 2026 is not just about earnings growth, but about whether the market can continue to justify compressed or expanded valuation multiples under shifting macro conditions such as interest rate expectations, ETF flows, and institutional rebalancing. From my observation, NVDA is no longer simply a “growth stock” narrative; it has transformed into a systemic infrastructure asset tied to global data center expansion, sovereign AI investments, and hyperscaler capex cycles. At the same time, volatility is increasing because positioning is crowded, meaning every earnings cycle becomes a liquidity stress test rather than just a fundamentals update.
From a sector perspective, the Semiconductor & AI ecosystem is now a multi-layered structure rather than a single trade. Companies like Advanced Micro Devices and Microsoft Corporation are indirectly shaping AI demand through cloud infrastructure and alternative compute strategies, while AI infrastructure demand continues to spill into leveraged instruments such as ETFs like SOXL. The key risk factor here is valuation compression under macro tightening, where even strong revenue growth may not prevent short-term downside if liquidity conditions weaken. However, the bullish structural argument still stands: AI compute demand is outpacing supply, and chipmakers are effectively selling into a long-duration infrastructure supercycle. This creates a scenario where dips are often driven by sentiment rather than fundamental breakdown, which is critical for positioning strategy.
Technically and strategically, NVDA behaves like a momentum-anchor asset for the entire AI trade. When NVDA trends upward, beta exposure across semiconductors expands aggressively, and when it corrects, leveraged products experience amplified drawdowns. In this environment, my trading approach is focused on tiered entry zones, risk-managed accumulation, and event-driven volatility tracking rather than blind directional bets. Key signals to monitor include data center revenue acceleration, gross margin stability, and forward guidance revisions, which often matter more than headline EPS beats. Risk-wise, the biggest threats remain interest rate uncertainty, AI capex slowdown risk, and overconcentration of institutional holdings, which could trigger rapid unwinds. Still, the broader 2026 outlook remains structurally bullish as long as AI infrastructure investment continues at scale.
From the viewpoint of MrFlower_XingChen, this market is not about chasing peaks but about understanding liquidity rotation across AI leadership stocks, where NVDA acts as the primary signal generator for the entire sector trend. Strategic positioning in this environment requires patience, confirmation-based entries, and awareness that volatility is not noise—it is the price of participation in a high-growth technological supercycle.
#分享美股交易赢英伟达股票
#TradeCFDWinGold #StockTradingChallengeUpTo17000U #DailyPolymarketHotspot @Gate_Square @GateSquare
#ShareYourUSStocksWinNvidia