Scient
用戶暫無簡介

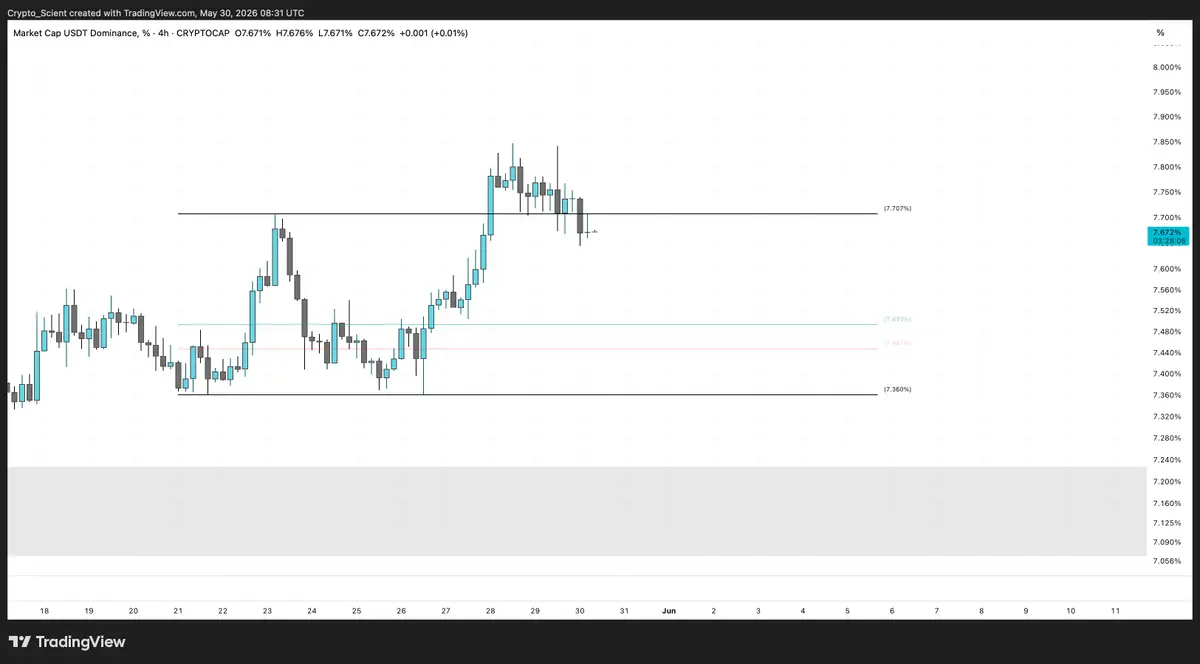
$USDT.D 看起來像是在4小時圖上的一次失敗突破嘗試。
價格回到區間內並在較低時間框架上被拒絕。
應該會是一個有趣的週末。
查看原文價格回到區間內並在較低時間框架上被拒絕。
應該會是一個有趣的週末。
- 打賞
- 按讚
- 回覆
- 轉發
- 分享
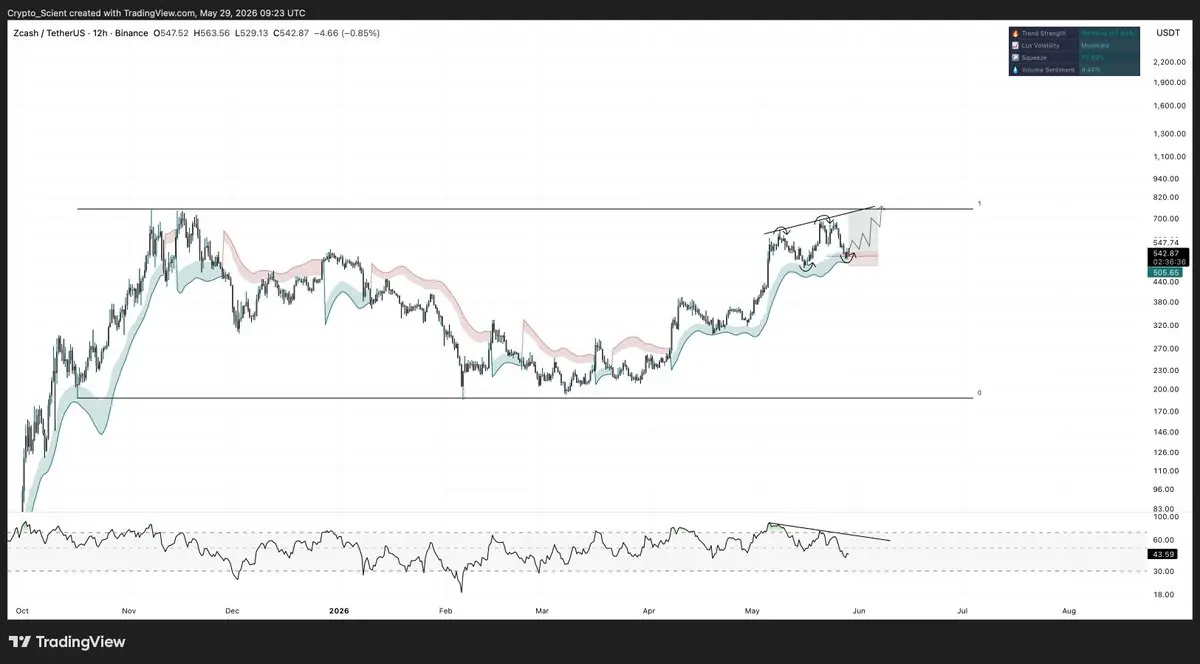
$ZEC,預計將從這裡推升至歷史新高。
日線技術分析顯示在區間高點附近有分配跡象,伴隨三次推動並在RSI上出現看跌背離。這是一個明確的頂部信號——但目前,這只是等我們觸及高點後的擔憂,而非之前。
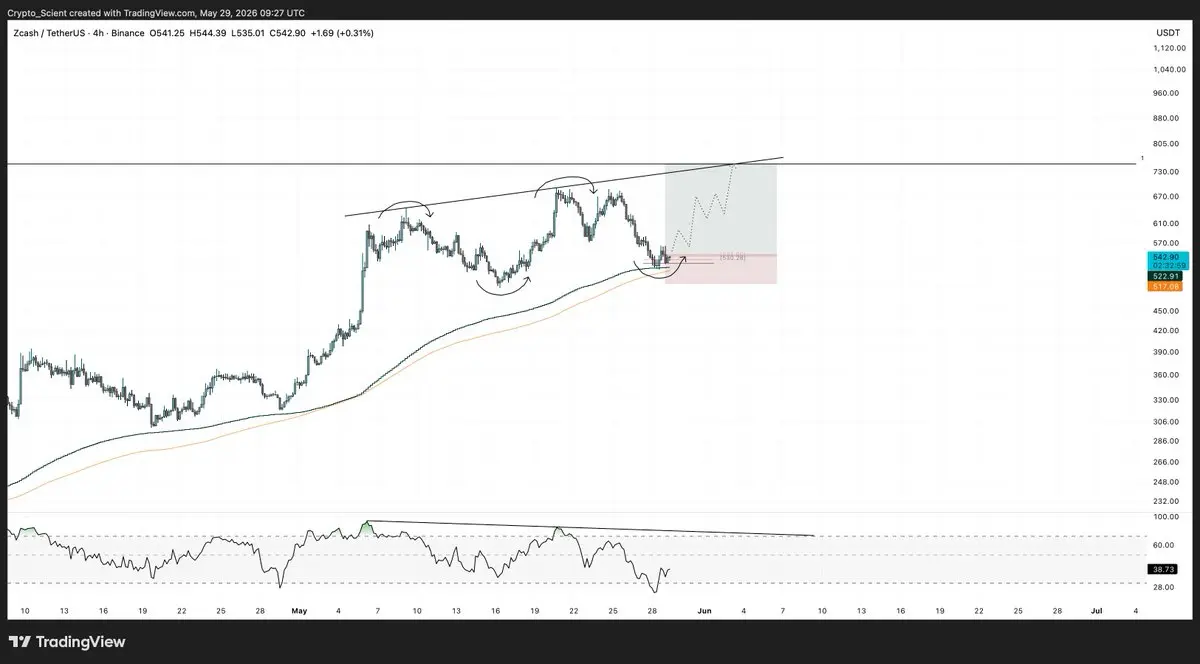
放大到較短時間框架,我認為我們已經觸底並在0.75斐波那契區域印出較高的低點。從這裡開始,策略是第三次推動進入宏觀區間高點,觸及歷史新高。
一旦到達那裡,留意分配信號的展開。但在那之前,還有一次上漲的機會。
所以我持多頭。
#ZEC #ZECUSDT
日線技術分析顯示在區間高點附近有分配跡象,伴隨三次推動並在RSI上出現看跌背離。這是一個明確的頂部信號——但目前,這只是等我們觸及高點後的擔憂,而非之前。
放大到較短時間框架,我認為我們已經觸底並在0.75斐波那契區域印出較高的低點。從這裡開始,策略是第三次推動進入宏觀區間高點,觸及歷史新高。
一旦到達那裡,留意分配信號的展開。但在那之前,還有一次上漲的機會。
所以我持多頭。
#ZEC #ZECUSDT
ZEC12.34%
- 打賞
- 3
- 1
- 轉發
- 分享
GateUser-edafb776:
$BAT #BAT 開始從三角形的堅實突破上升。
再次測試呈現正面,可能在接下來的幾天引發大幅看漲行情 ✍️
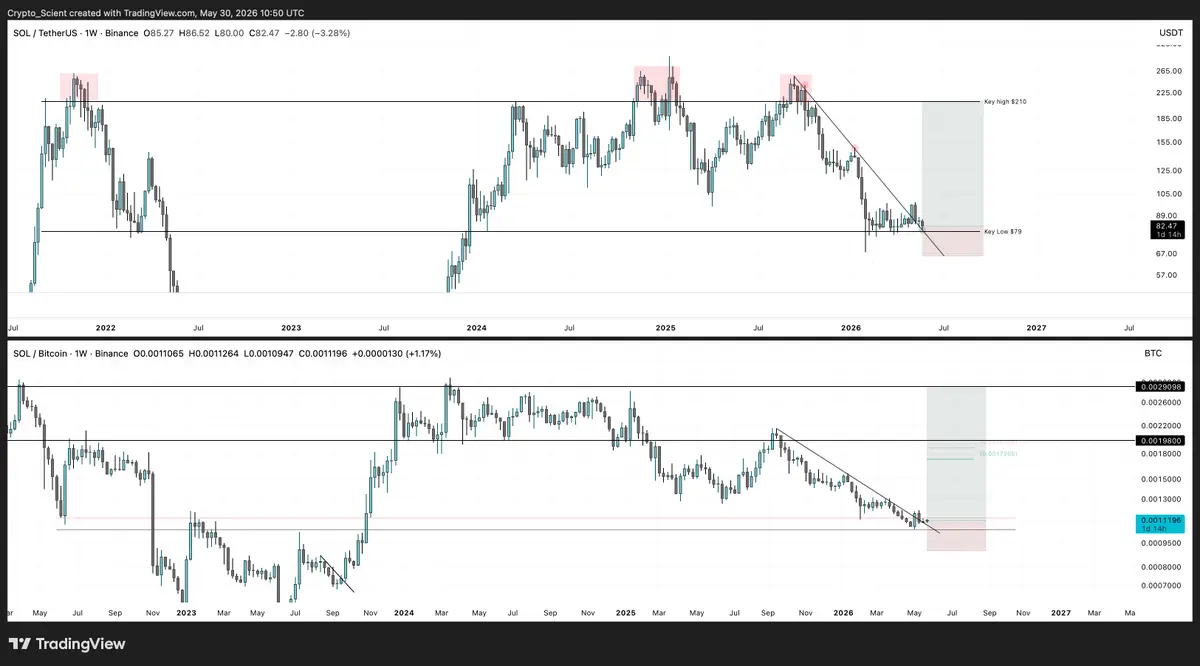
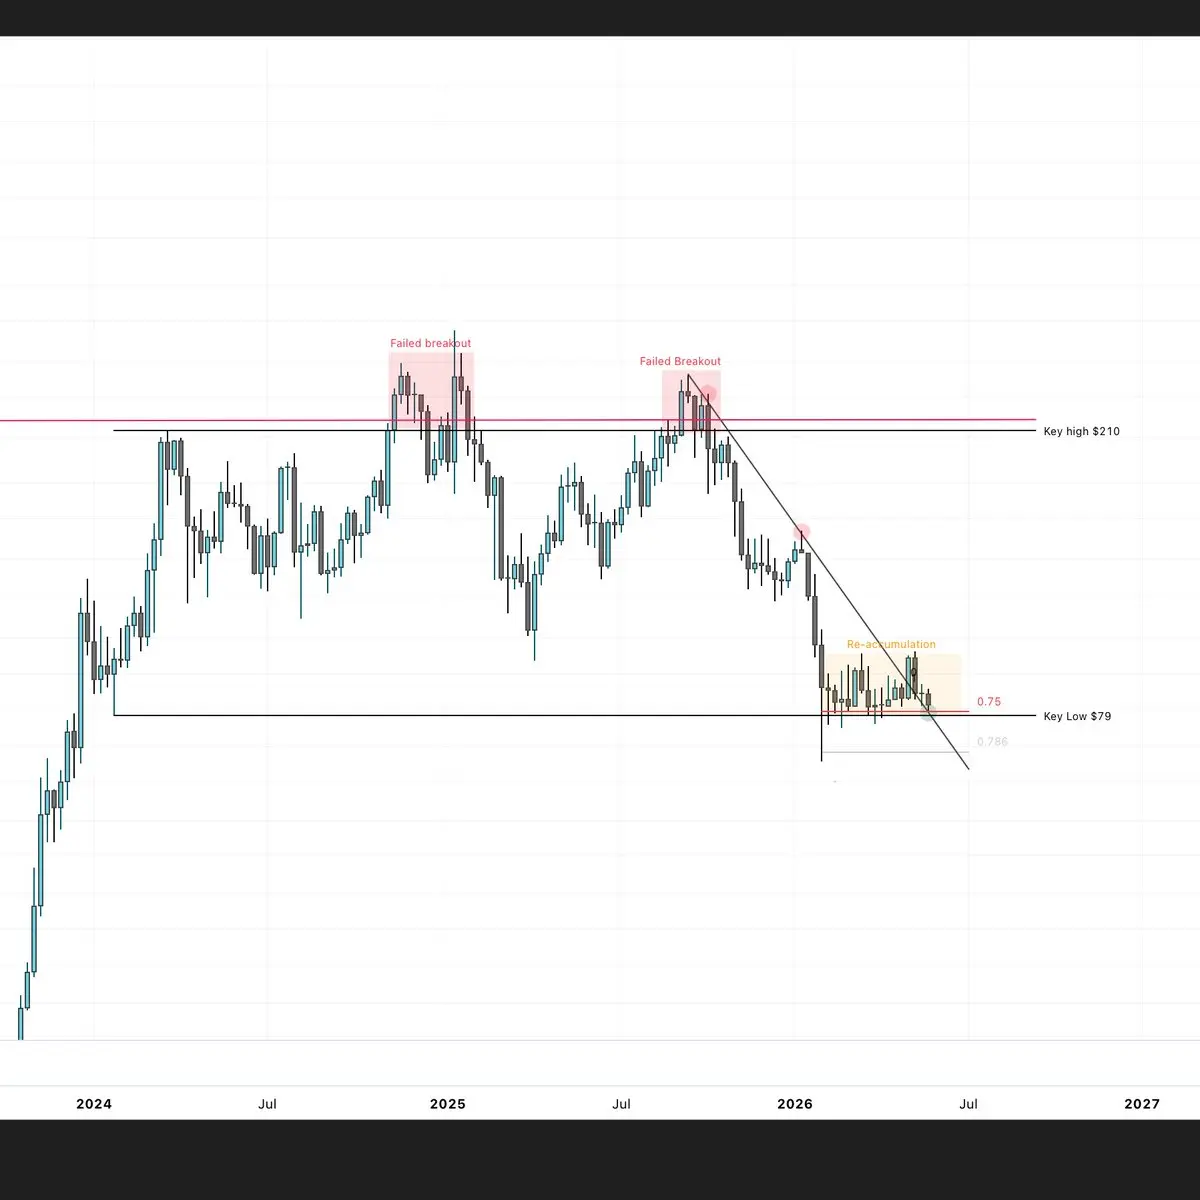
$SOL 1W(第一張圖)— 這是一張重要的圖表,你的閱讀方式取決於你的觀點以及你對它的理性程度。
這張圖上最重要的水平是2024年的低點79美元和該波動的衝動高點210美元。那個210美元恰好也是2021年備選季的衝動高點——意味著自2021年以來,價格已經試圖突破該水平三次,但每次都失敗了。
第二次失敗的嘗試來自2024年的低點,觸發了一年的盤整,並導致2025年9月的第三次失敗突破。之後,買家放棄了,價格迅速回撤到2024年的低點,我們一直在該區間重新積累。
*這是一個巨大的多年結構。價格現在坐落在其低點,並展現出積累行為——可能正準備迎來下一次真正的突破嘗試。要是SOL在80美元底部,與ETH在上一個熊市底部的價格相同,那會多麼具有諷刺意味?
79–80美元是SOL的關鍵水平。持住它,設定仍然有效。失守,價格可能會回到20多美元的中段。
目前價格在支撐之上,這是你根據情況下注的地方。
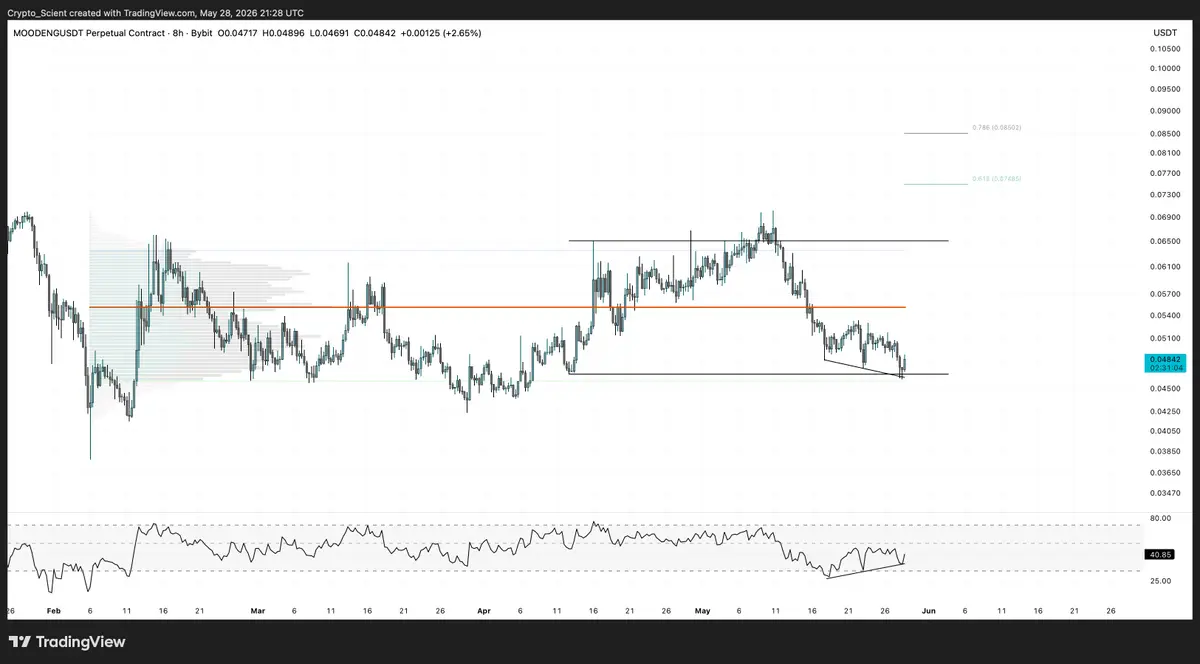
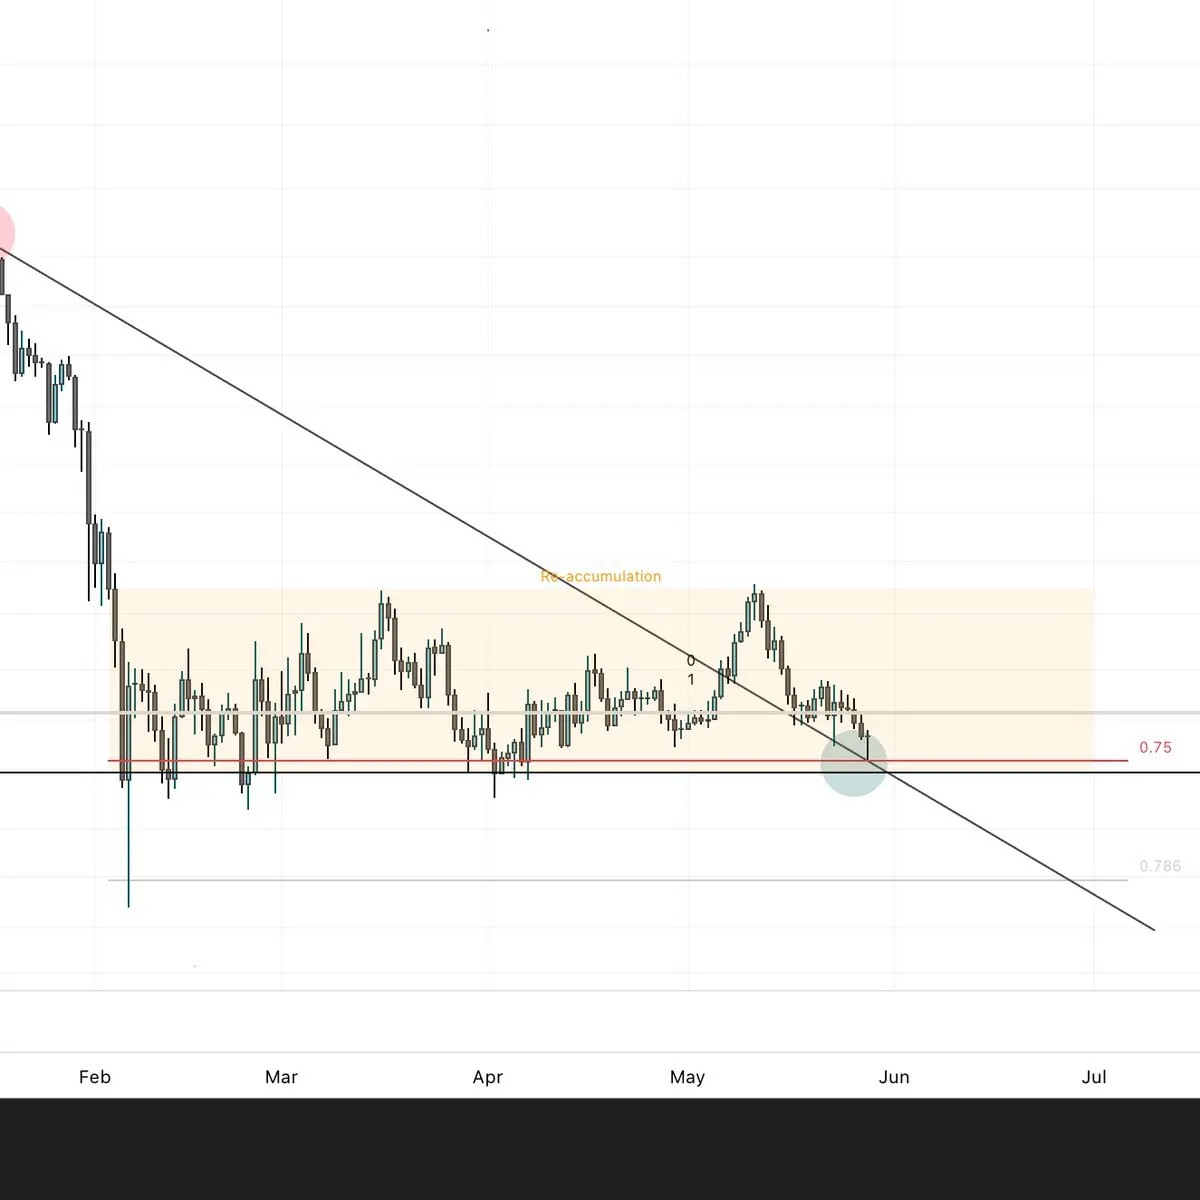
補充SOL的觀點(第二張圖)——在日線圖上,宏觀下行趨勢是這裡的關鍵。
價格已經突破並在我看來,轉向上行。今天是該趨勢的第二次看漲回測,我們又獲得了一次乾淨的反彈——這正是你想看到的確認信號。
成交量輪廓也在傳達同樣的故事。大部分成交量集中在目前的價格附近,且價格保持在關鍵支撐之上。經典的積累行為。
有趣的是,從目前的水平到120美元,成交量輪廓幾乎沒有阻力。如果買家決定推動,幾乎是一條暢通無
查看原文這張圖上最重要的水平是2024年的低點79美元和該波動的衝動高點210美元。那個210美元恰好也是2021年備選季的衝動高點——意味著自2021年以來,價格已經試圖突破該水平三次,但每次都失敗了。
第二次失敗的嘗試來自2024年的低點,觸發了一年的盤整,並導致2025年9月的第三次失敗突破。之後,買家放棄了,價格迅速回撤到2024年的低點,我們一直在該區間重新積累。
*這是一個巨大的多年結構。價格現在坐落在其低點,並展現出積累行為——可能正準備迎來下一次真正的突破嘗試。要是SOL在80美元底部,與ETH在上一個熊市底部的價格相同,那會多麼具有諷刺意味?
79–80美元是SOL的關鍵水平。持住它,設定仍然有效。失守,價格可能會回到20多美元的中段。
目前價格在支撐之上,這是你根據情況下注的地方。
補充SOL的觀點(第二張圖)——在日線圖上,宏觀下行趨勢是這裡的關鍵。
價格已經突破並在我看來,轉向上行。今天是該趨勢的第二次看漲回測,我們又獲得了一次乾淨的反彈——這正是你想看到的確認信號。
成交量輪廓也在傳達同樣的故事。大部分成交量集中在目前的價格附近,且價格保持在關鍵支撐之上。經典的積累行為。
有趣的是,從目前的水平到120美元,成交量輪廓幾乎沒有阻力。如果買家決定推動,幾乎是一條暢通無
- 打賞
- 按讚
- 回覆
- 轉發
- 分享
$SOL 1W(第一張圖)— 這是一張重要的圖表,你的閱讀方式取決於你的觀點以及你對它的理性程度。
這張圖上最重要的水平是2024年的低點79美元和該波動的衝動高點210美元。那個210美元恰好也是2021年備選季的衝動高點——意味著自2021年以來,價格已經三次試圖突破該水平,但每次都失敗了。
第二次失敗的嘗試來自2024年的低點,觸發了一年的盤整,並導致2025年9月的第三次失敗突破。之後,買家放棄了,價格迅速回撤到2024年的低點,我們從那時起一直在該區間重新積累。
*這是一個巨大的多年結構。價格現在坐落在其低點,並展現出積累行為——可能正準備迎來下一次真正的突破嘗試。要是SOL在80美元的底部與ETH在上一個熊市的底部相同,這會多麼具有諷刺意味?
79–80美元是SOL的關鍵水平。持住它,設定仍然有效。失守,價格可能會回到20多美元的中段。
目前價格在支撐之上,這是你根據情況下注的地方。
補充SOL的觀點(第二張圖)——在日線圖上,宏觀下行趨勢是這裡的關鍵。
價格已經突破並在我看來,轉向上行。今天是該趨勢的第二次看漲回測,我們又獲得了一次乾淨的反彈——這正是你想看到的確認信號。
成交量輪廓也在傳達同樣的故事。大部分成交量集中在目前的價格附近,且價格保持在關鍵支撐之上。經典的積累行為。
有趣的是,從目前的水平到120美元之間,成交量輪廓幾乎沒有阻力。如果買家決定推動,幾乎是一
查看原文這張圖上最重要的水平是2024年的低點79美元和該波動的衝動高點210美元。那個210美元恰好也是2021年備選季的衝動高點——意味著自2021年以來,價格已經三次試圖突破該水平,但每次都失敗了。
第二次失敗的嘗試來自2024年的低點,觸發了一年的盤整,並導致2025年9月的第三次失敗突破。之後,買家放棄了,價格迅速回撤到2024年的低點,我們從那時起一直在該區間重新積累。
*這是一個巨大的多年結構。價格現在坐落在其低點,並展現出積累行為——可能正準備迎來下一次真正的突破嘗試。要是SOL在80美元的底部與ETH在上一個熊市的底部相同,這會多麼具有諷刺意味?
79–80美元是SOL的關鍵水平。持住它,設定仍然有效。失守,價格可能會回到20多美元的中段。
目前價格在支撐之上,這是你根據情況下注的地方。
補充SOL的觀點(第二張圖)——在日線圖上,宏觀下行趨勢是這裡的關鍵。
價格已經突破並在我看來,轉向上行。今天是該趨勢的第二次看漲回測,我們又獲得了一次乾淨的反彈——這正是你想看到的確認信號。
成交量輪廓也在傳達同樣的故事。大部分成交量集中在目前的價格附近,且價格保持在關鍵支撐之上。經典的積累行為。
有趣的是,從目前的水平到120美元之間,成交量輪廓幾乎沒有阻力。如果買家決定推動,幾乎是一
- 打賞
- 1
- 9
- 1
- 分享
FawzieR:
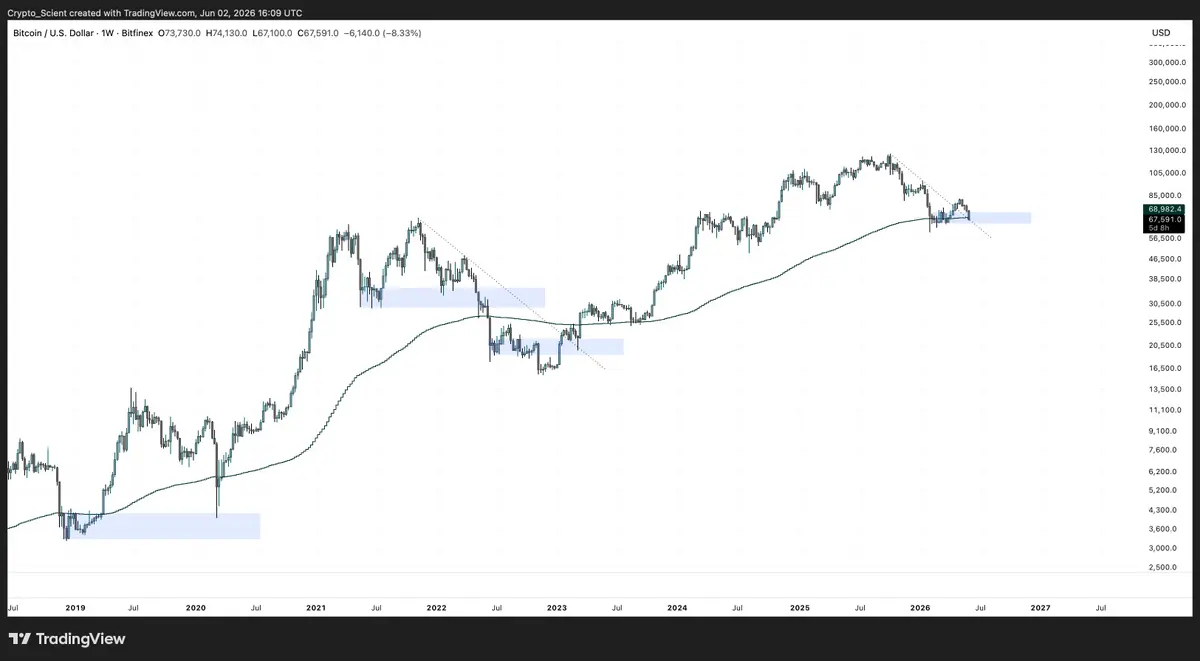
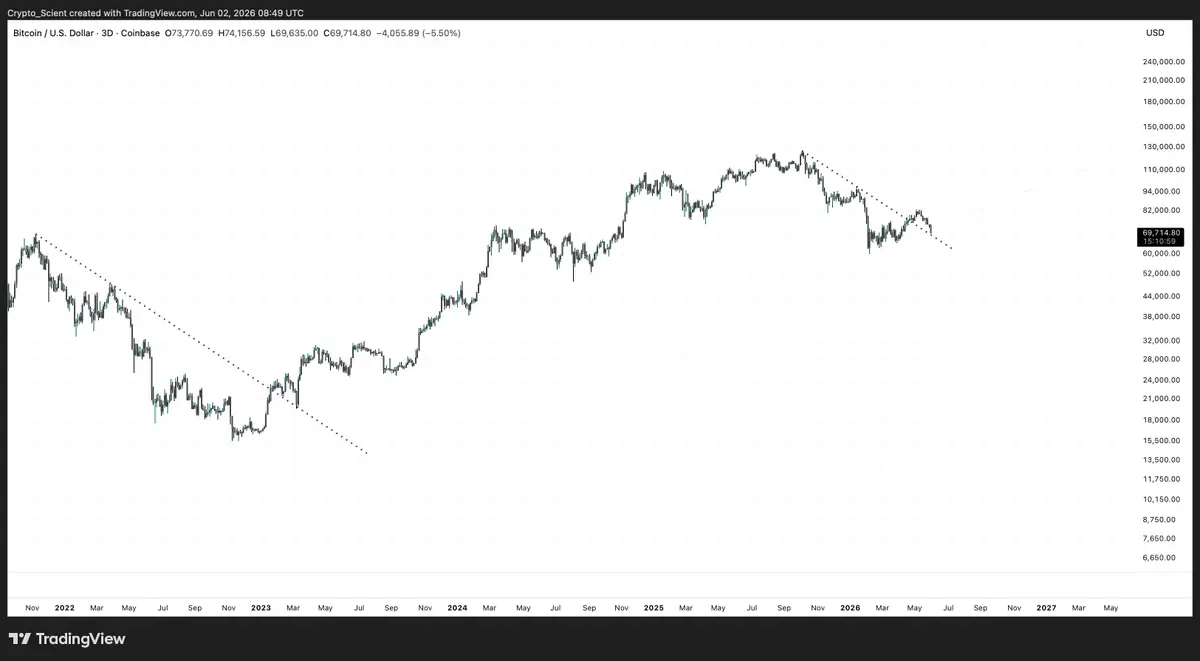
🎰 如果比特幣突然讓所有人震驚地價格飆升怎麼辦?Mariano 有一個計劃:如果 BTC 飆升至 $80K 並達到其上方的流動性水平,他將用它來將他的短期平均成本從 $77K 轉移到 $86K🔥 #Bitcoin #BTC #TradingStrategy #空頭賣出 #加密貨幣交易
查看更多