Summary
-
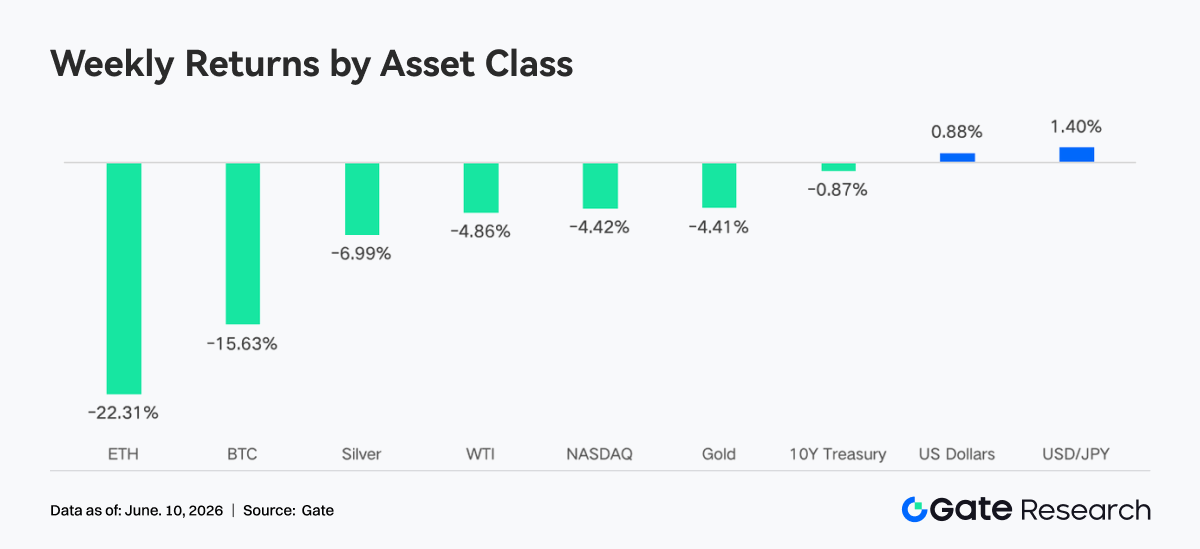
Last week, global macro markets experienced a dramatic transition from “warming sentiment” to a “sharp reversal.” Bitcoin fell about 15% for the week, Ethereum fell about 22%, and altcoins saw even deeper broad-based declines, with more than $300 billion wiped off total crypto market capitalization in a single week.
-
TradFi Perp DEX trading volume remained at a high level, while the share of stock and ETF asset trading continued to increase; after the launch of Gate U.S. stock trading, the number of assets expanded rapidly, showing that on-chain trading is accelerating its extension into traditional financial markets.
-
DEX trading recovered noticeably, with trading volume growth across major protocols such as Uniswap, PancakeSwap, and Aerodrome; total stablecoin supply declined slightly; the LST sector pulled back as a whole, Aave lending scale continued to decline, and new demand mainly flowed into emerging ecosystems such as MegaETH.
-
BTC fell from about $73K to around $62K, with OI down by more than 15%; 25D Skew dropped to an extreme negative value, and DVOL once rose to 52-54, showing a surge in market demand for hedging and that short-term downside protection demand reached a cycle high.
-
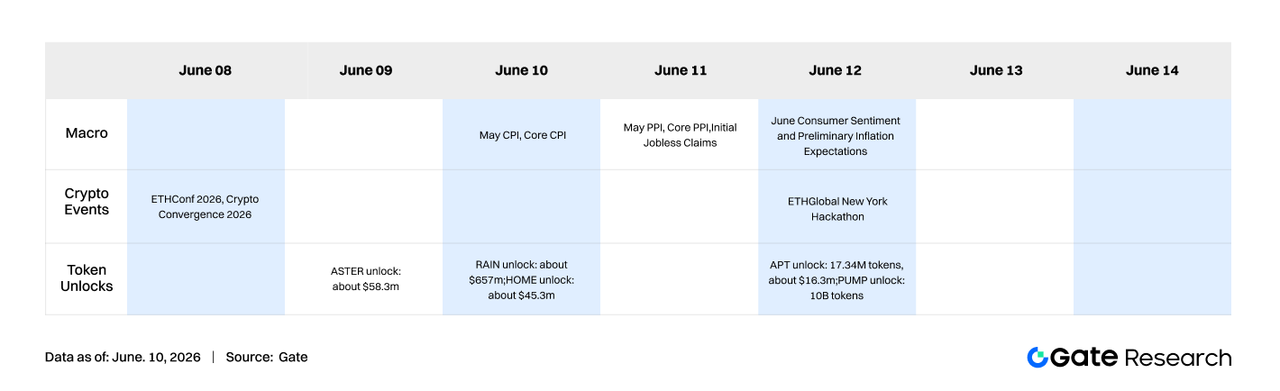
This week, the market will focus on macro data such as May CPI; events including ETH Conf 2026, Crypto Convergence 2026, and ETH Global New York Hackathon are expected to lift ecosystem attention.
-
Gate institutional business spot trading volume increased 92.16% week-over-week; CrossEx trading volume increased 47.1% week-over-week. The Gate Institutional Circle Amsterdam event was successfully held, attracting broad participation from more than 100 global market makers, asset managers, and other clients.
1. Interpretation of Market Focus
Last week, global macro markets experienced a dramatic transition from “warming sentiment” to a “sharp reversal.” At the beginning of the week, signs of phased easing emerged in the Middle East geopolitical situation, and U.S.-Iran negotiations were interpreted by the outside world as approaching the final stage. Together with the continued strength of AI-related technology stocks, the major U.S. stock indices rose one after another, with the S&P 500 hitting a record high during the week. At the same time, although Brent crude oil prices edged higher due to the geopolitical risk premium, they failed to effectively break through the psychological threshold of $100 per barrel, leaving inflation expectations relatively controllable and the overall market filled with optimism. Entering the second half of the week, Iran’s official stance became tougher, geopolitical signals diverged again, and the market briefly came under pressure, but sentiment remained within a controllable range.
The May nonfarm payrolls report released on Friday became the final macro trigger of the week. Nonfarm payrolls increased by 172,000, nearly double the market expectation of 88,000, and the previous reading was revised upward, while the unemployment rate remained at the full-employment level of 4.3%. The strong data completely shattered the market’s expectation of a near-term Fed rate cut. The interest-rate futures market immediately repriced, with the implied probability of a 25-75 basis point rate hike before year-end soaring to about 72%. The S&P 500 plunged about 2% that day, the Nasdaq dropped 3.4%, and the S&P implied volatility index surged 28% in a single day, marking the biggest one-day decline in nearly eight months. The 10-year U.S. Treasury yield rose from about 4.44% at the previous weekend to above 4.55%, returning to the 4.50% threshold. Historical experience shows that this level often constitutes a valuation turning point for long-duration technology and AI assets. In energy markets, Iran announced over the weekend the end of its military action against Israel, oil prices then fell back, and the futures market rebounded on Monday, with the geopolitical risk premium temporarily narrowing. Overall, the main macro narrative this week quickly switched from “betting on easing” to “higher rates for longer,” which was the core external driver of the simultaneous sharp correction in the crypto market.
In the crypto market, Bitcoin fell about 15% for the week and Ethereum fell about 22%, while altcoins saw even deeper broad declines. More than $300 billion was wiped off total crypto market capitalization in a single week. The Fear & Greed Index once fell into the “Extreme Fear” zone, and overall sentiment cooled rapidly along with macro risk appetite.
2. Liquidity Analysis
2.1 BTC and ETH ETFs as a Whole Continued Their Net Outflow Pattern
This week, spot Bitcoin ETFs as a whole continued their net outflow pattern, but a phased historical turning point appeared on June 5. Since the release of the April CPI data on May 12, BTC ETFs have recorded approximately $5.4 billion in cumulative net redemptions, including 13 consecutive trading days of outflows, the longest net outflow record since the products were launched. Under this pressure, total Bitcoin ETF assets under management across the market fell sharply from about $104.29 billion at the start of the outflow period to about $80.4 billion, a decline of more than 22%; total BTC holdings fell to about 1,277,000 coins, about 7.2% below the historical peak in October 2025 and only slightly above the phased low of about 1,274,000 on February 23. On the price side, BTC fluctuated violently in the roughly $59,000-$64,000 range this week, while AUM and holdings were simultaneously suppressed.
From a more macro perspective, the core driver of this round of BTC ETF net outflows was institutions’ reassessment of the Fed policy path after the release of the April inflation data, rather than a fundamental change in Bitcoin itself as an asset. As of early May, BlackRock’s IBIT still held about $67 billion in AUM, firmly remaining the largest crypto ETF in the world, and signs that large institutions were “buying more as prices fell” became increasingly evident during the sharp decline. The true trend-level turning point for inflows may need to wait until the release of the May CPI data on June 11 and until the market forms a new consensus on the Fed path for the second half of the year.
Spot Ethereum ETFs faced even more severe liquidity conditions than Bitcoin this week: after 17 consecutive trading days of net outflows, only a weak net inflow was recorded on June 5, signaling the end of this prolonged outflow window. Since listing in 2024, the ETH ETF category has accumulated about $11.21 billion in net inflows, but continued redemptions this year have pulled total AUM back by about $2 billion from its intrayear peak to around $9.78 billion, accounting for about 4.57% of Ethereum’s circulating market capitalization. Compared with Bitcoin ETFs’ greater market penetration over the same period, Ethereum ETFs’ institutional appeal still lags behind that of its larger counterpart, and the larger price correction has further dragged the pace of AUM shrinkage beyond that of Bitcoin.
2.2 TradFi Liquidity
-
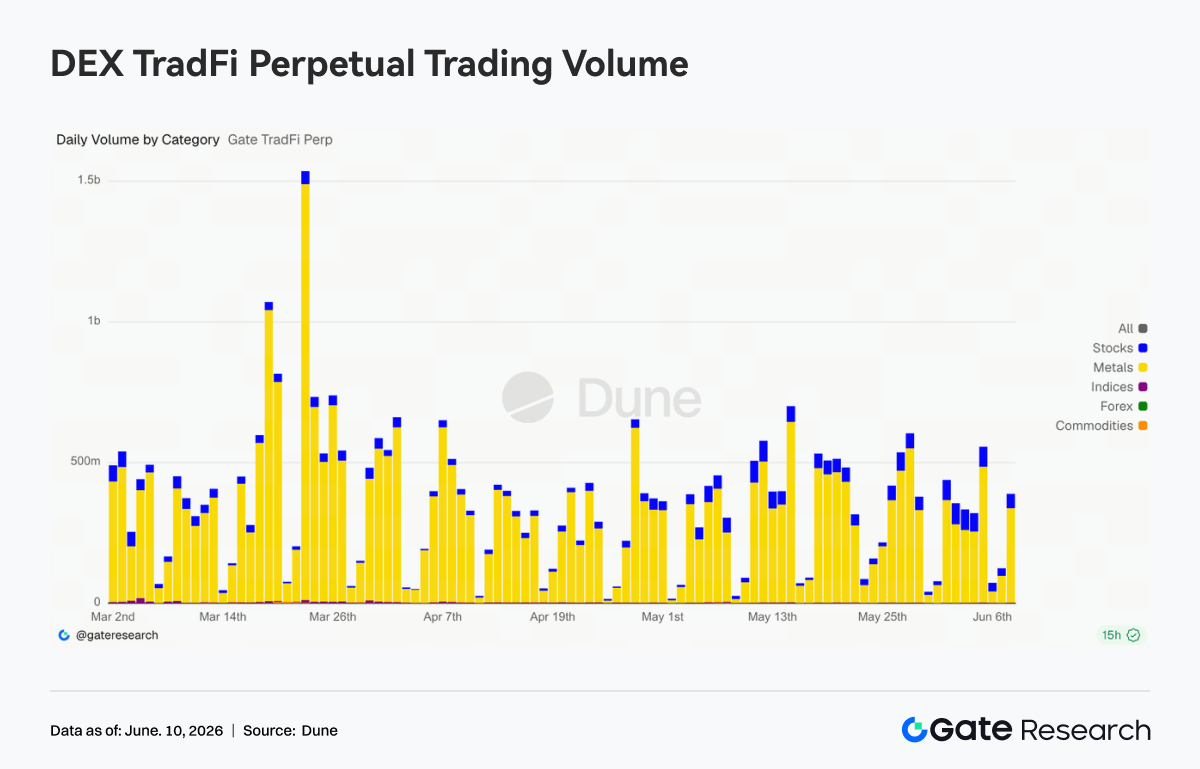
TradFi Perp DEX: Over the past week, overall trading volume in the TradFi Perp DEX market remained at a relatively high level, though it retreated from the March peak. By asset category, commodities remained the absolute leading sector, accounting for most of the trading volume. Contracts related to precious metals such as gold continued to attract capital participation, reflecting that market preference for safe-haven assets remains strong in an environment of macro uncertainty. The stock sector maintained steady growth, and its share continued to rise, showing that on-chain users’ trading demand for traditional equity assets such as U.S. stocks is increasing. At the same time, Indices/ETFs became the second-largest trading category, with trading scale remaining at a high level, providing users with more convenient index-based allocation tools.
-
Gate TradFi Perp Trading Volume: Last week, Gate TradFi Perp trading volume overall remained active. Affected by fluctuations in gold prices and rising macro safe-haven demand, the precious metals sector stayed in the $300 million to $600 million range on most trading days. At the same time, trading volume in stock-related contracts increased further, and its share expanded significantly compared with April, showing that user participation in U.S. stocks and related assets continued to strengthen.
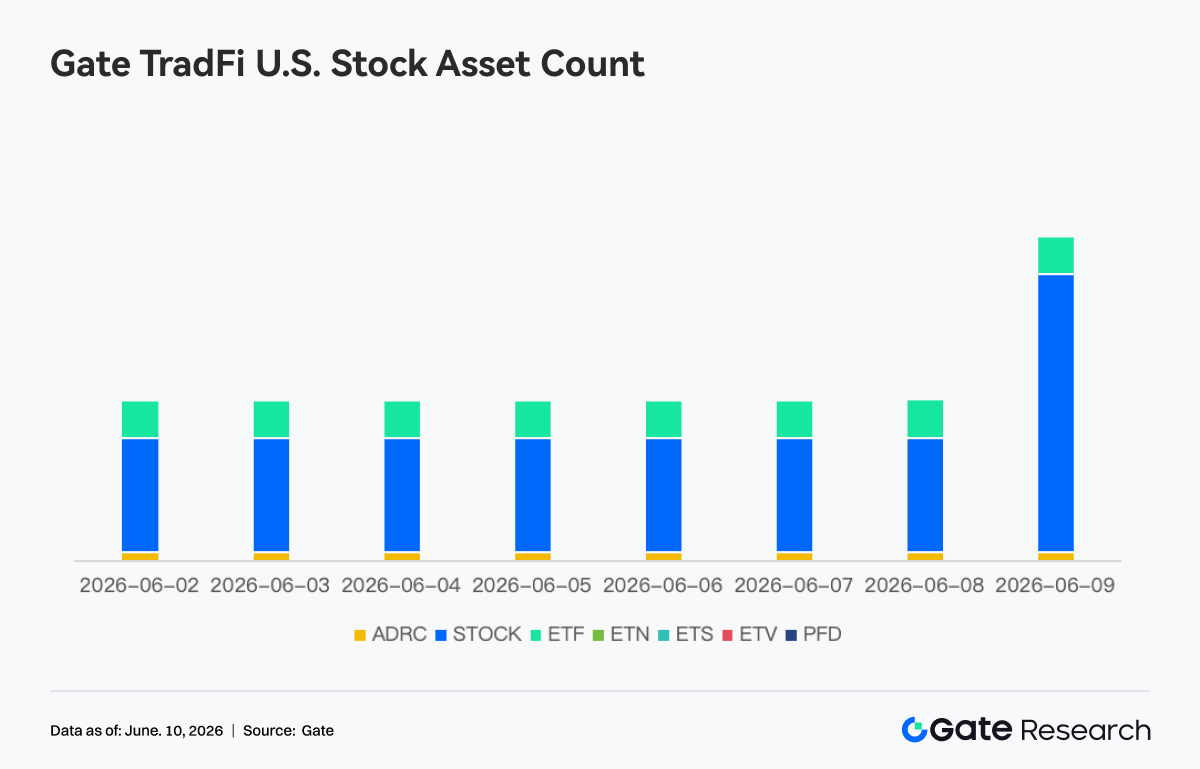
- Number of Gate TradFi U.S. Stock Assets: Gate officially launched its U.S. stock trading service on June 2. With advantages including support by real underlying assets, the ability to trade directly with USDT, no overnight holding fees, and high liquidity, the business has continued to receive market attention since launch, and trading volume has grown steadily. At present, Gate supports seven categories of assets: ADRC, stocks, ETFs, ETNs, ETSs, ETVs, and PFDs, and it continues to expand product coverage. In terms of asset count, the total number of tradable instruments has already doubled since launch. Among them, the stock category saw the most significant growth, with its share of all assets increasing from about 70% in the early stage of launch to 85%, further enriching users’ investment choices. In the future, Gate will continue to advance access to more markets, global liquidity integration, and the development of cross-market trading capabilities, continuously expanding diversified asset coverage and further strengthening its strategic positioning as a global asset trading and market access platform.
- TradFi Order Book Depth: We selected XAUT, which had the highest TradFi trading volume, and analyzed its order book depth (Delta). Looking at changes in XAUT order book liquidity over the past week, the market as a whole showed a pattern in which sell-side depth dominated, while buy-side support strengthened in phases but lacked persistence. From May 28 to 29, the order book once saw a positive liquidity increase of more than $1 million, pushing the XAUT price rapidly from about $4,380 to above $4,500, showing that buyers actively replenished depth and supported the price higher. However, starting from May 30, the order book continuously saw negative liquidity changes. Especially around June 2, net sell-side depth increased by more than $3 million in a single hour, the largest selling-pressure zone of the cycle, after which the XAUT price continued to fall back from around $4,500. Although several buy-side liquidity injections of more than $1 million appeared after June 6, the strength of the price rebound was limited, indicating that the new buy orders were more about absorbing selling pressure than driving a trend reversal. As of June 9, order book Delta was still mainly negative, indicating that the structure of market resting orders remained bearish. In the short term, XAUT may remain in a weak and volatile pattern, and attention should be paid to whether buy-side depth can continue to recover and regain dominance in the order book structure.
3. On-Chain Data Insights
3.1 DEX Trading Rebounds, Capital Returns to Mainstream Trading Scenarios
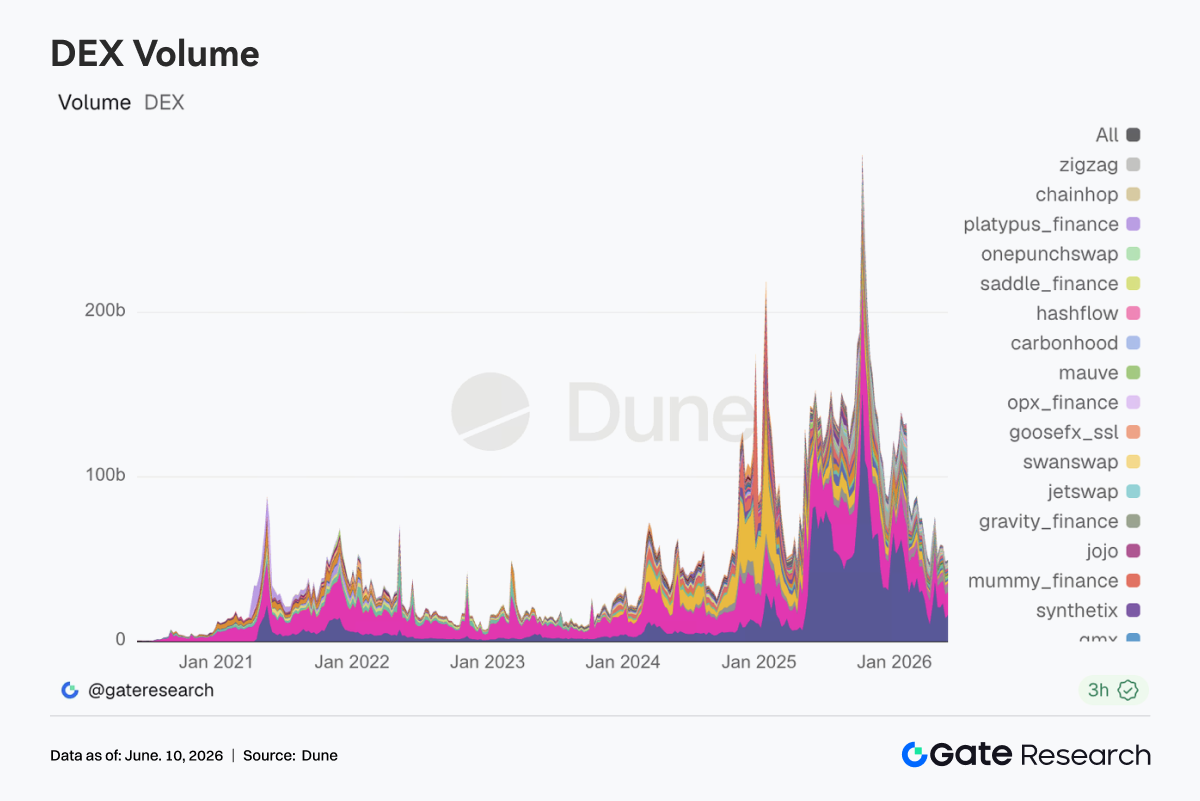
DEX trading recovered clearly, with Uniswap and PancakeSwap becoming the main sources of volume growth. Platforms such as Aerodrome, Bisonfi, Curve, and Fluid also saw concurrent volume expansion, and capital is returning to mainstream liquidity pools and core trading scenarios. In the Solana ecosystem, volume in Meteora, Raydium, and Whirlpool recovered somewhat, but growth in PumpSwap and pump.fun-related routes remained relatively limited, while meme trading activity continued to weaken.
3.2 Stablecoin Supply Edges Lower, Competitive Focus Shifts to Payments and Cross-Chain Infrastructure
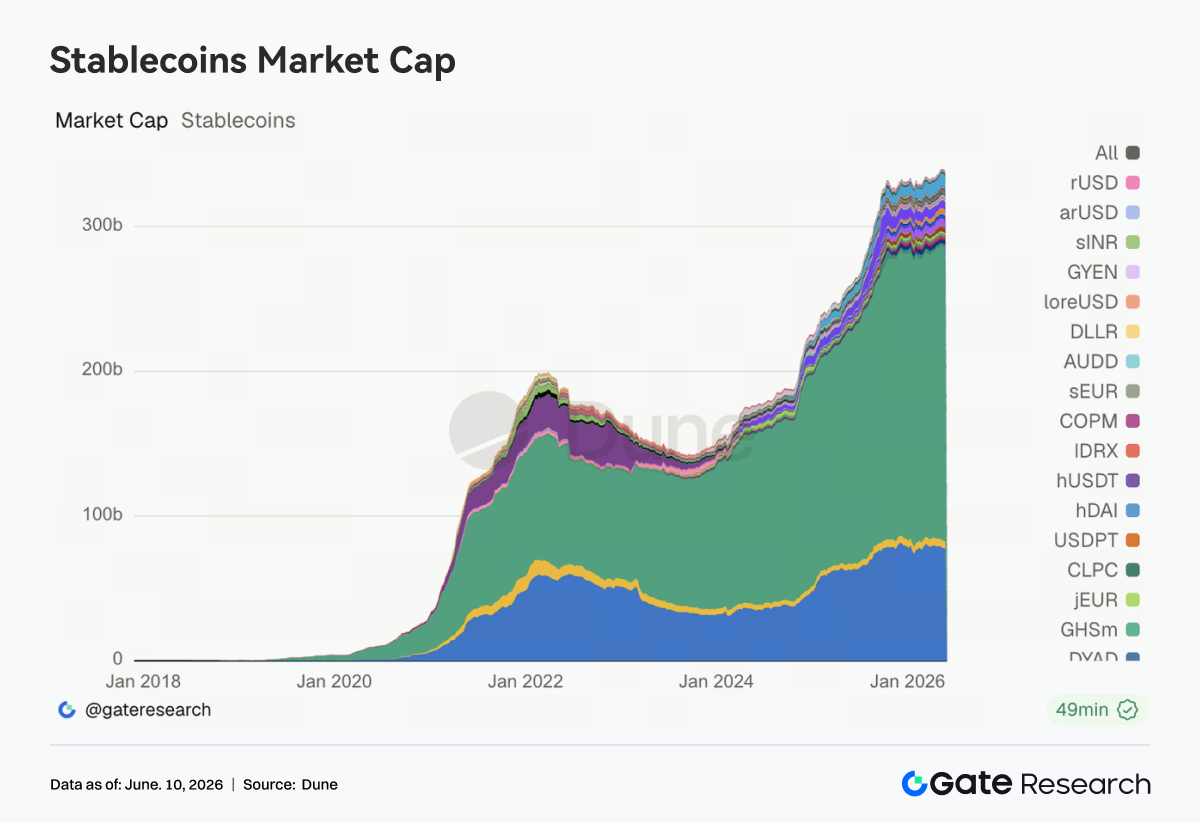
Total stablecoin supply as a whole contracted slightly, with the scale of major stablecoins such as USDT, USDC, USDS, DAI, and PYUSD mostly declining, while GHO remained basically stable. Compared with short-term market cap changes, the competitive focus in the stablecoin track is shifting toward payment networks, cross-chain liquidity, and regulatory compliance capabilities. In the United States, discussion around stablecoin yield mechanisms and market structure continues to intensify, and clear differences still remain between the banking system and crypto institutions over the development path of yield-bearing stablecoins. At the same time, Circle continues to advance CCTP V2, multi-chain settlement support, and developer ecosystem construction, further strengthening USDC’s infrastructure positioning in cross-chain transfers, trading collateral, and institutional settlement scenarios. Competition in the stablecoin industry is gradually shifting from issuance-scale expansion to capability building at the payment and settlement layers.
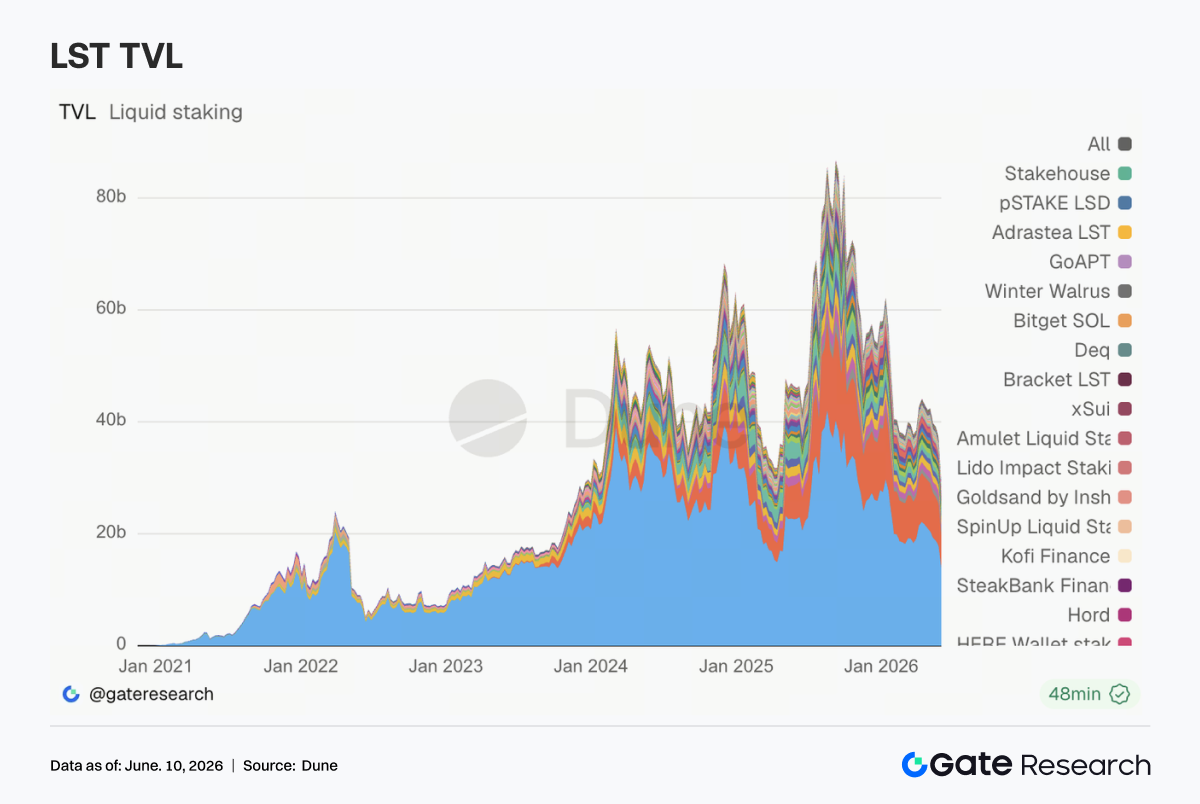
3.3 LST Sector Pulls Back as a Whole, Capital Continues to Reduce Exposure to Yield Assets
The LST sector came under broad pressure. Lido, Rocket Pool, and StakeWise in the Ethereum ecosystem all pulled back, and Sanctum, Jito, and Jupiter Staked SOL in the Solana ecosystem also weakened in tandem. Unlike previous periods when capital rotated among different staking protocols, this week saw a broad reduction of positions across the sector. Asset price adjustments, ETF fund outflows, and declining risk appetite for yield-bearing assets jointly pushed capital to reduce exposure to staked assets. After the rsETH/KelpDAO incident, the market’s risk assessment of wrapped staking assets has clearly become more conservative, and institutional investors continue to pay more attention to cross-chain security, redemption mechanisms, and underlying asset transparency. Recent discussion around Lido’s selection of Chainlink CCIP for wstETH cross-chain expansion also reflects that this track is gradually shifting toward security and liquidity management capabilities.
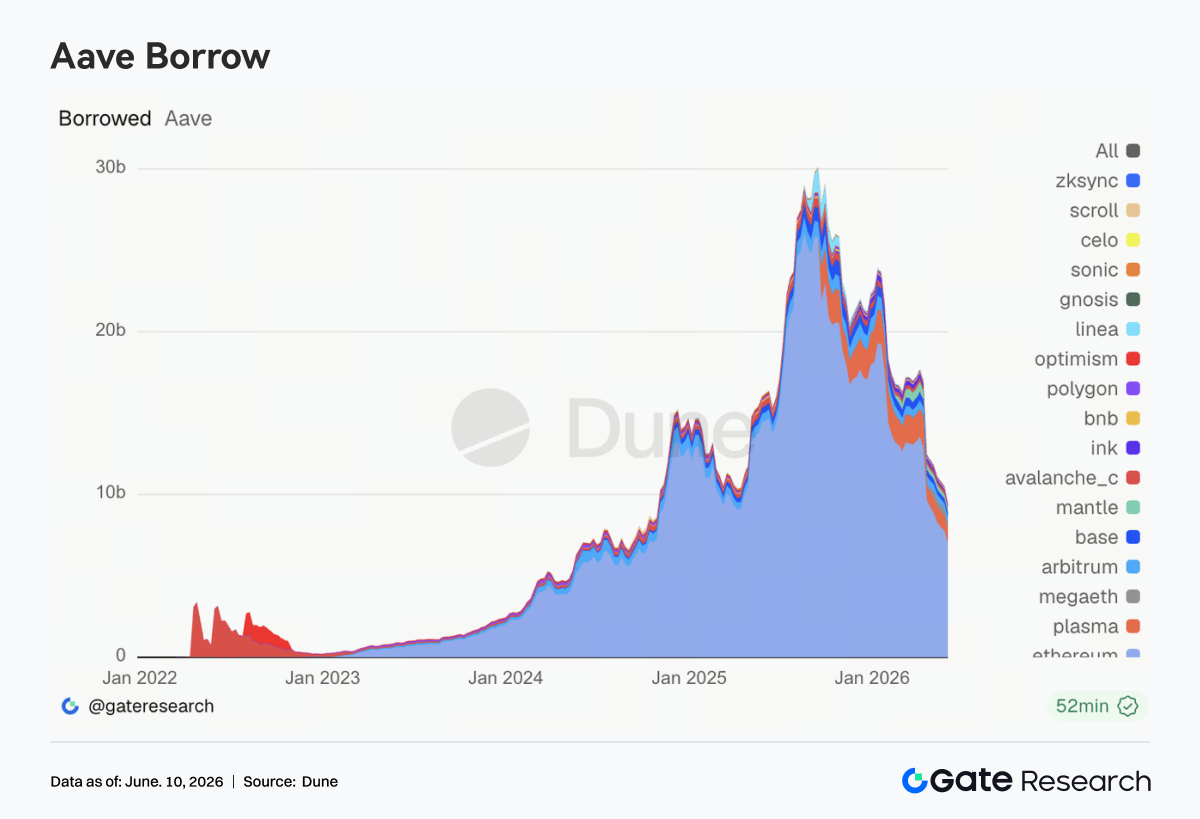
3.4 Aave Loan Scale Continues to Pull Back, with New Demand Concentrated in Emerging Markets
Aave lending balances continued their downward trend, with major markets including Ethereum main market, Plasma, Arbitrum, Base, and Mantle all declining from the previous week. Ethereum remains the largest lending market, but this week it was also one of the main sources of contraction in loan scale. In contrast, MegaETH became one of the few markets still showing relative resilience, with new lending demand concentrated in emerging ecosystems with stronger incentives and faster growth. However, this incremental demand is still insufficient to offset the impact of overall deleveraging in the main markets. Overall, risk repair after the rsETH/KelpDAO incident is still ongoing, and users have become more cautious in collateral selection, leverage levels, and cross-chain allocation. On the governance side, recent discussion in the Aave community around the Emergency Guardian, the USDC liquidity buffer mechanism, and the V4 architecture upgrade continues to move forward, making risk management capability an important component of protocol competitiveness.
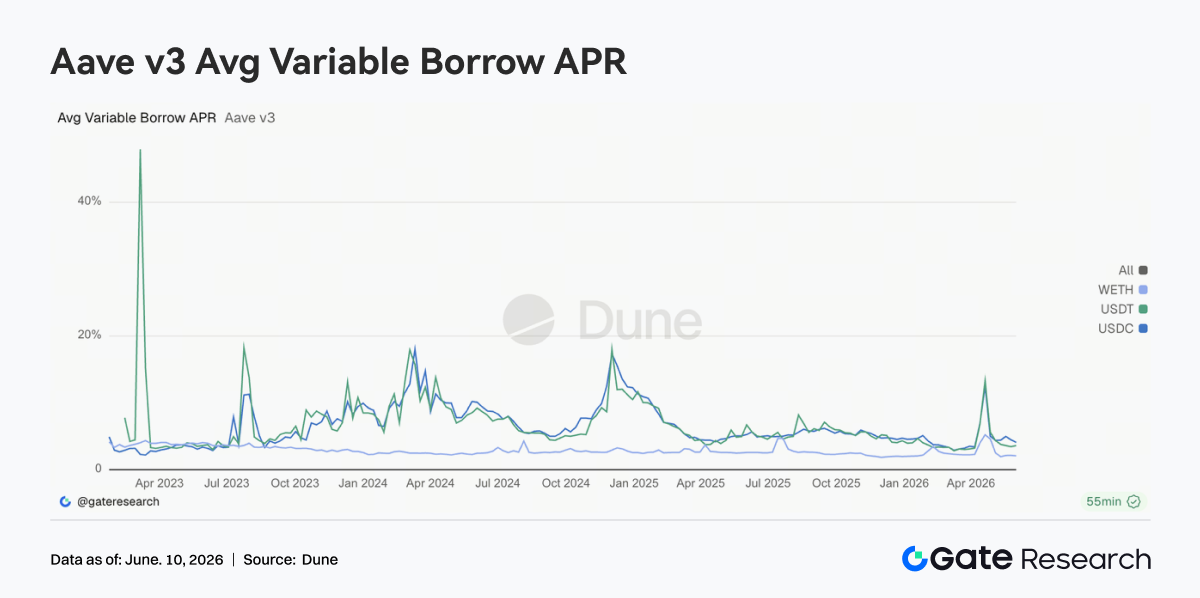
3.5 Aave Core Lending Rates Tend Toward Stability, with Liquidity Pressure Clearly Easing
Borrowing rates for Aave core assets overall remained stable. USDC borrowing rates fell back from previous highs, WETH continued to stay at low levels, and USDT showed only slight fluctuations. Compared with the liquidity shock period in April, the market has now basically returned to a normalized funding environment. Although USDC still experienced brief rate increases in some periods due to rising utilization, the overall amplitude of fluctuations has narrowed significantly. Recent discussion in the Aave community around USDC liquidity buffers and optimization of the interest-rate model also helps reduce sharp swings in funding costs under extreme circumstances. The current rate structure shows that the market is more inclined to use stablecoins for short-term funding turnover rather than rebuilding large-scale directional leverage.
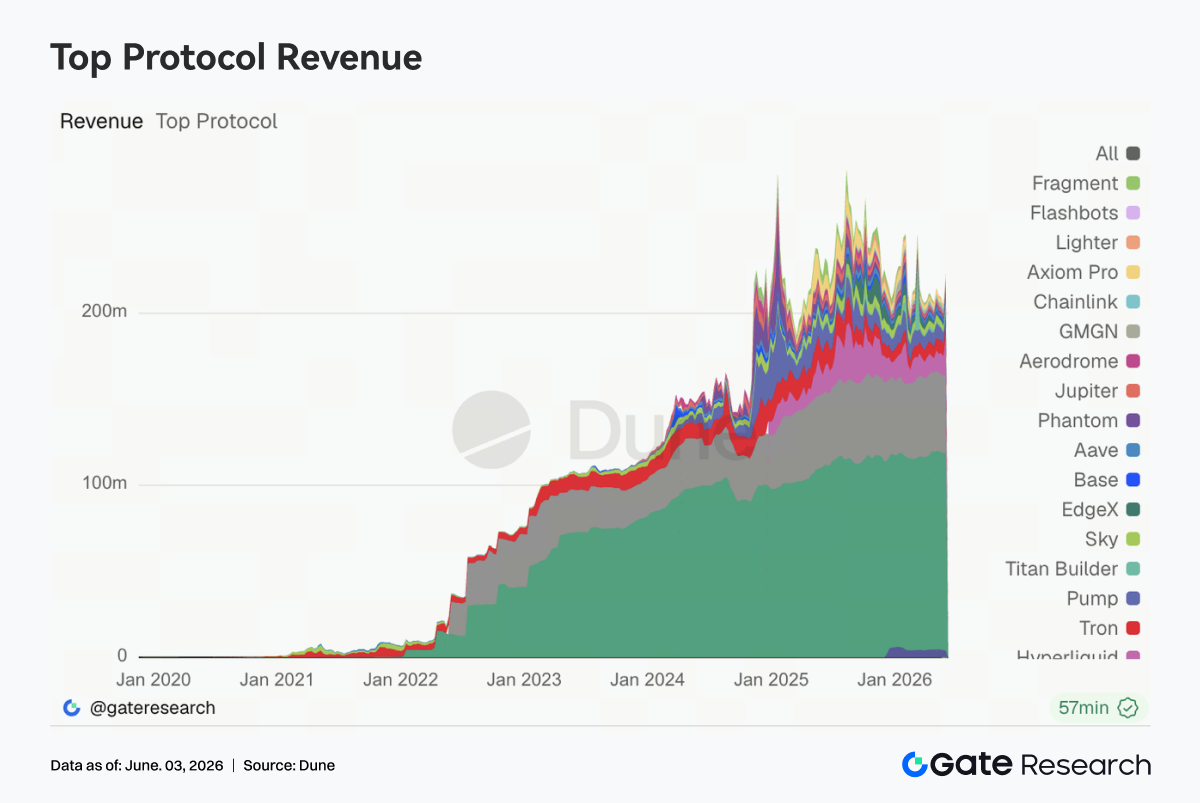
3.6 Hyperliquid Drives Revenue Growth, Derivatives Infrastructure Continues to Benefit
The biggest highlight in protocol revenue this week came from Hyperliquid. Perps business revenue grew significantly, while spot order book and L1-related revenue also increased in tandem, making it one of the protocols with the strongest revenue growth this week. This trend is highly consistent with the market’s focus. In early June, HYPE’s market capitalization performance continued to strengthen, and market discussion around Hyperliquid’s gain in global perpetual contract market share clearly heated up. At the same time, new products such as stock index perpetuals and Pre-IPO Perpetuals gradually attracted trading activity, and capital began to expand from traditional crypto asset trading into the broader on-chain derivatives market. In addition, Tether and Circle still maintained stable revenue contributions, but with limited growth elasticity; Aave V3 revenue recovered, driven more by spread income after the return of risk premia; platforms such as Pump and Axiom that rely on meme trading activity continued to decline. From the perspective of revenue structure, long-tail speculative assets were left out of favor by capital, while core trading infrastructure with matching, clearing, and settlement capabilities was favored. Hyperliquid’s continued growth further reinforces the capital attractiveness of derivatives protocols in the current market cycle.
4. Derivatives Tracking
4.1 BTC Funding Rates Stay Positive While Price Falls Rapidly, Concentrated Liquidations of Leveraged Longs
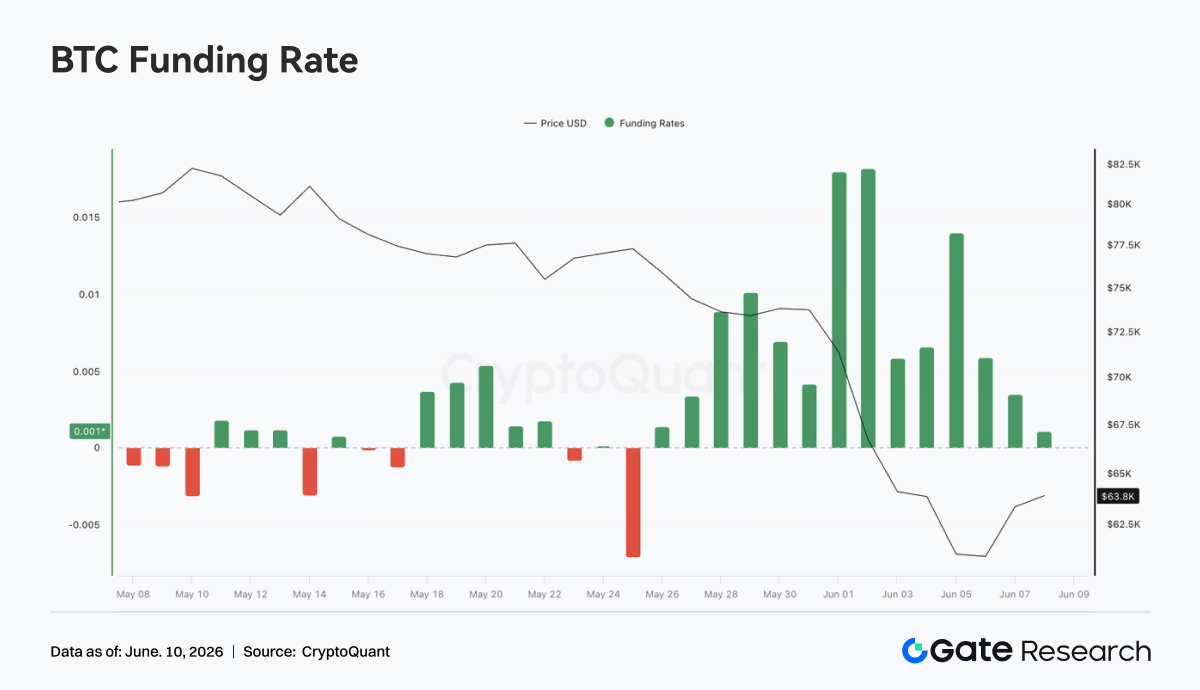
From June 1 to June 7, 2026, BTC price saw a significant decline, dropping rapidly from about $73K at the beginning of the week to around $62K at one point, before only slightly recovering to around $63K over the weekend. At the same time, funding rates remained positive throughout the week and rose to a phased high of about 0.018 from June 1 to June 2, showing that the market still had a relatively strong leveraged long bias in the early stage of the price decline. This combination of “rapid price decline while funding rates remain positive” indicates that longs did not exit in time during the decline, and instead there was behavior of bottom-fishing, adding to positions, or passively holding. Longs continued paying funding fees while also bearing the price decline, significantly increasing the pressure of forced liquidations and active deleveraging.
OI continued to fall from about $26B at the beginning of the week to around $22B, a drop of more than 15%, and was highly synchronized with the price decline. The combination of falling price and a sharp contraction in OI indicates that this round of market movement was mainly driven by the liquidation of leveraged longs and the reduction of risk exposure, rather than simply by a buildup of new shorts. Overall, the BTC derivatives market completed a clear round of long deleveraging this week. Although OI has fallen to a phased low, funding rates have not yet fully turned negative, indicating that long sentiment has not been completely cleared out. If the price falls below support around $62K again, residual leveraged longs may still face further liquidation pressure.
4.2 Options Volume Expands Significantly, Monthly Contracts Dominate Hedging and Position-Rolling Demand
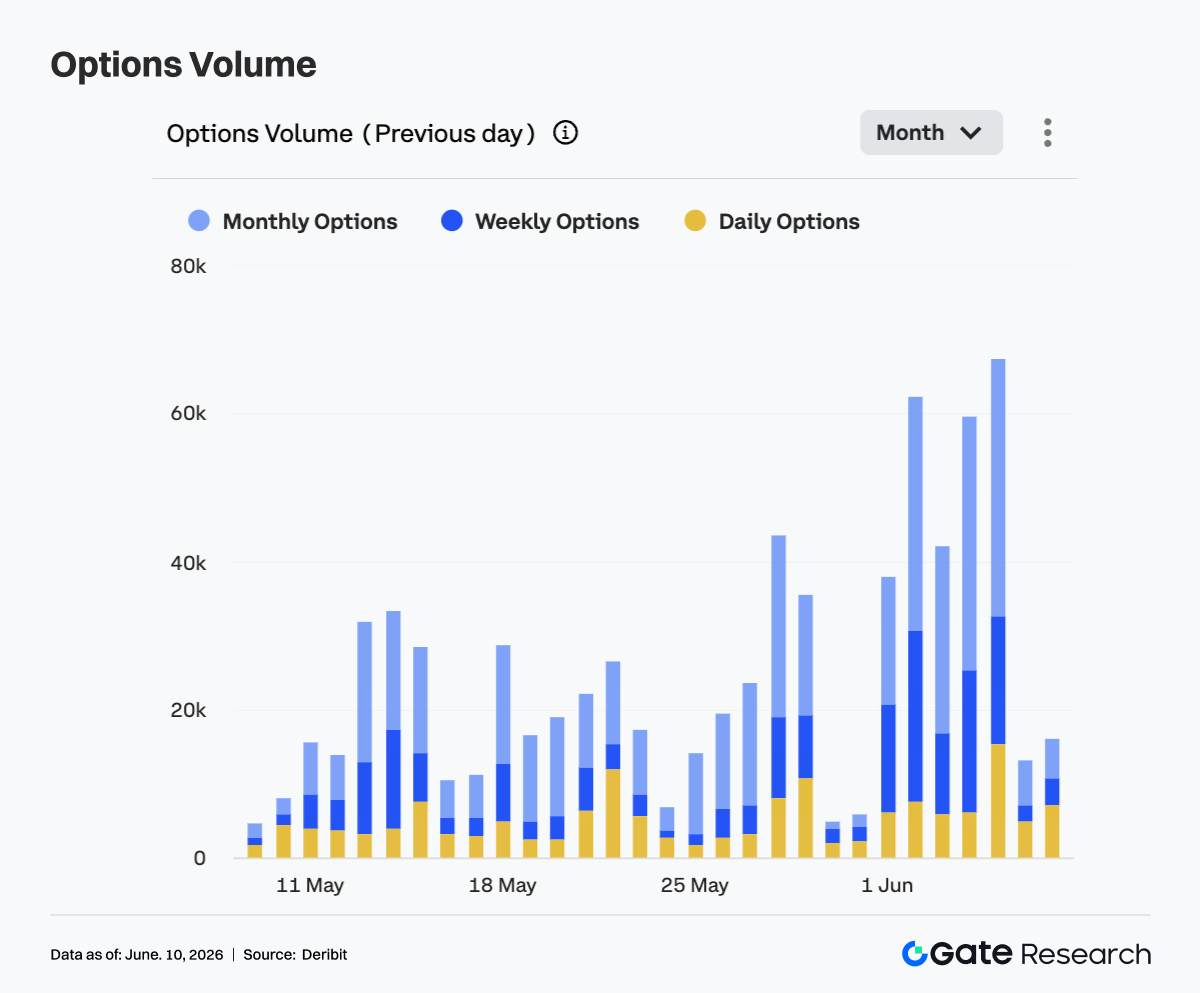
From June 1 to June 7, BTC options trading volume was clearly higher than in previous weeks and showed pulse-like expansion. Trading volume was about 38K at the beginning of the week and then quickly rose above 60K. On multiple trading days during the week, volume remained in the 40K-60K range, peaking near 68K, showing that options trading and risk-hedging demand increased significantly during the rapid price decline. Structurally, monthly options remained the main source of trading volume and contributed most of the increase during peak periods, indicating that market participants preferred to use monthly contracts for medium-term risk management and position adjustment. Weekly options volume also increased noticeably, reflecting simultaneous warming in short-term directional trading and downside protection demand.
Daily options volume expanded significantly on some trading days, indicating that during periods of rapid price volatility, the market was also using short-dated instruments for event trading and temporary hedging. But in terms of overall share, the options market still remained dominated by monthly and weekly contracts and did not fully shift to ultra-short-cycle trading. Over the weekend, trading volume quickly fell back to about 15K, indicating that after prices entered low-level consolidation, concentrated hedging demand cooled somewhat. Overall, the expansion in options trading volume during this cycle was highly synchronized with BTC’s decline, reflecting concentrated position rolling and risk management during the period of intense volatility.
4.3 25D Skew Dives Deeply, Short-Dated Downside Protection Demand Reaches Extreme Levels
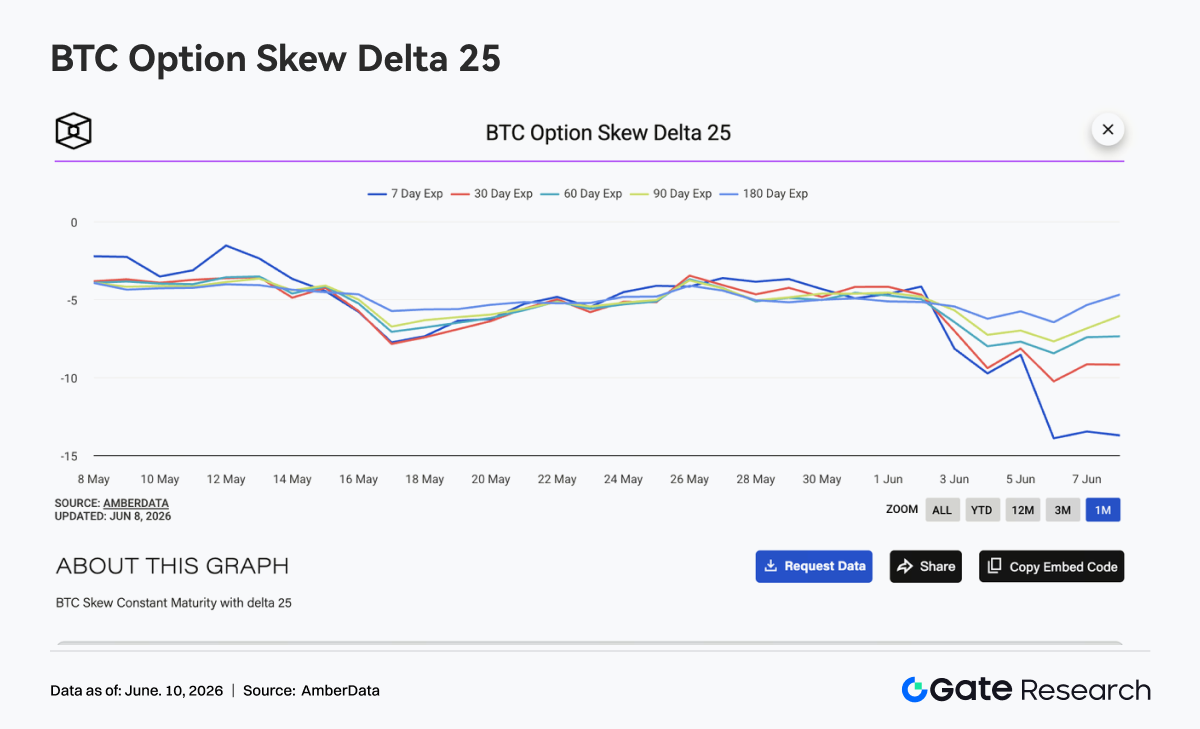
BTC 25D Skew across all maturities moved lower across the board last week, with short-dated maturities seeing the most significant changes. At the beginning of the week, Skew at most maturities stayed around -4 to -5, but as BTC broke below $70K and continued lower, 7D Skew dropped rapidly and fell to about -14 by the weekend. During the same period, 30D Skew fell back to around -9 to -10, 60D and 90D Skew declined to around -8 and -7 respectively, and 180D Skew remained relatively stable but still fell to around -6. The synchronized weakening in Skew across maturities shows that market concern over downside risk has spread from the short term to the medium and long term.
The fact that 7D Skew was significantly lower than other maturities reflects a sharp rise in the premium of short-term put options, with the market paying a higher cost for near-term downside protection. The obvious divergence among maturities also indicates that the market sees short-term risk as the most concentrated, while pricing of the long-term trend remains relatively restrained. Overall, Skew entered an extreme defensive state this week. If BTC stabilizes in the $62K-$64K range, short-dated Skew may recover quickly; but if price falls below the previous low again, demand for downside protection may continue to rise, and Skew may remain deeply negative.
4.4 DVOL Expands Rapidly, Market Shifts from a Low-Volatility Phase to a High-Volatility Phase
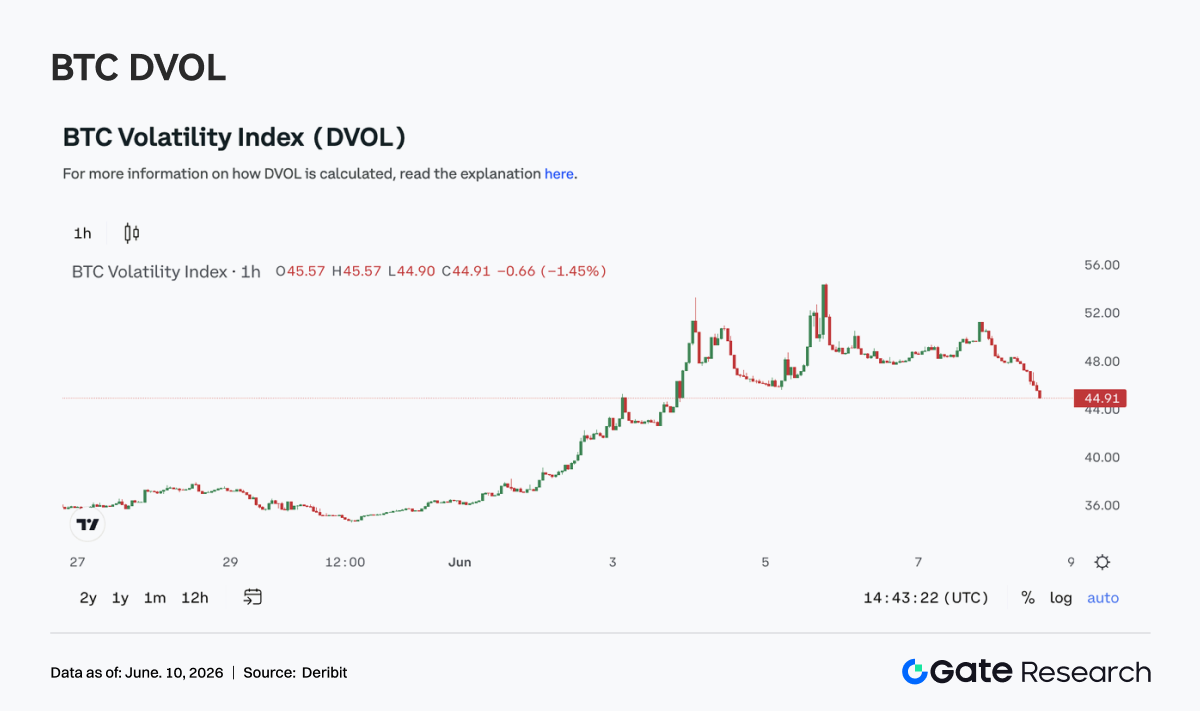
BTC volatility index DVOL rose rapidly from about 36. After June 3, as the price decline widened, DVOL broke above 44 and once rose to around 52-54 on June 4 to June 5, showing that the options market significantly raised its pricing of future volatility. Unlike the prior week’s structure of “price decline but volatility staying low,” this week price, OI, Skew, and DVOL all simultaneously released clear risk signals. BTC falling to about $62K, OI dropping sharply, and Skew turning deeply negative together pushed implied volatility into a phase of rapid expansion.
As prices temporarily stabilized over the weekend, DVOL fell back from its high to about 45, but it still remained clearly above the level at the beginning of the week, indicating that the risk premium has not fully faded. The current market has already shifted from a state of low-volatility gradual decline into a state in which high volatility and high protection demand coexist. Overall, the retreat of DVOL from its high does not mean that risk has been fully removed. If BTC fails to reclaim $65K, implied volatility may continue to remain elevated; if price falls below $62K again, DVOL may challenge the previous high again.
5. Outlook
6. Gate Institutional Business Updates
-
Following three consecutive weeks of market correction, trading activity rebounded significantly, with Gate's spot trading volume increasing by 92.16% week-over-week.
-
Spot market performance outpaced the broader market, with Gate's share of BTC and ETH trading volume across the market rising by 25.54% compared to the previous week.
-
Institutional spot trading contribution continued to grow, further optimizing the platform's overall trading structure.
6.2 CrossEx Ecosystem Continued to Expand
-
During the first week of June, CrossEx trading volume increased by 47.1% week-over-week.
-
Support was added for spot trading on a new major centralized exchange and trading on an additional decentralized exchange (DEX), further expanding ecosystem coverage.
6.3 Lending Business and Capital Services Upgraded
-
The OTC Loan risk management framework was upgraded to improve risk handling efficiency.
-
New automated liquidation mechanisms and an enhanced tiered risk alert system were introduced, further strengthening institutional fund security.
6.4 Continuous Enhancements to Technology and Institutional Infrastructure
-
An optimized version of the Spot WebSocket low-latency trading service has officially gone live in the simulation trading environment.
-
CFD API functionality was officially launched, supporting both order execution and query capabilities via API.
-
The asset management platform will soon support third-party institutions in issuing investment products and distributing them directly to platform users.
6.5 Successful Hosting of Gate Institutional Circle Amsterdam
-
The event attracted more than 100 participants from global market makers, asset managers, payment providers, OTC desks, and institutional trading firms.
-
Discussions focused on key topics including institutional liquidity, cross-border settlement, compliant fiat on/off-ramp channels, and digital asset infrastructure.
-
The event further strengthened Gate's presence in the European institutional market and advanced the development of its global institutional partnership network.
Data Source:
- Investing, https://investing.com/currencies/xau-usd-historical-data
- Gate, https://www.gate.com/trade/BTC_USDT
- CMC, https://coinmarketcap.com/real-world-assets/?type=all-tokens
- Coinglass, https://www.coinglass.com/pro/depth-delta
- Dune, https://dune.com/gateresearch/gate-tradfi#weekly-volume
- Dune, https://dune.com/gateresearch/gate-institutional-weekly-report
- Bybit, https://www.bybit.com/future-activity/en/tradfi
- Bitget, https://www.bitgettradfi.com/tradfi/XAUUSD
- CryptoQuant, https://cryptoquant.com/asset/btc/chart/derivatives
- Amberdata, https://pro.amberdata.io/options/deribit/btc/current/
Gate Research is a comprehensive blockchain and cryptocurrency research platform that provides deep content for readers, including technical analysis, market insights, industry research, trend forecasting, and macroeconomic policy analysis.
Disclaimer
Investing in cryptocurrency markets involves high risk. Users are advised to conduct their own research and fully understand the nature of the assets and products before making any investment decisions. Gate is not responsible for any losses or damages arising from such decisions.