# Article Overview
This comprehensive AINN price analysis delivers expert forecasts and investment strategies for Web3+AI investors. The article addresses critical questions about AINN's market positioning, price trajectory through 2031, and risk management approaches. Designed for crypto investors ranging from beginners to institutional players, it combines historical market data, technical analysis, and ecosystem development insights. The guide structure progresses from current market status and core influencing factors through detailed price predictions (projecting 93% appreciation by 2031) to actionable investment methodologies. Readers gain practical trading strategies on Gate, risk mitigation frameworks, and clear understanding of BRC20 protocol opportunities and challenges in the evolving AI-blockchain convergence landscape.
Introduction: AINN's Market Position and Investment Value
AINN (AINN), short for Artificial Neural Network, is a leaderless inscription deployed on the BRC20 protocol, representing a strong consensus on the combination of Web3 and AI as a long-term value for the future. Since its inception in May 2023, AINN has established itself as one of the most globalized communities within the BRC20 track. As of 2026, AINN's market cap has reached $135,387, with a circulating supply of 21,000,000 tokens, currently trading around $0.006447. This distinctive asset, recognized as a pioneering Web3+AI fusion project, is increasingly playing a crucial role in creating use cases for blockchain-based AI applications.
The AINN community aggregates Web3 industry leaders, founders of Web3+AI projects, and high-quality holders with profound belief in the convergence of Web3 and AI. Guided by the shared vision of deeply integrating Web3 with AI to generate immense value for human society, nearly a hundred ecosystem projects are currently being developed around AINN, continuously expanding its utility and adoption.
This article will provide a comprehensive analysis of AINN's price trends through 2031, integrating historical patterns, market supply and demand dynamics, ecosystem development, and macroeconomic factors to deliver professional price forecasts and practical investment strategies for investors seeking exposure to the evolving Web3+AI landscape.
AINN Market Analysis Report
I. AINN Price History Review and Current Market Status
AINN Historical Price Evolution
- May 2023: AINN was deployed as a leaderless inscription on the BRC20 protocol, marking the beginning of the Web3+AI convergence narrative.
- February 2024: AINN reached its all-time high of $2.96 on February 22, 2024, representing peak market enthusiasm for the Web3+AI ecosystem theme.
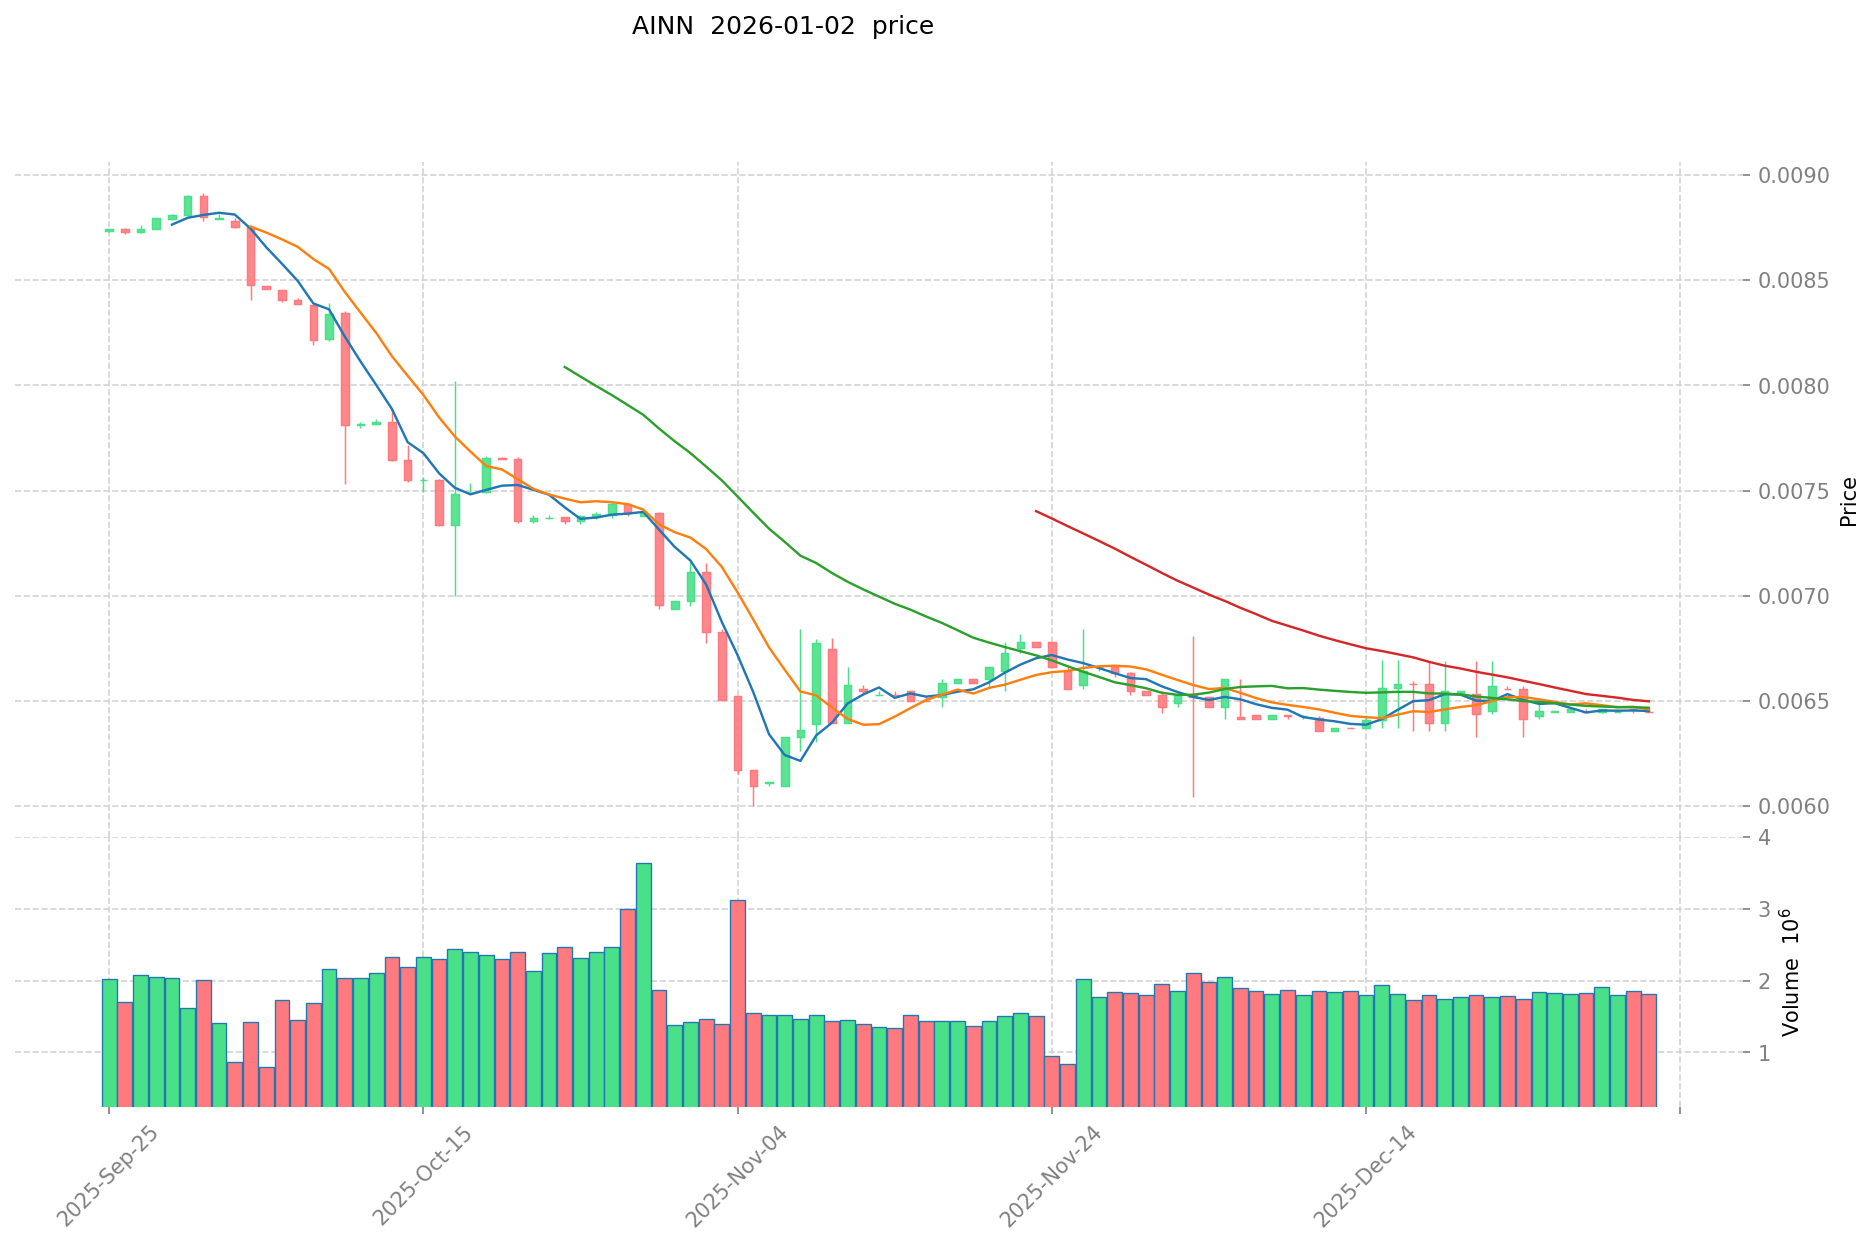
- January 2026: AINN declined significantly to $0.006447, representing a 91.23% decline from its all-time high over the past year.
AINN Current Market Status
As of January 3, 2026, AINN is trading at $0.006447 with a 24-hour trading volume of $11,820.52. The token maintains a market capitalization of $135,387.00 with a fully diluted valuation (FDV) of $135,387.00, indicating that the circulating supply equals the maximum supply of 21,000,000 tokens.
The 1-hour price change shows a slight recovery of +0.058%, while the 7-day performance remains relatively flat at +0.02%. However, the 30-day price action reflects weakness with a -1.11% decline, and the 1-year performance demonstrates substantial bearish pressure with a -91.23% decline from higher valuation levels.
The token currently maintains a market dominance of 0.0000041% within the broader cryptocurrency ecosystem. AINN ranks at position 4,561 by market capitalization, with approximately 20,986 active token holders. The trading activity remains limited, with AINN available for trading on Gate.com, demonstrating modest liquidity in the current market environment.
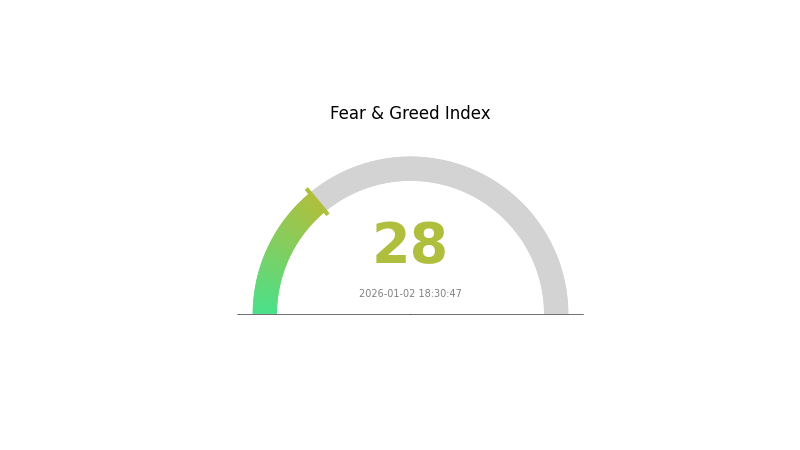
Market sentiment indicators suggest a "Fear" environment with a VIX reading of 28 as of January 2, 2026, reflecting broader market risk aversion that may be impacting alternative token valuations.
Click to view current AINN market price
AINN Market Sentiment Indicator
2026-01-02 Fear and Greed Index: 28 (Fear)
Click to view current Fear & Greed Index
The cryptocurrency market is currently experiencing significant fear sentiment with an index reading of 28. This indicates heightened market anxiety and risk aversion among investors. During such periods, market participants tend to adopt defensive strategies and reduce exposure to volatile assets. This presents potential opportunities for contrarian investors who believe in long-term value. Traders should exercise caution and implement proper risk management. Monitor key support levels and consider dollar-cost averaging strategies. Gate.com provides comprehensive market data tools to help you make informed trading decisions during volatile market conditions.
AINN Holdings Distribution
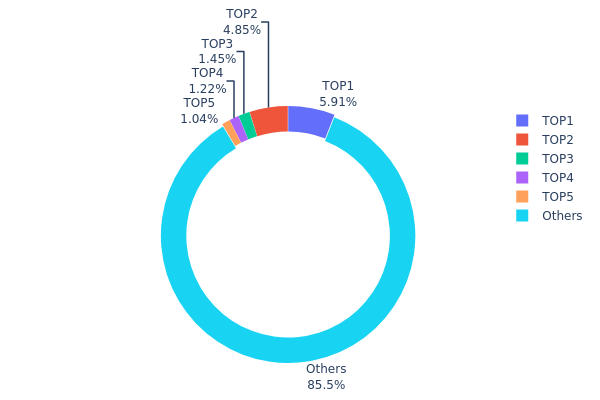
The holdings distribution chart illustrates the concentration of AINN tokens across blockchain addresses, measuring the proportion of total circulating supply held by the top addresses. This metric serves as a critical indicator for assessing token decentralization and potential market manipulation risks. By analyzing the concentration pattern, investors and analysts can evaluate the resilience of the token's market structure and the degree of centralization within the network.
Current data reveals a relatively healthy distribution of AINN tokens. The top five addresses collectively hold approximately 14.46% of the total supply, with the largest holder controlling 5.91%. This concentration level suggests moderate token distribution rather than extreme centralization. The top address holds 1,241.70K tokens, followed by the second-largest holder with 1,019.01K tokens, indicating a gradual decline in individual holdings. Notably, the "Others" category accounts for 85.54% of the supply, representing the remaining addresses in the ecosystem. This substantial portion held by dispersed addresses demonstrates a reasonably decentralized token structure.
The current distribution pattern reflects a market structure with limited immediate concentration risks. The absence of any single entity controlling an overwhelming majority of the supply suggests reduced potential for coordinated price manipulation or sudden large-scale liquidations that could destabilize the market. However, the concentration among the top five addresses warrants continued monitoring, as coordinated movements by these holders could still influence market dynamics. Overall, AINN demonstrates characteristics aligned with a relatively distributed token ecosystem, supporting organic market development and community participation.
View current AINN holdings distribution
| Top |
Address |
Holding Qty |
Holding (%) |
| 1 |
1D4wR9...CkGPYf |
1241.70K |
5.91% |
| 2 |
16G1xY...Vp9Wxh |
1019.01K |
4.85% |
| 3 |
bc1p7r...9pdee5 |
304.61K |
1.45% |
| 4 |
bc1pxl...jjjl6w |
255.43K |
1.21% |
| 5 |
35UMBc...57St14 |
218.70K |
1.04% |
| - |
Others |
17960.55K |
85.54% |
II. Core Factors Influencing AINN's Future Price
Technology Development and Ecosystem Construction
-
AI Infrastructure and Computing Power: The rapid development speed of AI globally depends on two main pillars: technological accumulation from previous years and recent computing power scarcity. As AI technology advances, particularly with improvements in large language models and algorithm optimization, computing infrastructure becomes increasingly critical to market performance.
-
Large Language Model Innovation: Advances in foundational AI models such as DeepSeek-R1, Qwen series, and other cutting-edge models demonstrate rapid technological progress. The development of more efficient architectures, including MoE (Mixture of Experts) for FFN sparsification, represents key innovations that enhance model scalability and performance efficiency.
-
Agentic AI Development: The transition from general-purpose AI tools to specialized enterprise-level agents marks a significant ecosystem shift. Agentic AI is moving from widespread adoption toward scalable business applications, with infrastructure frameworks being developed to support broader implementation. This technological evolution directly impacts market demand and adoption rates.
Macroeconomic Environment
-
Scale Economics and Market Expansion: AI's integration across industries creates substantial scale economy effects. The technology's universal applicability enables cross-scenario participation in human work processes, potentially increasing economic productivity and expanding market opportunities through both substitution and empowerment channels. This broad economic integration supports sustained demand for AI-related assets.
-
Investment Sentiment and Market Confidence: Price fluctuations are significantly influenced by macroeconomic trends, regulatory policies, and technology innovation. Investor sentiment and confidence play crucial roles in determining price movements, as market expectations regarding AI development trajectories directly affect valuation.
-
Commodity and Resource Demand: AI technology advancement drives increased demand for supporting infrastructure, including computing resources and materials. This indirect commodity demand reflects the depth of AI market penetration and serves as an indicator of sustained technological expansion.
Three. 2026-2031 AINN Price Forecast
2026 Outlook
- Conservative Forecast: $0.00329 - $0.00477
- Neutral Forecast: $0.00645
- Optimistic Forecast: $0.00677 (requires sustained market momentum and positive ecosystem developments)
2027-2029 Medium-term Outlook
- Market Stage Expectation: Gradual recovery and accumulation phase with increasing institutional interest and ecosystem expansion
- Price Range Forecast:
- 2027: $0.00476 - $0.00905
- 2028: $0.00462 - $0.01088
- 2029: $0.00655 - $0.01329
- Key Catalysts: Protocol upgrades, increased adoption of underlying technology, favorable regulatory environment, and growing DeFi integration
2030-2031 Long-term Outlook
- Base Case: $0.01076 - $0.01359 (assumes moderate market growth and steady technological advancement)
- Optimistic Case: $0.01359 - $0.01769 (assumes accelerated mainstream adoption and significant partnerships)
- Transformational Case: Above $0.01769 (extreme favorable conditions including breakthrough technological achievements and widespread institutional participation)
- 2031-12-31: AINN projects 93% cumulative appreciation potential (from current baseline through long-term development trajectory)
Trading and market analysis for AINN can be monitored through Gate.com and other major market data platforms to track real-time price movements and trading volumes.
| 年份 |
预测最高价 |
预测平均价格 |
预测最低价 |
涨跌幅 |
| 2026 |
0.00677 |
0.00645 |
0.00329 |
0 |
| 2027 |
0.00905 |
0.00661 |
0.00476 |
2 |
| 2028 |
0.01088 |
0.00783 |
0.00462 |
21 |
| 2029 |
0.01329 |
0.00936 |
0.00655 |
45 |
| 2030 |
0.01359 |
0.01132 |
0.01076 |
75 |
| 2031 |
0.01769 |
0.01246 |
0.00922 |
93 |
AINN Investment Analysis Report
IV. AINN Professional Investment Strategy and Risk Management
AINN Investment Methodology
(1) Long-term Holding Strategy
- Suitable for: Web3 believers and AI-focused investors with high risk tolerance
- Operational recommendations:
- Accumulate AINN during market downturns when prices dip below $0.01, as the project represents a structural consensus on Web3+AI integration
- Hold through market cycles without panic selling, given the project's near 100 ecosystem projects under development
- Dollar-cost averaging (DCA) strategy over 12-24 months to reduce timing risk
(2) Active Trading Strategy
- Technical analysis tools:
- Moving Average (MA): Use 20-day and 50-day MA crossovers to identify trend reversals, particularly relevant given AINN's -91.23% year-over-year decline
- Relative Strength Index (RSI): Monitor oversold conditions below 30 for potential entry points and overbought conditions above 70 for exits
- Wave operation key points:
- Take advantage of AINN's low current trading volume ($11,820 daily volume) which can amplify price swings
- Set profit targets at 20-30% gains and stop losses at -10% to manage volatility
AINN Risk Management Framework
(1) Asset Allocation Principles
- Conservative investors: 1-2% of total portfolio allocation
- Active investors: 3-5% of total portfolio allocation
- Professional investors: 5-10% of total portfolio allocation (with hedging strategies)
(2) Risk Hedging Solutions
- Position sizing: Limit single position size to prevent catastrophic losses from potential market corrections
- Portfolio diversification: Balance AINN holdings with other assets to mitigate concentration risk, particularly given AINN's market cap of only $135,387
(3) Secure Storage Solutions
- Hot wallet option: Gate.com Web3 wallet for frequent trading and ecosystem participation
- Self-custody approach: Transfer AINN to secure personal wallets for long-term holdings beyond 12 months
- Security considerations: Never share private keys, enable two-factor authentication on all exchange accounts, and verify smart contract addresses on official channels before transfers
V. AINN Potential Risks and Challenges
AINN Market Risks
- Extreme price volatility: AINN has experienced an 91.23% decline over one year with current trading volume of only $11,820 daily, indicating severe liquidity constraints and susceptibility to manipulation
- Speculative nature: As a BRC20 inscription project, AINN lacks traditional utility backing, relying primarily on community sentiment and narrative momentum
- Small market capitalization: With a fully diluted valuation of $135,387, AINN is highly vulnerable to whale accumulation, sudden exits, and market sentiment shifts
AINN Regulatory Risks
- Regulatory uncertainty: BRC20 tokens face evolving regulatory frameworks globally, with potential restrictions on inscription-based assets
- Compliance challenges: Different jurisdictions may impose varying restrictions on trading and holding BRC20 tokens without clear regulatory guidelines
- Future restriction potential: Governments may implement stricter controls on Bitcoin Layer 1 activity, affecting AINN's operational foundation
AINN Technical Risks
- BRC20 protocol limitations: AINN operates on BRC20 protocol which has lower transaction throughput compared to Layer 2 solutions, potentially limiting ecosystem scalability
- Smart contract vulnerabilities: While AINN itself is a leaderless inscription, ecosystem projects built around it may contain code vulnerabilities that could impact token value
- Network dependency: AINN's viability depends entirely on Bitcoin network security and continued support for inscription technology
VI. Conclusion and Action Recommendations
AINN Investment Value Assessment
AINN represents a speculative bet on the convergence of Web3 and AI technologies through the BRC20 inscription mechanism. The project demonstrates strong community organization with approximately 20,986 active holders and near 100 ecosystem projects in development. However, the extreme price decline of 91.23% year-over-year, minimal market capitalization of $135,387, and low daily trading volume suggest significant downside risks outweigh potential upside opportunities for most retail investors. Long-term value depends critically on ecosystem adoption and sustained community engagement.
AINN Investment Recommendations
✅ Beginners: Start with minimal exposure (0.5-1% of trading capital) through Gate.com's spot trading platform, treating AINN as a high-risk speculation rather than core holding
✅ Experienced investors: Consider 2-5% allocation with disciplined stop losses at -15% and profit targets at +30-50%, utilizing technical analysis to time entries during oversold conditions
✅ Institutional investors: Avoid until liquidity metrics improve substantially; if interested, implement structured positions with comprehensive hedging and position limits below 5% of fund AUM
AINN Trading Participation Methods
- Direct spot trading: Purchase AINN directly on Gate.com using Bitcoin or stablecoins through the BTC-BRC trading pair
- Ecosystem engagement: Participate in ecosystem projects building on AINN to gain exposure to Web3+AI narrative
- Community participation: Engage with the AINN community across social channels (Twitter: @AINN_BRC20) to stay informed on project developments
Cryptocurrency investments carry extreme risk. This report is for informational purposes only and does not constitute investment advice. Investors should make decisions based on their individual risk tolerance and should consult with professional financial advisors. Never invest more than you can afford to lose completely.
FAQ
What is the historical price trend of AINN? What is the price change over the past year?
AINN has experienced significant volatility over the past year. Currently trading at $0.006443 USD, the token showed a +0.03% change in the last 24 hours with a 24-hour trading volume of $14,446.10 USD.
What are the main factors affecting AINN price?
AINN price is primarily influenced by supply and demand dynamics, market sentiment, regulatory developments, institutional adoption rates, and macroeconomic trends. These factors collectively drive price movements and long-term value.
How to analyze and predict the future price trend of AINN?
Analyze AINN price through technical indicators like moving averages, RSI, and support/resistance levels. Monitor trading volume, market sentiment, and blockchain metrics. Compare with Bitcoin's growth patterns and global capital flows. Use chart patterns to identify trend direction and potential breakout points for price forecasting.
AINN advantages: efficient transactions, secure blockchain technology, and lower costs. Disadvantages: smaller market presence and less brand recognition compared to major AI tokens in the market.
What risks exist in investing in AINN? How should they be avoided?
AINN investment involves market volatility, regulatory changes, and liquidity risks. Mitigate by diversifying your portfolio, conducting thorough research, investing only disposable capital, and staying updated on market developments and project fundamentals.
What are professional analysts' price predictions and target prices for AINN?
Professional analysts set an average price target of $54.67 for AINN with a moderate sell consensus. This analysis is based on current market data as of January 2, 2026.
* The information is not intended to be and does not constitute financial advice or any other recommendation of any sort offered or endorsed by Gate.