# Article Introduction
**ARTFI 2025 Price Prediction: Comprehensive Analysis and Market Outlook**
This comprehensive analysis examines ARTFI's market dynamics, price trajectories, and investment opportunities through 2031. Explore ARTFI's historical performance—from its $0.086 peak in June 2024 to current levels near $0.0015—and discover data-driven price forecasts across conservative, base, and optimistic scenarios. The guide provides actionable investment strategies for beginners, experienced traders, and institutional investors, alongside critical risk assessments for this emerging art-tech asset. Whether you're evaluating ARTFI tokenomics, analyzing holder distribution on Gate, or developing portfolio allocation strategies, this article delivers the insights needed to make informed Web3 investment decisions in the fractional art ownership sector.
Introduction: ARTFI's Market Position and Investment Value
Artfi (ARTFI) is an art-technology company dedicated to democratizing the $1.7 trillion fine art market through NFT and blockchain technology. Since its launch in June 2024, Artfi has established itself as a pioneering Web3 solution for fractionalizing blue-chip artworks, enabling collectors worldwide to collectively own stakes in valuable art pieces. As of January 2, 2026, ARTFI has a market capitalization of approximately $178,339.70, with a circulating supply of 121.9 million tokens trading at around $0.001463 per token.
This innovative tokenization platform represents a defining trend in real-world asset representation on the blockchain, positioning itself at the forefront of the asset tokenization movement that is expected to reshape the investment landscape over the coming decade.
This article will provide a comprehensive analysis of ARTFI's price trends and market dynamics through 2031, examining historical price patterns, market liquidity, ecosystem development, and macroeconomic factors to deliver professional price forecasts and actionable investment strategies for both institutional and retail investors seeking exposure to the art-tech sector.
ARTFI Market Analysis Report
I. ARTFI Price History Review and Current Market Status
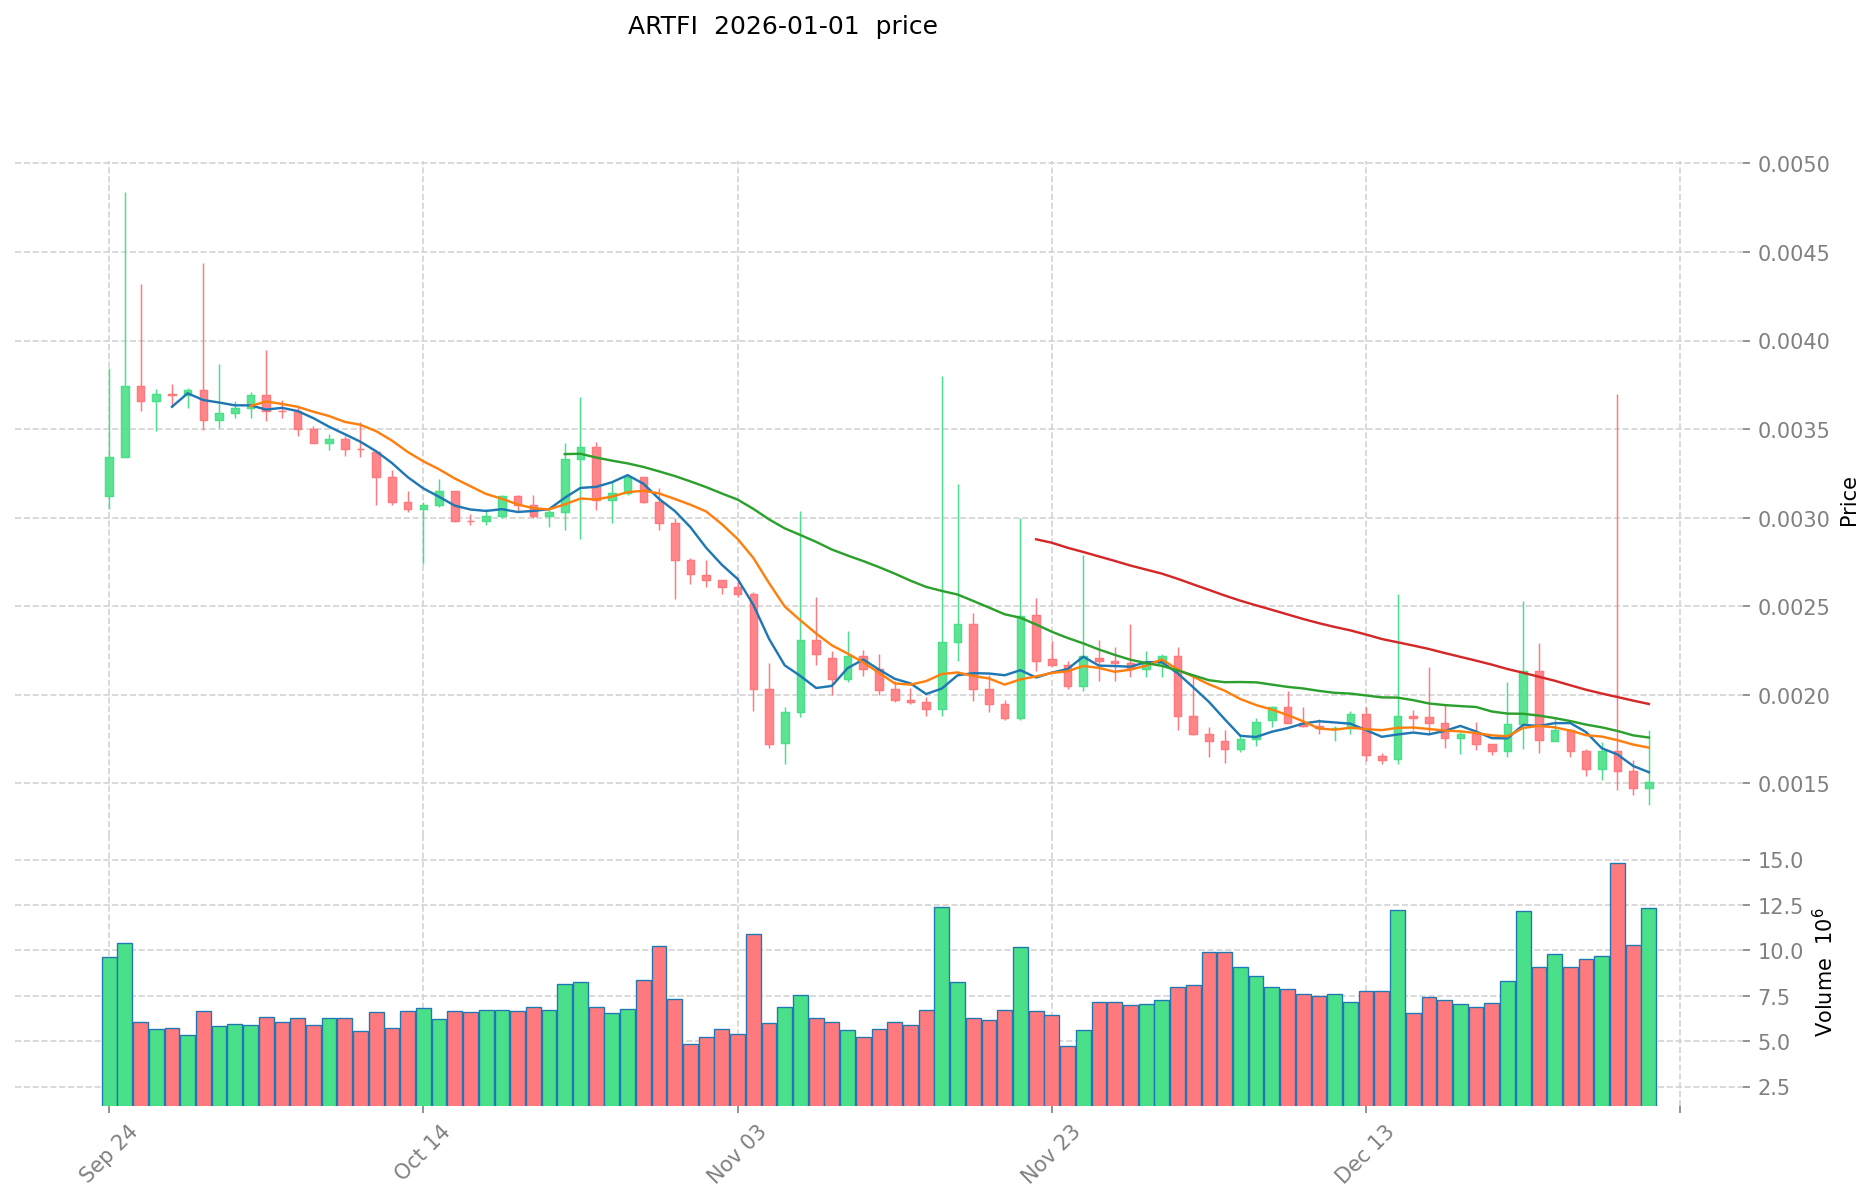
ARTFI Historical Price Movement Trajectory
- June 2024: ARTFI reached its all-time high of $0.08599 on June 17, 2024, marking the peak of early market enthusiasm following the token's launch.
- 2024-2026: The token experienced significant depreciation, declining approximately 89.5% over the one-year period from its historical high.
- December 2025: ARTFI touched its all-time low of $0.001375, representing the bottom of the bear cycle.
ARTFI Current Market Condition
As of January 2, 2026, ARTFI is trading at $0.001463, reflecting the token's position near its historical lows. The 24-hour trading volume stands at $15,693.80, with the token experiencing a 5.15% decline over the past 24 hours. Over the 7-day period, ARTFI has depreciated 19.28%, while the 30-day decline measured 18.37%.
The token currently holds a market capitalization of $178,339.70 with a fully diluted valuation of $1,463,000. The circulating supply comprises 121.9 million tokens out of a maximum supply of 1 billion ARTFI tokens, representing a circulation ratio of 12.19%. The project maintains 154,053 active token holders across the network.
ARTFI maintains listings on 2 cryptocurrency exchanges and demonstrates a market dominance of 0.000046%. The token operates on the SUI blockchain network and was published at an initial price of $0.03 on June 16, 2024.
Current market sentiment indicators suggest extreme fear, reflecting broader market conditions as of January 1, 2026.
View current ARTFI market price
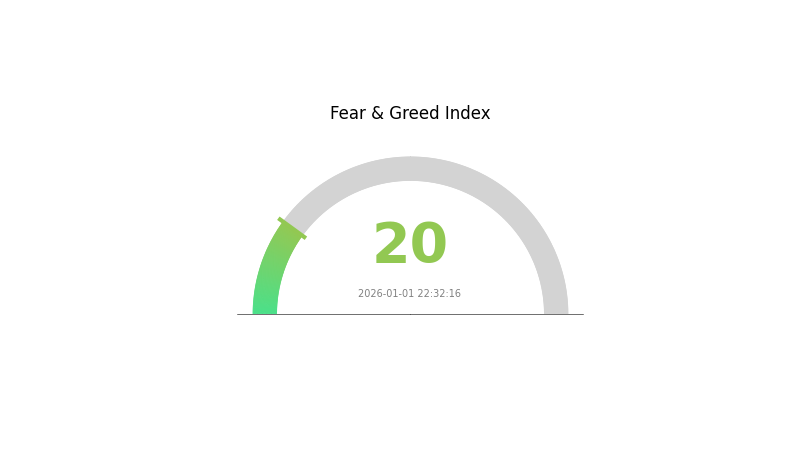
ARTFI Market Sentiment Index
2026-01-01 Fear and Greed Index: 20 (Extreme Fear)
Click to view the current Fear & Greed Index
The crypto market is currently experiencing extreme fear, with the Fear and Greed Index dropping to 20. This indicates significant market pessimism and heightened investor anxiety. During such periods, the market tends to be highly volatile as traders reassess their positions. Experienced investors often view extreme fear as a potential opportunity to accumulate assets at lower prices, while risk-averse investors may prefer to wait for more stable market conditions. Monitor Gate.com's real-time data to stay informed about market dynamics and make well-informed investment decisions.
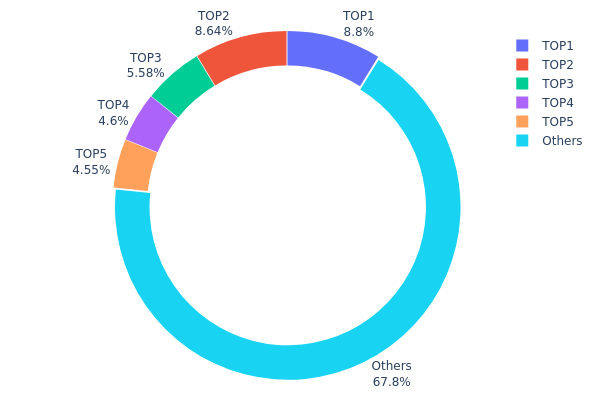
ARTFI Holding Distribution
The address holding distribution map illustrates the concentration of token ownership across different wallet addresses on the blockchain. This metric serves as a critical indicator for assessing the decentralization level and potential market concentration risks of a cryptocurrency asset. By analyzing the top holders and the distribution of remaining addresses, investors and analysts can evaluate the token's vulnerability to price manipulation and the stability of its on-chain structure.
ARTFI currently demonstrates a relatively moderate concentration profile, with the top five addresses collectively controlling approximately 32.16% of the total supply. The largest holder accounts for 8.80% of circulating tokens, while the second-largest holds 8.64%, indicating that no single entity possesses overwhelming dominance. The third through fifth largest holders maintain positions between 4.55% and 5.57%, suggesting a gradual distribution curve rather than extreme concentration among a handful of addresses. Notably, the dispersed holder category ("Others") represents 67.84% of the token supply, distributed across numerous addresses beyond the top five, which indicates substantial retail participation and a relatively healthy decentralization framework.
This distribution pattern reflects a market structure characterized by balanced ownership dynamics. The absence of extreme concentration among top addresses reduces the likelihood of coordinated price manipulation or sudden large-scale liquidation events that could destabilize the market. The significant proportion held by scattered addresses suggests active community engagement and organic token distribution. However, continuous monitoring of the top addresses' on-chain activities remains essential, as any significant movement or consolidation among major holders could materially impact ARTFI's price discovery mechanism and overall market sentiment.
Click to view current ARTFI Holding Distribution
| Top |
Address |
Holding Qty |
Holding (%) |
| 1 |
0xc77c...34ff81 |
88000.00K |
8.80% |
| 2 |
0xb592...437a75 |
86400.00K |
8.64% |
| 3 |
0x13c0...e24c6d |
55799.81K |
5.57% |
| 4 |
0x8a7d...c1297e |
46044.24K |
4.60% |
| 5 |
0x5747...9b4dee |
45500.00K |
4.55% |
| - |
Others |
678255.95K |
67.84% |
II. Core Factors Influencing ARTFI's Future Price
Market Sentiment and Investor Confidence
- Investor Sentiment: Investor emotions and confidence directly drive ARTFI price movements. Positive news regarding ARTFI application expansion or technological breakthroughs typically promotes price increases.
- Current Impact: Market sentiment remains a key short-term driver for ARTFI price fluctuations. Regulatory dynamics, market competition, and overall cryptocurrency market conditions significantly influence actual price performance.
Macroeconomic Environment
- Monetary Policy Influence: Major central bank policy expectations and global liquidity conditions affect cryptocurrency valuations, including ARTFI.
- Geopolitical Factors: International developments and market risk sentiment can trigger broader cryptocurrency market movements that impact ARTFI pricing.
III. 2026-2031 ARTFI Price Forecast
2026 Outlook
- Conservative Forecast: $0.00111-$0.00147
- Base Case Forecast: $0.00147
- Optimistic Forecast: $0.0021 (requires sustained market demand and positive ecosystem developments)
2027-2029 Mid-term Outlook
- Market Stage Expectation: Gradual recovery and growth phase with increasing adoption momentum
- Price Range Predictions:
- 2027: $0.00098-$0.00255
- 2028: $0.00115-$0.00242
- 2029: $0.00163-$0.00323
- Key Catalysts: Protocol upgrades, expanding use cases, improved market liquidity on platforms like Gate.com, and growing institutional interest in the asset class
2030-2031 Long-term Outlook
- Base Case Scenario: $0.00160-$0.00304 (assuming moderate adoption acceleration and market maturation)
- Optimistic Scenario: $0.00276-$0.00334 (with strong ecosystem expansion and mainstream integration)
- Transformative Scenario: $0.00334+ (extreme favorable conditions including regulatory clarity, major partnership announcements, and significant technological breakthroughs)
- 2031-12-31: ARTFI $0.00334 (approaching peak of forecast range with cumulative 98% appreciation from 2026 baseline)
| 年份 |
预测最高价 |
预测平均价格 |
预测最低价 |
涨跌幅 |
| 2026 |
0.0021 |
0.00147 |
0.00111 |
0 |
| 2027 |
0.00255 |
0.00178 |
0.00098 |
21 |
| 2028 |
0.00242 |
0.00216 |
0.00115 |
47 |
| 2029 |
0.00323 |
0.00229 |
0.00163 |
56 |
| 2030 |
0.00304 |
0.00276 |
0.0016 |
88 |
| 2031 |
0.00334 |
0.0029 |
0.00276 |
98 |
ARTFI Professional Investment Strategy and Risk Management Report
IV. ARTFI Professional Investment Strategy and Risk Management
ARTFI Investment Methodology
(1) Long-Term Holding Strategy
- Target Investors: Art market enthusiasts, diversification-seeking collectors, and blockchain technology believers with medium to long-term investment horizons
- Operational Recommendations:
- Accumulate during market downturns: Given ARTFI's 89.5% decline over the past year, dollar-cost averaging during depressed price levels may reduce average acquisition costs
- Hold through market cycles: The fractional art ownership model represents an emerging Web3 trend; patience through volatility cycles is essential
- Secure storage on Gate Web3 Wallet: Maintain custody of ARTFI tokens in a dedicated digital wallet with proper security protocols and backup seed phrases
(2) Active Trading Strategy
ARTFI Risk Management Framework
(1) Asset Allocation Principles
- Conservative Investors: 0.5-1% portfolio allocation (speculative position sizing only)
- Active Investors: 1-3% portfolio allocation (monitored positions with defined stop-losses)
- Professional Investors: 3-5% allocation (with structured hedging and rebalancing protocols)
(2) Risk Hedging Solutions
- Portfolio diversification: Balance ARTFI exposure with established blue-chip cryptocurrencies to reduce concentration risk
- Position sizing: Maintain strict position limits given ARTFI's thin liquidity (only 2 exchange listings) and early-stage status
(3) Secure Storage Solutions
- Custodial Approach: Gate Web3 wallet for active traders requiring frequent transactions and ease of access
- Security Best Practices:
- Enable multi-factor authentication on all exchange and wallet accounts
- Maintain offline backup copies of wallet recovery phrases in secure locations
- Never share private keys or seed phrases with any third party
V. ARTFI Potential Risks and Challenges
ARTFI Market Risks
- Extreme price volatility: ARTFI has declined 89.5% year-over-year from $0.03 launch price to current $0.001463, exposing investors to substantial drawdown potential
- Limited liquidity: With presence on only 2 exchanges and 24-hour volume of approximately $15,693, large position exits may face significant slippage
- Early-stage project uncertainty: The fractional fine art market remains largely unproven at scale, with uncertain demand elasticity for NFT-based art fractions
ARTFI Regulatory Risks
- NFT classification ambiguity: Regulatory bodies globally have not established clear frameworks for NFT-based art fractionalization, creating potential future compliance challenges
- Securities law exposure: Depending on jurisdiction, offering fractional ownership in physical artworks tokenized as NFTs may face classification as unregistered securities
- Market manipulation concerns: Low trading volume and thin order books may create vulnerability to price manipulation in decentralized or lightly regulated venues
ARTFI Technology Risks
- Smart contract vulnerabilities: As a SUI-based token, ARTFI depends on the underlying protocol's security; any critical vulnerabilities in SUI infrastructure could impact token viability
- Custody and physical asset risk: The real-world art stored as collateral for fractional NFTs faces insurance, authentication, and custody risks outside blockchain control
- Blockchain dependency: Network congestion or SUI chain failures would directly impair trading and settlement capabilities
VI. Conclusion and Action Plan
ARTFI Investment Value Assessment
Artfi represents an emerging attempt to democratize the $1.7 trillion fine art market through blockchain fractional ownership. While the underlying concept of real-world asset tokenization aligns with long-term Web3 trends, the project remains highly speculative and early-stage. The 89.5% annual decline suggests significant market skepticism regarding current valuation, execution capability, or product-market fit. Investors should view ARTFI as a venture-stage opportunity with correspondingly high risk of total capital loss.
ARTFI Investment Recommendations
✅ Beginners: Allocate only 0.5-1% of portfolio as speculative exposure; prioritize learning about fractional art mechanisms before committing capital. Use only risk capital you can afford to lose entirely.
✅ Experienced Investors: Deploy 1-3% allocations with defined stop-loss levels (e.g., 50% from entry point) and exit targets. Monitor holder growth, exchange listings, and blue-chip artwork onboarding metrics as key performance indicators.
✅ Institutional Investors: Consider 3-5% thematic allocations within Web3/tokenized-asset mandates, applying rigorous due diligence on Artfi's art custody infrastructure, legal compliance roadmap, and market adoption trajectory. Engage with project team directly on regulatory pathway clarity.
ARTFI Trading Participation Methods
- Direct Purchase on Gate.com: Access ARTFI trading pairs directly through Gate.com, leveraging established liquidity and security protocols
- Limit Order Strategy: Place limit buy orders at technical support levels to achieve favorable entry prices given price volatility
- Dollar-Cost Averaging: Implement systematic weekly or monthly purchases regardless of price to reduce timing risk
Cryptocurrency investment carries extreme risk. This report does not constitute investment advice. Investors should make decisions based on personal risk tolerance and consult professional financial advisors. Never invest more capital than you can afford to lose completely.
FAQ
What is ARTFI's historical price trend?
ARTFI's price was ¥0.013095 on January 1, 2026, down 0.27% from the previous day. The 24-hour high reached ¥0.013568 and the low was ¥0.012968, with a 24-hour trading volume of ¥288,500.
What are the main factors affecting ARTFI price?
Market sentiment, trading volume, adoption trends, technological developments, and overall crypto market conditions directly impact ARTFI price movements. Investor confidence and major announcements also play significant roles in price fluctuations.
What is the potential future price of ARTFI?
ARTFI has significant growth potential depending on market adoption and ecosystem development. While price predictions vary, some analysts suggest it could reach substantially higher levels as the platform expands. Long-term performance will depend on trading volume growth, technological upgrades, and mainstream adoption in the NFT and DeFi sectors.
ARTFI vs Other DeFi Tokens: Advantages and Disadvantages?
ARTFI offers superior governance mechanisms and lower transaction fees compared to competitors. However, it has smaller ecosystem scale and lower trading volume than established DeFi tokens like OP. ARTFI shows strong potential with innovative tokenomics, positioning it for significant 2026 growth.
What risks should I pay attention to when investing in ARTFI?
ARTFI investment involves market volatility and regulatory risks. Crypto markets are highly unstable. Conduct thorough research, monitor price movements closely, and only invest capital you can afford to lose.
ARTFI的技术基础和项目团队背景如何?
ARTFI leverages blockchain and NFT technology to democratize art ownership. The team has strong background with solid funding support, positioning the project well for growth in the RWA sector.
* The information is not intended to be and does not constitute financial advice or any other recommendation of any sort offered or endorsed by Gate.