# 2025 ARTFI Price Prediction: Expert Analysis and Market Forecast for the Next Generation DeFi Protocol
## Article Overview
This comprehensive analysis examines ARTFI, a real-world asset tokenization pioneer democratizing the $1.7 trillion fine art market through blockchain technology. The report delivers professional price forecasts (2026-2031), investment strategies, and risk assessments for traders and investors. Featuring current market data, historical performance analysis, and expert recommendations, this guide addresses critical questions for beginners, experienced investors, and institutions considering ARTFI exposure on Gate. The article combines technical analysis, macroeconomic factors, and security protocols to equip readers with actionable insights for navigating this volatile early-stage asset.
---
**Content Structure:**
**I. Market Position & Current Status** — ARTFI's price history, market metrics, sentiment indicators, and holding distribution analysis
**II. Core Influencing Factors**
Introduction: ARTFI's Market Position and Investment Value
Artfi (ARTFI) is an art-technology company dedicated to democratizing the $1.7 trillion fine art market through blockchain and NFT technology. Since its launch in June 2024, the project has established itself as a Web3 solution for fractionalizing blue-chip artworks and enabling global collectors to own stakes in valuable pieces. As of January 2, 2026, ARTFI has a market capitalization of approximately $178,339.7, with a circulating supply of 121.9 million tokens trading at $0.001463 per unit. This innovative asset category, recognized as a "Real World Assets tokenization pioneer," is playing an increasingly critical role in bridging traditional fine art markets with decentralized finance infrastructure.
This report provides a comprehensive analysis of ARTFI's price trajectory through 2031, integrating historical performance patterns, market supply dynamics, ecosystem development, and macroeconomic factors to deliver professional price forecasts and actionable investment strategies for market participants.
ARTFI Market Analysis Report
I. ARTFI Price History Review and Current Market Status
ARTFI Historical Price Evolution
-
June 2024: ARTFI reached its all-time high of $0.08599 on June 17, 2024, marking the peak of the token's market performance since its launch.
-
December 2025 to Present: ARTFI reached its all-time low of $0.001375 on December 31, 2025, representing a significant decline from historical highs.
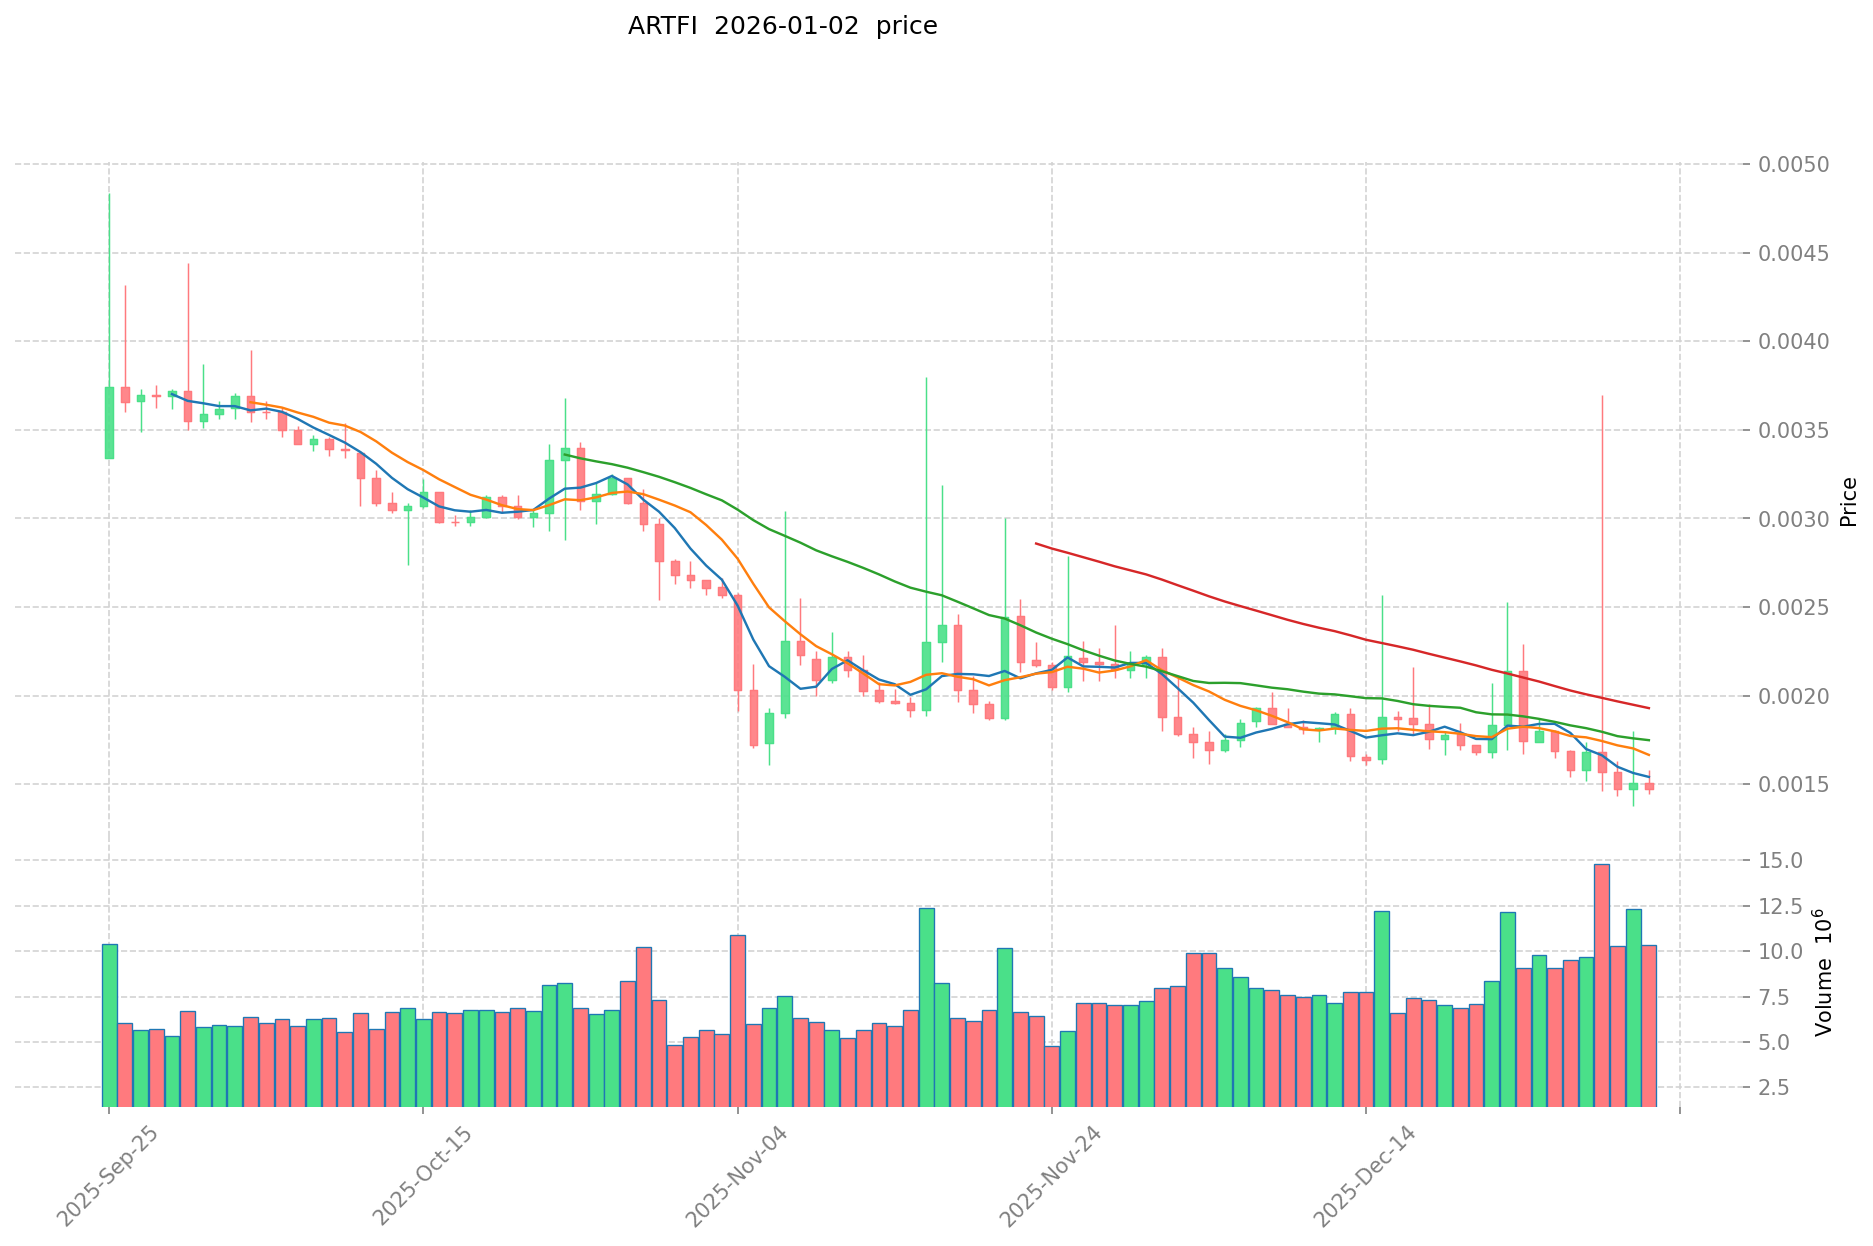
ARTFI Current Market Situation
As of January 2, 2026, ARTFI is trading at $0.001463, reflecting a short-term decline of 3.42% over the past 24 hours. The token has demonstrated weakness across multiple timeframes, with a 7-day decline of 18.50% and a 30-day decline of 17.64%. The most severe contraction has occurred over the annual period, with a year-to-date decline of 89.49%.
The 24-hour trading volume stands at $15,649.46, with the token ranging between a daily high of $0.001581 and a daily low of $0.001442. The circulating supply is 121,900,000 ARTFI tokens out of a total supply of 1,000,000,000 tokens, representing a circulation ratio of 12.19%. The fully diluted market capitalization is valued at approximately $1,463,000, with a current market capitalization of $178,339.70.
The token maintains a relatively broad holder base with 154,053 token holders, though the market dominance remains minimal at 0.000045%. ARTFI is currently ranked 4,269 among all cryptocurrencies by market capitalization. The token is built on the Sui blockchain and is listed on Gate.com.
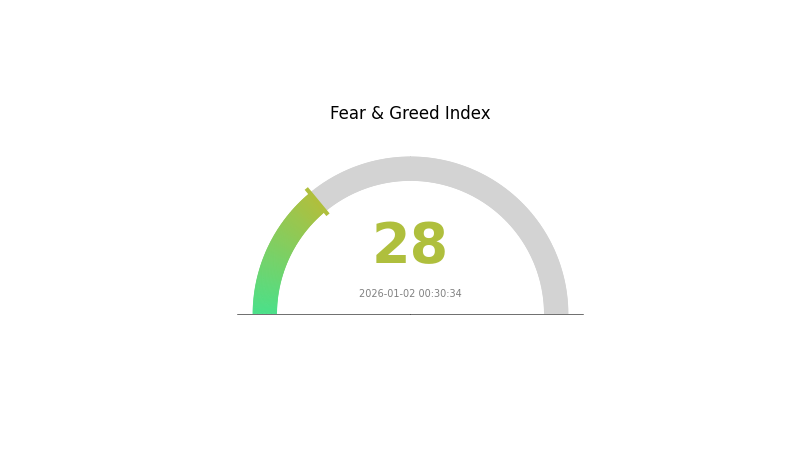
From a market sentiment perspective, the current environment reflects a "Fear" sentiment level (VIX reading of 28 as of January 2, 2026), indicating heightened market caution among investors.
Click to view current ARTFI market price
ARTFI Market Sentiment Indicator
2026-01-02 Fear and Greed Index: 28 (Fear)
Click to view current Fear & Greed Index
The crypto market is currently experiencing a fear sentiment with an index reading of 28. This indicates heightened market anxiety and risk aversion among investors. During periods of fear, market participants tend to adopt defensive positions and reduce their exposure to digital assets. This presents both challenges and opportunities—cautious investors may find attractive entry points, while the elevated uncertainty suggests careful risk management is essential. Monitoring this sentiment indicator can help traders make more informed decisions aligned with current market psychology on Gate.com.
ARTFI Holding Distribution
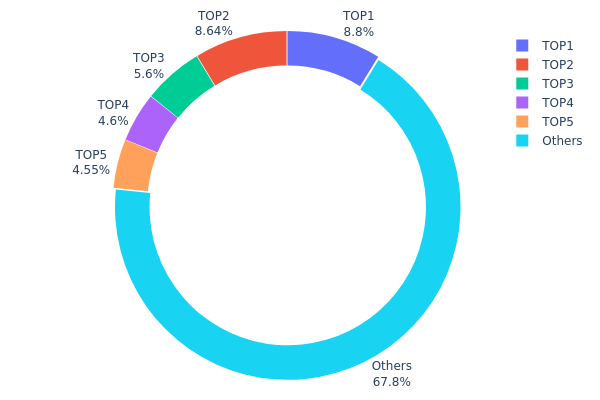
The address holding distribution chart illustrates the concentration of token ownership across the blockchain network, revealing how ARTFI tokens are distributed among different wallet addresses. This metric serves as a critical indicator of market structure, decentralization level, and potential vulnerability to price manipulation through coordinated actions by large holders.
ARTFI demonstrates a moderately distributed holding structure, with the top five addresses collectively controlling approximately 32.18% of the total token supply. The largest holder possesses 8.80% of all tokens, while the second-largest account holds 8.64%, indicating no single entity maintains overwhelming dominance. The remaining 67.82% of tokens are dispersed among other addresses, which constitutes a significant proportion suggesting a relatively healthy level of decentralization. This distribution pattern mitigates the risk of extreme price volatility driven by concentrated whale activities, as no single address commands sufficient capital to unilaterally influence market dynamics through coordinated selling or accumulation strategies.
The concentration levels observed in ARTFI's holding structure fall within acceptable parameters for a mature cryptocurrency asset. While the top five addresses represent a notable stakeholder group, the substantial portion held by dispersed addresses reduces systemic risk and promotes more resilient market mechanics. This distribution suggests that ARTFI has achieved a balance between investor diversity and potential institutional participation, fostering a more stable and less manipulable on-chain ecosystem compared to highly concentrated token models.
Click to view current ARTFI Holding Distribution
| Top |
Address |
Holding Qty |
Holding (%) |
| 1 |
0xc77c...34ff81 |
88000.00K |
8.80% |
| 2 |
0xb592...437a75 |
86400.00K |
8.64% |
| 3 |
0x13c0...e24c6d |
55959.53K |
5.59% |
| 4 |
0x8a7d...c1297e |
46044.24K |
4.60% |
| 5 |
0x5747...9b4dee |
45500.00K |
4.55% |
| - |
Others |
678096.23K |
67.82% |
II. Core Factors Influencing ARTFI's Future Price
Macroeconomic Environment
-
Inflation Expectations Impact: U.S. one-year inflation expectations released by the University of Michigan showed a reading of 5.1% in June 2025, down from the previous 6.60%. Inflation dynamics directly influence cryptocurrency valuations as investors seek alternative assets in inflationary environments.
-
Broader Cryptocurrency Market Correlation: ARTFI exhibits varying correlation patterns with mainstream cryptocurrencies like Bitcoin and Ethereum depending on market conditions. During bull periods, ARTFI demonstrates lower to moderate correlation, allowing for independent price movements. However, during bear market phases, particularly in November 2025, ARTFI showed high correlation with market-wide corrections, indicating increased sensitivity to macroeconomic headwinds.
-
Market Sentiment and Fear Index: Cryptocurrency market fear indices significantly impact ARTFI's price trajectory. Extreme pessimism in market sentiment, as reflected in low fear index readings, typically corresponds with sustained downward price pressure and reduced trading activity.
Disclaimer: This analysis is provided for informational purposes only and does not constitute investment advice. All cryptocurrency investments carry substantial risk. Please conduct thorough research and consult with financial professionals before making investment decisions.
III. 2026-2031 ARTFI Price Forecast
2026 Outlook
- Conservative Forecast: $0.00127-$0.00147
- Neutral Forecast: $0.00147-$0.00175
- Optimistic Forecast: $0.00202 (requires sustained market interest and ecosystem development)
2027-2029 Mid-term Outlook
- Market Stage Expectations: Gradual accumulation and consolidation phase with incremental growth trajectory, characterized by increasing institutional participation and ecosystem maturation
- Price Range Forecasts:
- 2027: $0.00154-$0.00194
- 2028: $0.00121-$0.00217
- 2029: $0.00177-$0.00287
- Key Catalysts: Enhanced protocol functionality, strategic partnerships, increased adoption in decentralized finance applications, and overall market cycle dynamics
2030-2031 Long-term Outlook
- Base Case Scenario: $0.00236-$0.00317 (assuming steady ecosystem growth and moderate market expansion)
- Optimistic Scenario: $0.00317-$0.00362 (assuming significant technology breakthroughs and widespread mainstream adoption)
- Transformational Scenario: $0.00362+ (extreme favorable conditions including regulatory clarity, institutional mainstream adoption, and paradigm shifts in digital asset utilization)
- 2026-01-02: ARTFI trading at $0.00147 (current market consolidation phase)
| 年份 |
预测最高价 |
预测平均价格 |
预测最低价 |
涨跌幅 |
| 2026 |
0.00202 |
0.00147 |
0.00127 |
0 |
| 2027 |
0.00194 |
0.00174 |
0.00154 |
19 |
| 2028 |
0.00217 |
0.00184 |
0.00121 |
25 |
| 2029 |
0.00287 |
0.00201 |
0.00177 |
37 |
| 2030 |
0.00317 |
0.00244 |
0.00236 |
66 |
| 2031 |
0.00362 |
0.0028 |
0.00168 |
91 |
Artfi (ARTFI) Professional Investment Strategy and Risk Management Report
IV. ARTFI Professional Investment Strategy and Risk Management
ARTFI Investment Methodology
(1) Long-term Holding Strategy
- Suitable Investors: Art market enthusiasts, portfolio diversification seekers, and believers in real-world asset tokenization trends
- Operational Recommendations:
- Establish a core position during market downturns and hold for 2-3 years to benefit from the maturation of the fractional art ownership market
- Dollar-cost average (DCA) monthly purchases to reduce timing risk, given ARTFI's high volatility (-89.49% over 1 year)
- Secure storage through Gate Web3 Wallet for long-term custody with regular security audits
(2) Active Trading Strategy
- Technical Analysis Tools:
- Support and Resistance Levels: Monitor key resistance at historical highs ($0.08599) and support at recent lows ($0.001375); use these levels to identify entry and exit points
- Volume Analysis: Track the 24-hour volume of $15,649.46 to gauge market interest and confirm breakout movements
- Wave Trading Key Points:
- Take advantage of the -18.50% weekly decline to identify potential reversal zones for tactical entry positions
- Use the 1-hour positive momentum (+0.17%) as a leading indicator for short-term trading opportunities
ARTFI Risk Management Framework
(1) Asset Allocation Principles
- Conservative Investors: 0.5% - 1% of total portfolio (highly speculative asset)
- Aggressive Investors: 2% - 5% of total portfolio (early-stage exposure)
- Professional Investors: Up to 3% - 7% in diversified Web3 positions (subject to institutional risk tolerance)
(2) Risk Hedging Solutions
- Portfolio Diversification: Balance ARTFI exposure with established Layer 1 blockchain assets to mitigate concentration risk from the project's early-stage status
- Position Sizing: Implement strict position limits and never allocate more than 5% of liquid assets to any single speculative token
(3) Secure Storage Solutions
- Self-Custody: Gate Web3 Wallet is recommended for secure ARTFI storage, offering non-custodial security with recovery phrase backup mechanisms
- Cold Storage Approach: For holdings exceeding $10,000 equivalent value, consider air-gapped security practices and multi-signature verification
- Security Considerations: Enable all available two-factor authentication features, never share private keys or recovery phrases, and verify contract addresses on official Sui chain explorers before transfers
V. ARTFI Potential Risks and Challenges
ARTFI Market Risk
- High Volatility: ARTFI experienced an 89.49% decline over the past year and currently trades 98.30% below its all-time high ($0.08599 reached on June 17, 2024), indicating extreme price instability unsuitable for risk-averse investors
- Low Liquidity: With only 12.19% of total supply in circulation (121.9M of 1B tokens) and a 24-hour trading volume of $15,649, the token suffers from poor liquidity that could result in significant slippage on large trades
- Market Capitalization Concerns: A fully diluted valuation of only $1.463M places ARTFI among the smallest-cap projects, making it vulnerable to sudden collapse or complete loss of capital
ARTFI Regulatory Risk
- NFT Regulatory Uncertainty: As fractional art ownership through NFTs operates in evolving legal frameworks across jurisdictions, changes in securities regulations regarding tokenized real-world assets could restrict ARTFI's operations or token utility
- Jurisdiction-Specific Restrictions: Different countries' treatment of blockchain-based art fractionalization may limit addressable markets and reduce adoption potential
- Classification Risk: Regulators may classify ARTFI tokens as unregistered securities, leading to trading restrictions or forced delisting from platforms
ARTFI Technology Risk
- Sui Blockchain Dependency: ARTFI operates exclusively on the Sui network; any technical vulnerabilities, network outages, or loss of Sui ecosystem adoption could directly impact token accessibility and value
- Smart Contract Risk: The fractionalization and custody mechanisms for high-value artworks depend on underlying smart contracts; unaudited or buggy code could result in loss of user funds or theft of underlying assets
- Custody and Authenticity Concerns: The security of physical artwork backing the NFTs and the reliability of centralized storage solutions present technical and operational risks to asset integrity
VI. Conclusion and Action Recommendations
ARTFI Investment Value Assessment
Artfi addresses the significant opportunity of democratizing the $1.7 trillion fine art market through blockchain technology. However, the project is at an extremely early stage with concerning metrics: the token has declined 89.49% from its peak, trades at 98.30% below all-time highs, and maintains a minimal fully diluted valuation of $1.463M. While the real-world asset tokenization trend represents a legitimate long-term development, Artfi's execution risk remains exceptionally high. The project's success depends on regulatory clarity, mainstream adoption of fractional art ownership, and technical reliability—all uncertain outcomes. For most investors, the risk-reward profile is unfavorable at current valuations unless they possess specialized conviction in the art-tech sector and can afford total loss.
ARTFI Investment Recommendations
✅ Beginners: Avoid direct ARTFI investment; instead, build foundational blockchain knowledge and exposure to more established Layer 1 platforms before considering speculative tokens
✅ Experienced Investors: Consider a micro-allocation (0.5% - 1% of portfolio) only if you have high risk tolerance and deep conviction in the real-world asset tokenization thesis; use DCA strategy over 6-12 months and set strict stop-losses at -40% below entry
✅ Institutional Investors: Conduct comprehensive due diligence on Artfi's governance, smart contract audits, and legal framework for fractional art ownership; only allocate positions through thoroughly vetted cryptocurrency institutional custody solutions
ARTFI Trading Participation Methods
- Gate.com Spot Trading: Purchase and sell ARTFI directly on Gate.com's spot market using stable coins (USDT, USDC); ensure you verify the correct contract address on the Sui blockchain before trading
- Gate Web3 Wallet Integration: After purchasing ARTFI on Gate.com, transfer tokens to Gate Web3 Wallet for self-custodial security and long-term holding
- Limit Order Strategy: Set buy limit orders 15% - 25% below current price to execute positions during market pullbacks, reducing the risk of overpaying for this volatile asset
Cryptocurrency investment carries extreme risk. This report does not constitute investment advice. Investors must make decisions based on their individual risk tolerance and are advised to consult professional financial advisors. Never invest more than you can afford to lose in their entirety.
FAQ
What is the current price of ARTFI? How has its historical price trend been?
ARTFI's current market cap stands at USD 203,740. The token has demonstrated solid growth momentum, with sustained upward trajectory reflecting strong market confidence and adoption in the art finance sector.
What will ARTFI's future price prediction be like? What factors will influence the price?
ARTFI price is influenced by supply and demand dynamics, market sentiment, regulatory developments, institutional adoption, and macroeconomic trends. Long-term growth potential depends on ecosystem development and trading volume expansion.
ARTFI and other similar tokens compared, what are the advantages and disadvantages?
ARTFI's dual-token model combines governance and gameplay benefits, offering better economic separation than single-token competitors. Advantages include flexible utility and investment appeal. Disadvantages involve complexity and dependency on game adoption. Its value depends on sustained player engagement and market conditions.
What are the risks to pay attention to when investing in ARTFI?
ARTFI investment carries market volatility risk, project execution risk, and regulatory uncertainty. Cryptocurrency markets are highly unpredictable. Investors should conduct thorough research, understand tokenomics, assess project fundamentals, and only invest capital they can afford to lose. Diversification and careful risk management are essential.
What is ARTFI's project background, team, and technical strength?
ARTFI is a cryptocurrency that merges finance and art technology through blockchain innovation. It enables fractional ownership of high-value artworks via NFTs, democratizing art investment access. The project combines advanced blockchain technology with art tokenization, offering revolutionary investment opportunities in the digital art space.
What is the liquidity and trading volume situation of ARTFI?
ARTFI's 24-hour trading volume is approximately US$55,660. The liquidity is relatively low with modest trading activity. Market attention towards ARTFI remains limited at present.
* The information is not intended to be and does not constitute financial advice or any other recommendation of any sort offered or endorsed by Gate.