This article provides an expert analysis and market outlook for Cross The Ages (CTA) in 2025, examining its price trajectory, token economics, and macroeconomic factors. Key topics include CTA’s historical price performance, current market status, and projected price forecasts for 2025-2030. It addresses investment strategies, risks, and ecosystem architecture, aimed at investors interested in gaming-focused digital assets. By understanding CTA's market dynamics and performance analysis, readers can make informed investment decisions using tools from Gate. Optimized for quick comprehension, the article is essential for anyone considering exposure to CTA.
Introduction: CTA's Market Position and Investment Value
Cross The Ages (CTA) is a utility token powering a free-to-play gaming ecosystem built on NFT-based digital trading cards. Since its launch in May 2024, CTA has established itself as a key component of an innovative gaming infrastructure that integrates blockchain technology with collectible card gameplay. As of December 22, 2025, CTA maintains a market capitalization of $7,885,000 with a circulating supply of 500 million tokens, trading at approximately $0.01577 per token. This token, recognized for its dual functionality in both in-game governance and on-chain activities, plays an increasingly vital role in the Cross The Ages gaming metaverse ecosystem.
This article provides a comprehensive analysis of CTA's price trajectory and market dynamics, examining historical performance patterns, token economics, ecosystem development, and macroeconomic factors influencing its valuation. The analysis aims to deliver professional price insights and actionable investment strategies for participants seeking exposure to this gaming-focused digital asset. Whether through Gate.com or other supported platforms, investors can access comprehensive market data and execution tools to inform their CTA investment decisions based on this forward-looking assessment.
Cross The Ages (CTA) Market Analysis Report
I. CTA Price History Review and Current Market Status
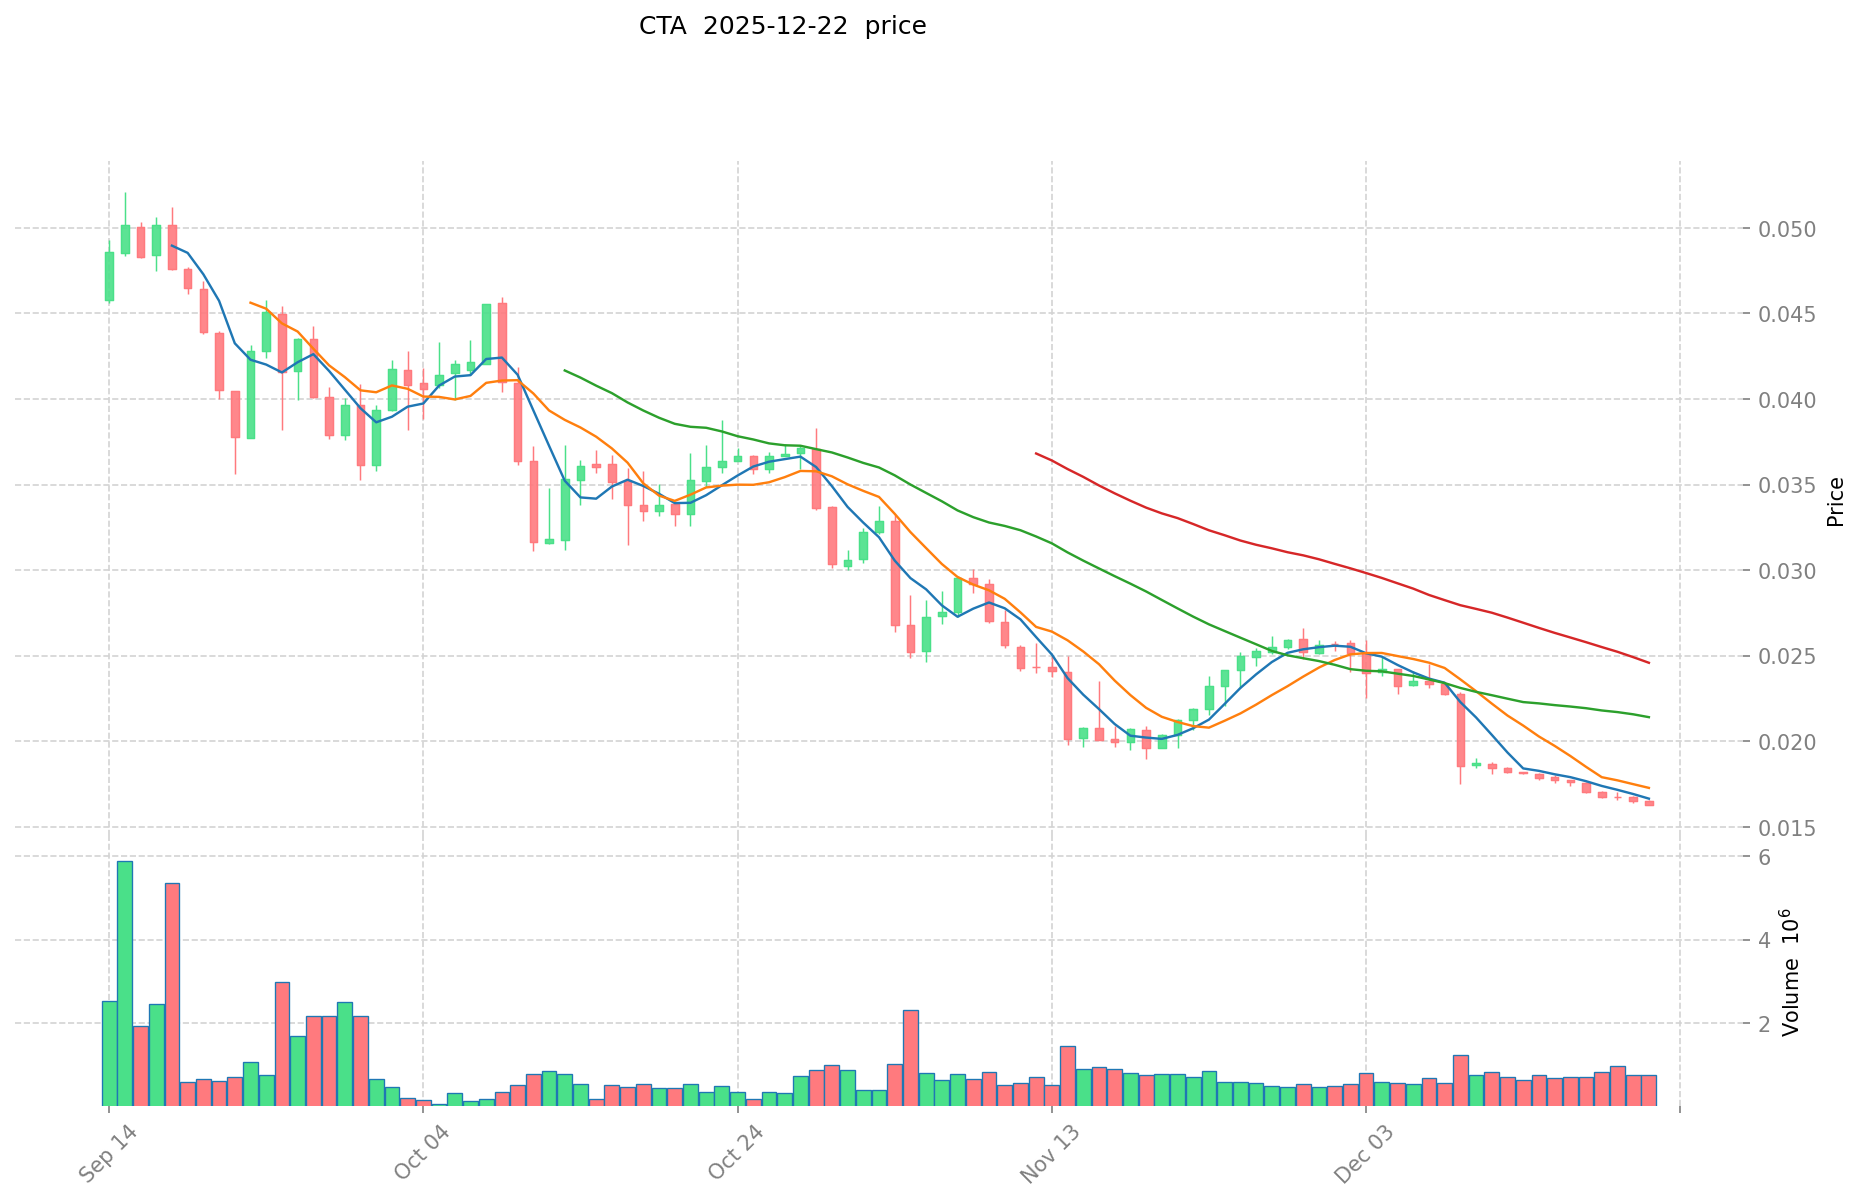
CTA Historical Price Evolution Trajectory
- May 2024: Project launch with initial price at $0.25, reaching an all-time high of $0.462 on May 17, 2024, representing a 84.8% increase from the launch price.
- Mid-2024 to Early 2025: Gradual price decline phase as market conditions shifted and the broader cryptocurrency market experienced volatility.
- February 2025: Price reached an all-time low of $0.01307 on February 3, 2025, marking a 71.7% decline from the all-time high.
CTA Current Market Situation
As of December 22, 2025, CTA is trading at $0.01577, reflecting a 24-hour decline of 3.78% and a 7-day decline of 11.55%. The token has experienced sustained downward pressure over the longer term, with a 30-day decline of 25.15% and a 1-year decline of 41.24%.
The current market capitalization stands at $7,885,000, with a circulating supply of 500,000,000 tokens (100% of total supply). The 24-hour trading volume is $12,863.58, indicating moderate liquidity. CTA currently ranks 1,304 by market capitalization, demonstrating a relatively small position within the broader cryptocurrency ecosystem with a market dominance of 0.00024%.
The token maintains 2,657 token holders across the Ethereum blockchain, where it operates as an ERC20 token. Current market sentiment reflects extreme fear (VIX: 25), which may contribute to the prevailing downward price pressure.
Check current CTA market price
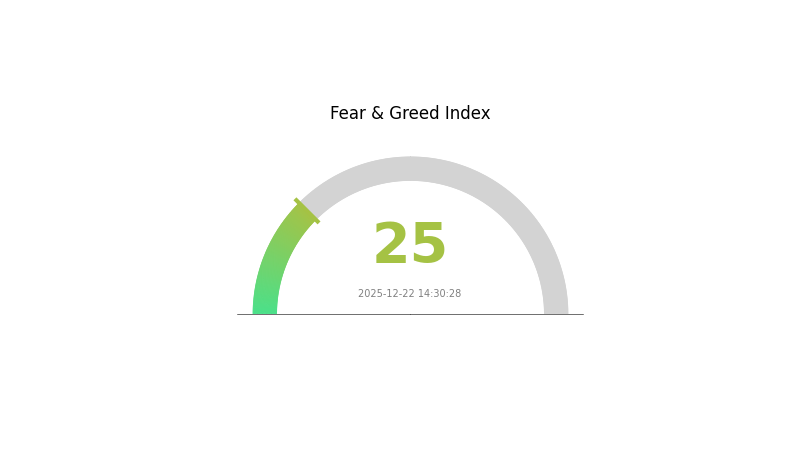
CTA Market Sentiment Index
2025-12-22 Fear and Greed Index: 25 (Extreme Fear)
Click to view current Fear & Greed Index
The cryptocurrency market is experiencing extreme fear, with the Fear and Greed Index reaching 25. This indicates significant market pessimism and investor anxiety. During periods of extreme fear, risk-averse investors typically reduce positions, while contrarian traders may identify potential buying opportunities. Market volatility remains elevated as investors digest macroeconomic concerns. On Gate.com, you can monitor real-time sentiment indicators and market data to make informed trading decisions during this volatile period.
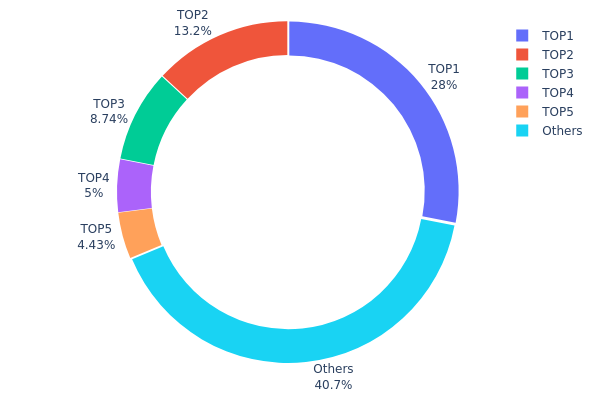
CTA Holdings Distribution
The address holdings distribution chart illustrates the concentration of token ownership across the top wallet addresses within the CTA ecosystem. By examining how the total token supply is distributed among individual addresses, this metric provides critical insights into the decentralization level, potential market manipulation risks, and the structural stability of the blockchain network. A concentration of holdings in fewer addresses typically suggests greater centralization risk, while a more dispersed distribution indicates a healthier, more resilient market structure.
Analysis of the current CTA holdings reveals a moderately concentrated distribution pattern. The top five addresses collectively control approximately 59.3% of the total token supply, with the leading address alone commanding 27.99% of all holdings. This level of concentration warrants attention, as the top address's significant stake represents a meaningful proportion of circulating tokens. However, the remaining 40.7% distributed among other addresses suggests that while concentration exists, it is not extreme. The distribution among the top five addresses shows a gradual decline, with holdings decreasing from 27.99% to 4.42%, indicating a relatively balanced hierarchy rather than extreme dominance by a single entity.
The current address distribution presents moderate implications for market dynamics. While the concentration does create potential vulnerability to large-scale asset movements that could trigger price volatility, the presence of a substantial "Others" category mitigates extreme centralization risk. This structure suggests that while early investors or major stakeholders maintain significant influence, the token has achieved reasonable dispersion. The market should monitor whether these large holders maintain positions or initiate liquidation events, as such movements could materially impact price stability. Overall, CTA exhibits a decentralization profile typical of established projects during their maturity phase, with sufficient distribution to support organic market activity while retaining stakeholder concentration consistent with development-stage token economics.
Click to view current CTA Holdings Distribution
| Top |
Address |
Holding Qty |
Holding (%) |
| 1 |
0x6522...837e90 |
139995.26K |
27.99% |
| 2 |
0xfb9c...d2717b |
65824.71K |
13.16% |
| 3 |
0x0d07...b492fe |
43708.45K |
8.74% |
| 4 |
0xac5c...33a87d |
24999.97K |
4.99% |
| 5 |
0xc882...84f071 |
22139.33K |
4.42% |
| - |
Others |
203332.28K |
40.7% |
II. Core Factors Affecting CTA's Future Price
Supply Mechanism
-
Supply and Demand Dynamics: Commodity prices are primarily influenced by supply and demand factors. Elements such as inventory levels, production volume, and consumption patterns are difficult to change in the short term, leading to strong trend characteristics in commodity prices. Once CTA funds successfully capture trends driven by supply-demand imbalances, they can generate significant returns.
-
Current Impact: Supply-demand imbalances in commodity markets create sustained price movements, which form the primary revenue source for CTA strategies through trend-following approaches.
Macroeconomic Environment
-
Manufacturing PMI Influence: The Manufacturing Purchasing Managers' Index reflects manufacturing activity and trends. When Manufacturing PMI is above 50% (indicating high economic growth), quantitative CTA strategies demonstrate superior performance with higher average returns, win rates, and stability. In high-prosperity environments, both trend-following and arbitrage strategies outperform compared to low-prosperity periods (PMI below 50%).
-
US Dollar Index Impact: The US Dollar Index measures the impact of overseas economic conditions and liquidity on commodity markets. When the dollar index is in a downtrend, overseas economic liquidity is released, benefiting high-risk assets. Since many important commodities are priced in US dollars, dollar depreciation translates to higher commodity prices. Conversely, when the dollar index is in an uptrend, liquidity tightens and risk-aversion sentiment increases, negatively affecting commodity markets. Quantitative trend strategies show significantly better performance when the dollar index is declining.
-
Geopolitical Factors: Historical events such as the Russia-Ukraine conflict, combined with factors like pandemic disruptions, Federal Reserve rate hikes, and economic recession concerns, have driven substantial price movements in commodity markets, creating opportunities for CTA strategies to capture significant trends.
-
Global Liquidity: Since 2020, large-scale overseas monetary expansion has influenced the pricing of many commodity varieties. This has resulted in increased commodity prices alongside amplified price volatility, creating favorable conditions for CTA strategy performance.
Three、2025-2030 CTA Price Forecast
2025 Outlook
- Conservative Forecast: $0.01123-$0.01581
- Neutral Forecast: $0.01581
- Bullish Forecast: $0.02213 (requires sustained market momentum and positive ecosystem developments)
2026-2028 Medium-term Outlook
- Market Stage Expectation: Potential recovery and consolidation phase with gradual upward trajectory as the crypto market matures and institutional adoption increases.
- Price Range Forecast:
- 2026: $0.01518-$0.02732 (20% projected increase)
- 2027: $0.02129-$0.02940 (46% projected increase)
- 2028: $0.01944-$0.02706 (66% projected increase)
- Key Catalysts: Enhanced protocol functionality, increased utility adoption, potential regulatory clarity, expansion of DeFi ecosystem integration, and growing investor confidence in digital asset markets.
2029-2030 Long-term Outlook
- Base Case: $0.01387-$0.03520 (69% projected increase by 2029), progressing to $0.02660-$0.03774 (96% projected increase by 2030) under steady ecosystem development and moderate market expansion.
- Bullish Case: $0.03520-$0.03774 (represents sustained growth trajectory with accelerated adoption and strengthened market fundamentals).
- Transformation Case: Potential breakthrough above $0.03774 (requires significant technological breakthroughs, mainstream institutional investment, major partnership announcements, or paradigm shifts in blockchain adoption).
- 2030-12-31: CTA projected near $0.03093 average valuation (mid-cycle stabilization phase with established market positioning).
| 年份 |
预测最高价 |
预测平均价格 |
预测最低价 |
涨跌幅 |
| 2025 |
0.02213 |
0.01581 |
0.01123 |
0 |
| 2026 |
0.02732 |
0.01897 |
0.01518 |
20 |
| 2027 |
0.0294 |
0.02315 |
0.02129 |
46 |
| 2028 |
0.02706 |
0.02627 |
0.01944 |
66 |
| 2029 |
0.0352 |
0.02666 |
0.01387 |
69 |
| 2030 |
0.03774 |
0.03093 |
0.0266 |
96 |
Cross The Ages (CTA) Professional Investment Analysis Report
I. Project Overview
Cross The Ages (CTA) is a free-to-play gaming platform featuring digital trading cards as non-fungible tokens (NFTs). The project combines traditional trading card gameplay with blockchain technology, creating an interconnected gaming ecosystem that bridges digital and physical collectibles.
| Metric |
Value |
| Current Price |
$0.01577 |
| Market Capitalization |
$7,885,000 |
| Circulating Supply |
500,000,000 CTA |
| Total Supply |
500,000,000 CTA |
| 24H Trading Volume |
$12,863.58 |
| Market Rank |
1304 |
| All-Time High |
$0.462 (May 17, 2024) |
| All-Time Low |
$0.01307 (February 3, 2025) |
| Token Holders |
2,657 |
| Contract Address |
0x90685e300a4c4532efcefe91202dfe1dfd572f47 (Ethereum) |
24-Hour Performance: -3.78%
7-Day Performance: -11.55%
30-Day Performance: -25.15%
1-Year Performance: -41.24%
The token has experienced significant depreciation from its all-time high of $0.462, representing a 96.6% decline. Currently trading near its all-time low, CTA faces considerable downward pressure.
II. Ecosystem Architecture & Tokenomics
Multi-Token Economy Design
1. Crystals (In-Game Soft Currency)
- Classification: Off-chain, stable token
- Primary Functions:
- In-game currency for all off-chain activities
- Purchase card packs and cosmetic skins
- Unlock booster packs
- Mint digital cards into NFTs
- Exchange Mechanism: Convertible to CTA tokens at current market rates through in-game marketplace
- Stability Characteristics: Designed as a stable asset to facilitate seamless gameplay
2. Gold (Secondary In-Game Currency)
- Classification: Off-chain, stable, non-tradeable token
- Primary Functions:
- Required for merging digital cards in-game
- Bot-defeating utility mechanism
- Ensures fair play for all players
- Non-tradeable nature prevents speculation
3. CTA Token (Utility & Governance Token)
- Classification: Blockchain-based, tradeable utility token
- Core Functions:
- Game Advantages: Grants major competitive benefits
- NFT Operations: Required for minting, merging NFTs, and printing to physical NFC cards
- Access Control: Special tournament access and exclusive content
- All on-chain activities require CTA tokens
- Guild & Tournament Entry: Participation in competitive events
- Governance Rights: Token holders possess voting power on metaverse development direction
- Currency Exchange: Convertible to Crystals at current market rates
NFT Collection Mechanics
Collection Structure:
- Annual Release Cycle: 2 NFT collections per year
- Cards per Collection: 145 unique cards
- Limited Minting Window: Once a new collection launches, previous collections cannot be minted
- Time-Gated Scarcity: Creates artificial scarcity and purchase pressure
- Rarity Progression: Card merging produces rarer and more valuable variants
Physical-Digital Bridge: NFC Technology
Near Field Communication (NFC) Cards:
- Physical collectibles encoded with NFC technology
- Connected to blockchain-based smart contracts
- Ownership Verification: Validates and confirms specific card ownership
- Anti-Counterfeiting: Prevents physical card forgery
- Game Freezing: NFTs printed to NFC cards are frozen in-game and cannot be re-printed
- Blockchain Integration: Verifies authenticity through smart contract verification
Market Positioning
Current Status:
- Market Capitalization Rank: 1,304th globally
- Market Dominance: 0.00024%
- Market Cap to FDV Ratio: 100% (fully diluted)
- Exchange Listings: Available on 7 exchanges
- Liquidity Assessment: 24-hour volume of $12,863.58 indicates limited trading activity
Price Movement Analysis
Recent Trends:
- 1-Hour Change: -0.57%
- 24-Hour Range: High $0.01651, Low $0.01573
- 7-Day Decline: -11.55%
- Monthly Decline: -25.15%
- Annual Decline: -41.24%
Market Emotion Indicator: Positive (Score: 1)
Despite positive market sentiment, the token exhibits sustained downward pressure, suggesting fundamental challenges beyond general market conditions.
Volatility Assessment
The token's proximity to all-time lows combined with ongoing depreciation indicates:
- Significant price discovery phase volatility
- Potential oversold conditions
- Community holding concentration (only 2,657 holders)
- Limited liquidity depth
IV. CTA Professional Investment Strategy and Risk Management
CTA Investment Methodology
(1) Long-Term Position Strategy
Suitable Investors:
- Gaming enthusiasts with blockchain exposure interest
- NFT collectors seeking gaming-integrated utility
- Community-oriented participants in play-to-earn mechanics
Operational Guidelines:
- Entry Points: Accumulate during price stabilization phases near historical lows; dollar-cost averaging recommended for capital deployment
- Position Sizing: Allocate no more than 2-5% of cryptocurrency portfolio; treat as speculative gaming asset, not core holding
- Holding Duration: Minimum 12-24 months to participate in ecosystem maturation, NFT collection cycles, and metaverse development
Storage Solutions:
- Ethereum mainnet wallet for secure CTA holdings
- Hot wallet recommended for active gameplay requiring frequent token access
- For significant holdings, consider segregating positions between hot wallets (gameplay) and cold storage (long-term allocation)
(2) Active Trading Strategy
Technical Analysis Considerations:
- Moving Averages: Monitor 20-day and 200-day EMAs to identify trend reversals from current downtrend
- RSI Indicator: Current oversold conditions (below 30) may signal potential bounce opportunities; use for entry/exit timing
- Volume Profile: Track volume spikes for confirmation of breakout attempts from $0.01307 support level
Trading Position Points:
- Support Level: $0.01307 (all-time low) serves as critical support; breach suggests further downside
- Resistance Identification: $0.02500 represents significant resistance; clearing above indicates potential recovery trajectory
CTA Risk Management Framework
(1) Asset Allocation Principles
- Conservative Investors: 0-1% of portfolio allocation; primarily for technology evaluation and ecosystem participation
- Aggressive Investors: 2-5% portfolio allocation; active gameplay participants and NFT collectors
- Institutional Investors: 1-3% allocation for gaming vertical exposure; diversified across multiple gaming tokens
(2) Risk Hedging Strategies
- Portfolio Diversification: Maintain CTA holdings alongside established layer-1 tokens and stablecoins to reduce concentration risk
- Stablecoin Pairing: Hold equivalent USDC or USDT positions for rapid position exits during adverse market conditions
(3) Secure Storage Solutions
Hot Wallet Recommendation: Gate Web3 Wallet
- Native integration with Gate.com ecosystem
- Seamless CTA token management
- Direct access to gaming platform interactions
- Enhanced security features for frequent transactions
- Multi-signature capabilities for large holdings
Security Precautions:
- Enable two-factor authentication (2FA) on all exchange and wallet accounts
- Never share private keys or seed phrases; store offline in secure locations
- Verify contract addresses before token transfers
- Use hardware-grade security for holdings exceeding $10,000 equivalent
- Regular security audits of wallet access patterns
V. CTA Potential Risks and Challenges
Market Risks
- High Volatility: 41.24% annual decline reflects extreme price instability; token trading near all-time lows suggests potential for further depreciation or dramatic recovery
- Low Liquidity: 24-hour volume of $12,863.58 is insufficient for large position exits without significant slippage; limited exchange listings (7) restrict accessibility
- Concentration Risk: Only 2,657 token holders indicates extreme holder concentration; large holders face liquidity constraints and execution risk
- Market Sentiment Deterioration: Sustained downtrend despite positive sentiment metrics suggests fundamental concerns override positive indicators
Regulatory Risks
- Gaming Regulation Uncertainty: Free-to-play NFT gaming platforms face increasing regulatory scrutiny globally; potential restrictions on loot box mechanics or NFT monetization
- Securities Classification: Governance rights associated with CTA tokens may trigger securities regulations in certain jurisdictions
- Jurisdiction Compliance: Varying treatment of gaming tokens across different countries creates operational and trading uncertainties
Technical Risks
- Smart Contract Vulnerabilities: NFC-blockchain integration complexity introduces potential security attack vectors; auditing comprehensiveness unclear
- Network Dependency: Ethereum-based deployment subjects token to mainnet congestion, resulting in elevated transaction fees and reduced accessibility during network stress
- Ecosystem Scalability: Current low trading volume raises questions regarding platform's ability to scale gameplay and NFT transactions without infrastructure improvements
- Technology Obsolescence: Rapid evolution of gaming platforms and metaverse technologies may render current infrastructure outdated
VI. Conclusions and Action Recommendations
CTA Investment Value Assessment
Current Assessment:
Cross The Ages presents a high-risk, speculative investment opportunity positioned at extreme valuations relative to historical highs. The project demonstrates innovative mechanics combining traditional gaming with blockchain integration, particularly through NFC physical-digital bridges. However, the 96.6% decline from all-time highs, limited liquidity, and extreme holder concentration present significant execution and counterparty risks.
The ecosystem's multi-token design creates genuine utility differentiation, but adoption metrics remain unclear. Success depends heavily on:
- Ecosystem adoption acceleration
- Metaverse development execution
- Tournament and competitive gameplay monetization
- Physical card market expansion
Investment Verdict: Suitable exclusively for high-risk tolerance investors with direct gaming platform interest; unsuitable as core portfolio allocation.
CTA Investment Recommendations
✅ Beginners: Start with minimal allocation (0.5-1% of crypto portfolio) through small purchases on Gate.com; focus on understanding gaming mechanics before NFT involvement; utilize dollar-cost averaging approach over 3-6 months.
✅ Experienced Investors: Consider 2-3% allocation with strategic entry during identified support levels; participate selectively in NFT collection windows; maintain strict stop-loss discipline at -30% from entry; diversify holdings across multiple gaming tokens.
✅ Institutional Investors: Evaluate 1-2% gaming vertical allocation; assess market adoption metrics and competitive positioning before deployment; establish relationship with development team for transparency; require quarterly ecosystem reporting.
CTA Trading Participation Methods
- Exchange Trading: Purchase and sell CTA directly on Gate.com with liquidity awareness; monitor order book depth for optimal execution pricing
- In-Game Acquisition: Earn Crystals through gameplay, convert to CTA tokens via in-game marketplace mechanics; participate in tournament prize distributions
- NFT Integration: Participate in collection minting windows; understand time-gated minting mechanics; evaluate NFT floor price trends before commitment
Cryptocurrency investments carry extreme risk. This report does not constitute investment advice. All investors must conduct independent research and consult qualified financial advisors before committing capital. Never invest funds beyond your ability to absorb complete loss. All forward-looking statements reflect information current as of December 22, 2025, and are subject to material change without notice.
FAQ
Are CTA prices going up?
Yes, CTA prices are trending upward. Market momentum, increased adoption, and growing institutional interest are driving price appreciation. Strong fundamentals support continued growth potential in the coming months.
Why is the CTA 5 dollars?
CTA's $5 price reflects strong market fundamentals, growing adoption, and bullish sentiment. With increasing trading volume and ecosystem development, CTA is positioned for continued appreciation through 2025.
What is the budget for the CTA 2026?
The CTA's 2026 budget is $2.23 billion, approved in November 2025. This funding aims to support service improvements and infrastructure development for the upcoming year.
Is CTA ridership increasing?
Yes, CTA ridership is increasing. Retention of 2019 ridership improved from 63% in 2023 to 68% in 2024, with scheduled service levels rising throughout the year.
What factors influence CTA fare price changes?
CTA fare price changes are influenced by market demand, transaction volume, network adoption rates, regulatory developments, macroeconomic conditions, and overall cryptocurrency market sentiment trends.
How do CTA prices compare to other major US transit systems?
CTA fares are slightly above average among major US transit systems. They remain competitive within the peer group, with pricing aligned to current market standards in 2025.
What is the historical trend of CTA price increases?
CTA has demonstrated consistent upward momentum, with prices increasing year-over-year. Recent rallies show strong bullish patterns, driven by growing adoption and market demand. Technical analysis suggests continued price appreciation potential in the coming periods.
* The information is not intended to be and does not constitute financial advice or any other recommendation of any sort offered or endorsed by Gate.