2025 DFND Price Prediction: Analyzing Market Trends and Potential Growth Factors for the Digital Asset
Introduction: DFND's Market Position and Investment Value
dFund (DFND), as a revolutionary and comprehensive DeFi platform, has made significant strides since its inception in 2021. As of 2025, DFND's market capitalization has reached $77,992, with a circulating supply of approximately 332,447,043 tokens, and a price hovering around $0.0002346. This asset, hailed as the "all-inclusive DeFi solution," is playing an increasingly crucial role in decentralized finance, offering advanced features such as decentralized hedge funds, P2P lending, and synthetic asset markets.
This article will provide a comprehensive analysis of DFND's price trends from 2025 to 2030, considering historical patterns, market supply and demand, ecosystem development, and macroeconomic factors to offer professional price predictions and practical investment strategies for investors.
I. DFND Price History Review and Current Market Status
DFND Historical Price Evolution Trajectory
- 2021: DFND reached its all-time high of $0.061523 on May 7, marking a significant milestone in its price history.
- 2025: The token hit its all-time low of $0.00014998 on January 7, representing a substantial decline from its peak.
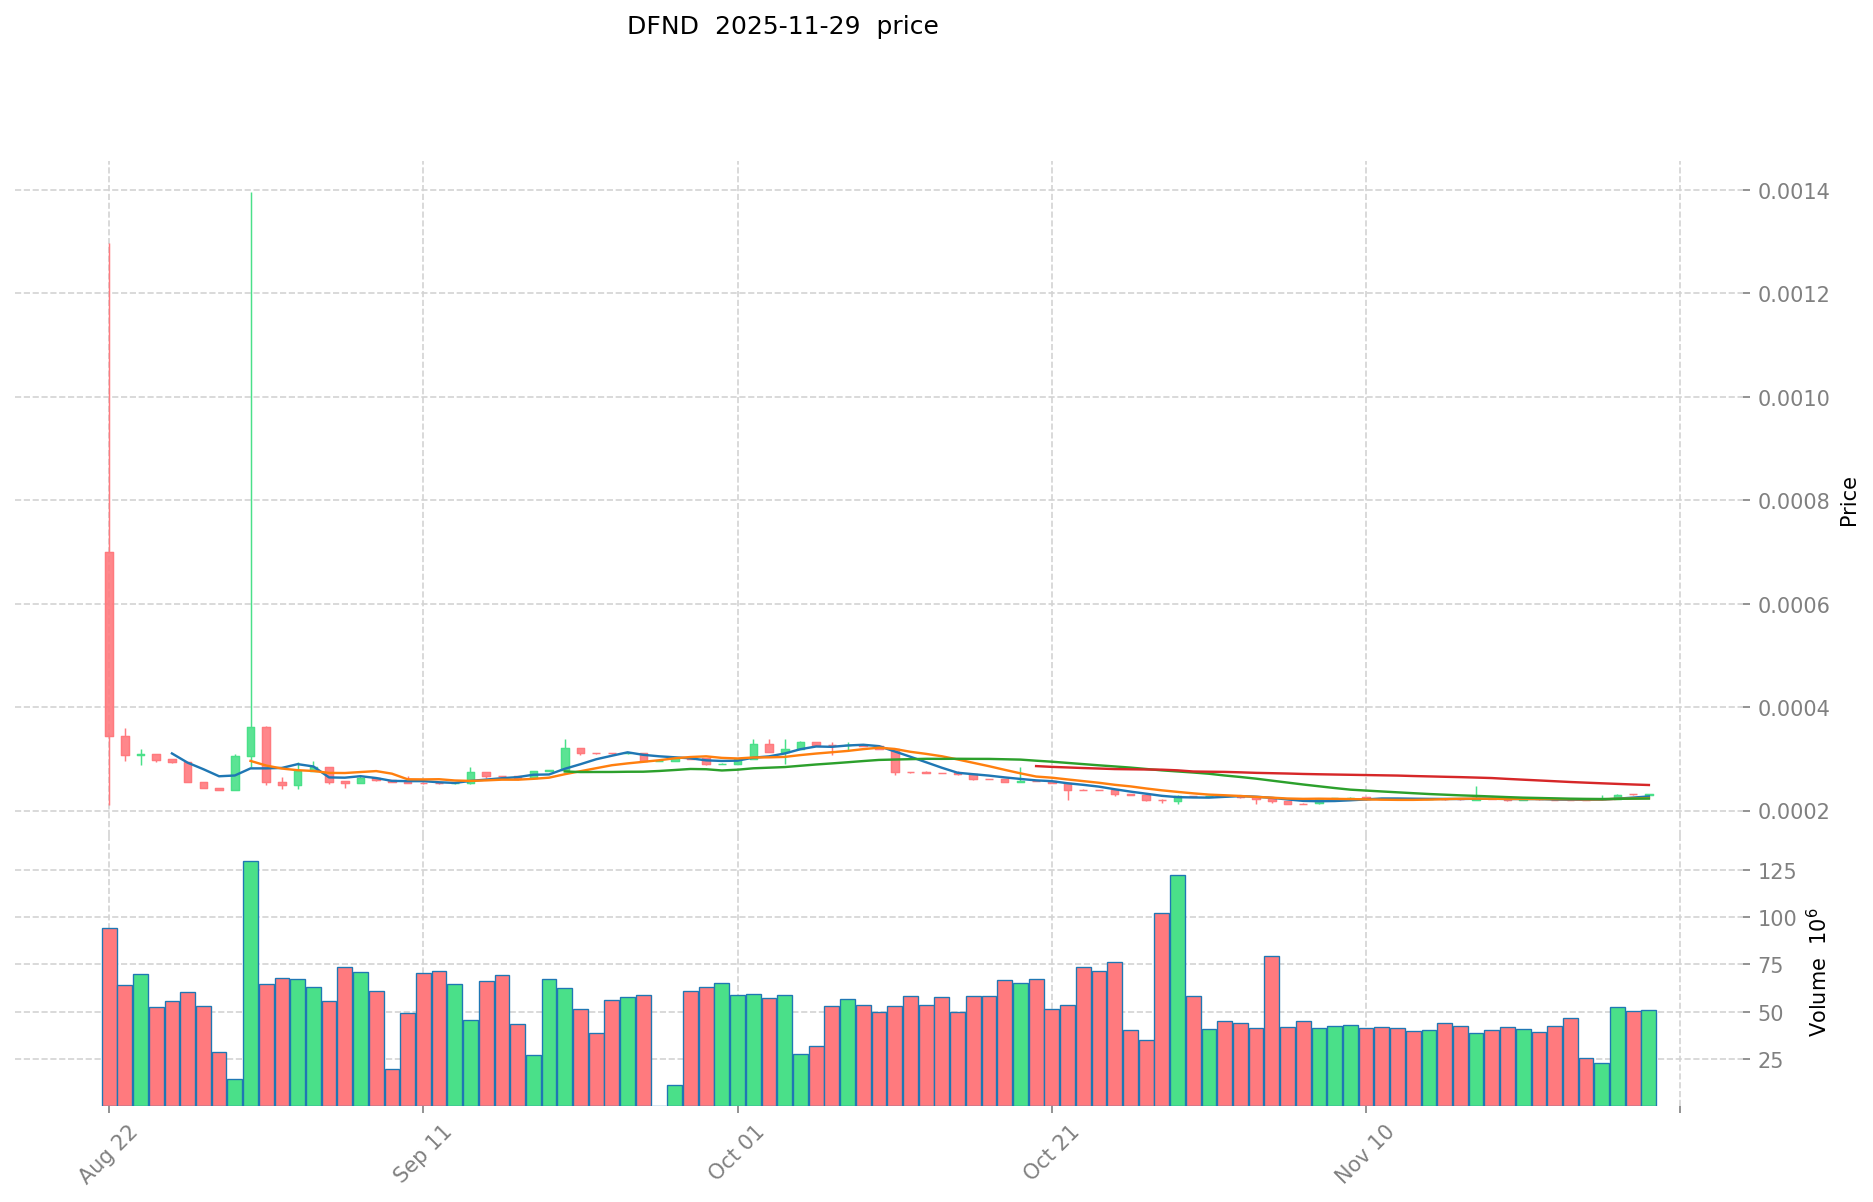
DFND Current Market Situation
As of November 30, 2025, DFND is trading at $0.0002346. The token has shown positive momentum across various timeframes, with a 1.39% increase in the past hour and a 1.38% gain over the last 24 hours. The 7-day performance is particularly strong, with a 5.7% price increase. Over the past 30 days, DFND has risen by 2.23%, and it has demonstrated significant growth of 19.93% over the past year.
The current market capitalization of DFND stands at $77,992.07, with a circulating supply of 332,447,042.9283598 tokens. The total supply is capped at 1,000,000,000 DFND. The fully diluted valuation is $234,600.00, indicating potential for growth if the entire supply were to enter circulation.
Trading volume in the last 24 hours reached $11,448.48, suggesting moderate market activity. The token's market dominance is currently at 0.0000071%, reflecting its relatively small position in the overall cryptocurrency market.
Click to view the current DFND market price
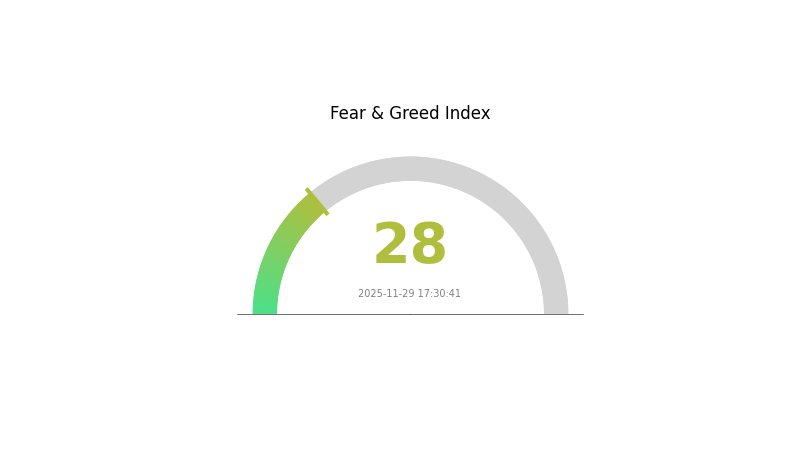
DFND Market Sentiment Indicator
2025-11-29 Fear and Greed Index: 28 (Fear)
Click to view the current Fear & Greed Index
The crypto market sentiment remains cautious, with the Fear and Greed Index at 28, indicating a state of fear. This suggests investors are wary and potentially looking for buying opportunities. During such periods, it's crucial to stay informed and make rational decisions. Remember, market cycles are normal, and fear can sometimes precede recovery. However, always conduct thorough research and consider your risk tolerance before making any investment decisions.
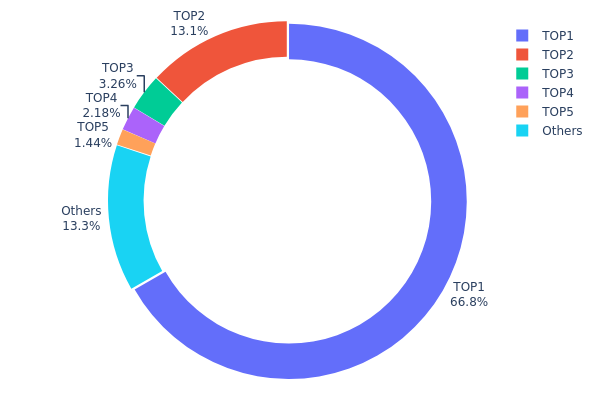
DFND Holdings Distribution
The address holdings distribution data provides crucial insights into the concentration of DFND tokens among various wallet addresses. Analysis of this data reveals a highly centralized distribution pattern, with the top address holding a significant 66.75% of the total supply. The second-largest holder accounts for 13.07%, while the remaining top 5 addresses collectively hold an additional 6.87%.
This concentration raises concerns about market manipulation risks and potential price volatility. With nearly 80% of tokens controlled by just two addresses, the market structure appears vulnerable to large-scale movements initiated by these major holders. Such a centralized distribution could lead to increased price instability and reduced liquidity in the secondary market.
The current holdings distribution suggests a low degree of decentralization for DFND, which may impact its long-term sustainability and adoption. While this concentration could potentially provide stability in the short term, it also poses risks to the token's governance structure and overall ecosystem health. Investors and stakeholders should closely monitor any significant changes in these large holdings, as they could have substantial implications for DFND's market dynamics and future development.
Click to view the current DFND Holdings Distribution
| Top | Address | Holding Qty | Holding (%) |
|---|---|---|---|
| 1 | 0x525c...c154a7 | 667552.96K | 66.75% |
| 2 | 0x28e8...019da1 | 130718.69K | 13.07% |
| 3 | 0x0d07...b492fe | 32634.45K | 3.26% |
| 4 | 0xd2ff...722c66 | 21843.40K | 2.18% |
| 5 | 0x6d16...281d0e | 14375.00K | 1.43% |
| - | Others | 132875.51K | 13.31% |
II. Key Factors Affecting DFND's Future Price
Supply Mechanism
- Fixed Supply: DFND has a fixed total supply, which creates scarcity and potentially supports long-term value.
- Historical Pattern: Limited supply has typically led to increased demand and price appreciation in similar cryptocurrencies.
- Current Impact: The fixed supply may continue to drive investor interest and potentially contribute to price stability or growth.
Macroeconomic Environment
- Inflation Hedging Properties: As a cryptocurrency, DFND may be viewed as a potential hedge against inflation, similar to other digital assets.
- Geopolitical Factors: Global economic uncertainties and geopolitical tensions could increase interest in cryptocurrencies like DFND as alternative investments.
Technical Development and Ecosystem Building
- Ecosystem Applications: The development of DApps and other projects within the DFND ecosystem could enhance its utility and attract more users, potentially impacting its value.
III. DFND Price Prediction for 2025-2030
2025 Outlook
- Conservative prediction: $0.00015 - $0.00020
- Neutral prediction: $0.00020 - $0.00025
- Optimistic prediction: $0.00025 - $0.00030 (requires favorable market conditions and increased adoption)
2026-2028 Outlook
- Market phase expectation: Potential growth phase with increasing adoption
- Price range forecast:
- 2026: $0.00015 - $0.00033
- 2027: $0.00027 - $0.00040
- 2028: $0.00026 - $0.00038
- Key catalysts: Expanding use cases, technological improvements, and broader market trends
2029-2030 Long-term Outlook
- Base scenario: $0.00036 - $0.00042 (assuming steady market growth and adoption)
- Optimistic scenario: $0.00048 - $0.00058 (with accelerated adoption and favorable market conditions)
- Transformative scenario: $0.00060+ (with breakthrough innovations and mainstream acceptance)
- 2030-12-31: DFND $0.00058 (potential peak price for the period)
| 年份 | 预测最高价 | 预测平均价格 | 预测最低价 | 涨跌幅 |
|---|---|---|---|---|
| 2025 | 0.0003 | 0.00023 | 0.00015 | 0 |
| 2026 | 0.00033 | 0.00027 | 0.00015 | 14 |
| 2027 | 0.0004 | 0.0003 | 0.00027 | 26 |
| 2028 | 0.00038 | 0.00035 | 0.00026 | 49 |
| 2029 | 0.00048 | 0.00036 | 0.00023 | 55 |
| 2030 | 0.00058 | 0.00042 | 0.00029 | 79 |
IV. DFND Professional Investment Strategies and Risk Management
DFND Investment Methodology
(1) Long-term Holding Strategy
- Suitable for: Risk-tolerant investors with a long-term perspective
- Operation suggestions:
- Accumulate DFND tokens during market dips
- Set a target holding period of at least 2-3 years
- Store tokens in a secure hardware wallet
(2) Active Trading Strategy
- Technical analysis tools:
- Moving Averages: Use to identify trend direction and potential reversal points
- Relative Strength Index (RSI): Monitor overbought/oversold conditions
- Key points for swing trading:
- Set clear entry and exit points based on technical indicators
- Use stop-loss orders to limit potential losses
DFND Risk Management Framework
(1) Asset Allocation Principles
- Conservative investors: 1-3% of crypto portfolio
- Aggressive investors: 5-8% of crypto portfolio
- Professional investors: 10-15% of crypto portfolio
(2) Risk Hedging Solutions
- Diversification: Spread investments across multiple DeFi projects
- Stop-loss orders: Implement to limit potential losses
(3) Secure Storage Solutions
- Hot wallet recommendation: Gate Web3 Wallet
- Cold storage solution: Hardware wallet for long-term holdings
- Security precautions: Enable two-factor authentication, use strong passwords, and keep private keys offline
V. Potential Risks and Challenges for DFND
DFND Market Risks
- Volatility: High price fluctuations common in the crypto market
- Liquidity: Limited trading volume may impact ability to execute trades
- Competition: Increasing number of DeFi platforms could affect market share
DFND Regulatory Risks
- Regulatory uncertainty: Changing legal landscape for DeFi projects
- Compliance challenges: Potential difficulties in adhering to evolving regulations
- Cross-border issues: Varying regulatory approaches in different jurisdictions
DFND Technical Risks
- Smart contract vulnerabilities: Potential for code exploits or bugs
- Scalability challenges: Possible network congestion during high demand
- Interoperability issues: Compatibility problems with other DeFi protocols
VI. Conclusion and Action Recommendations
DFND Investment Value Assessment
DFND presents a high-risk, high-potential investment in the evolving DeFi sector. Long-term value proposition lies in its innovative platform features, while short-term risks include market volatility and regulatory uncertainties.
DFND Investment Recommendations
✅ Beginners: Start with small positions, focus on education and understanding the DeFi ecosystem
✅ Experienced investors: Consider allocating a portion of DeFi portfolio to DFND, actively monitor market trends
✅ Institutional investors: Conduct thorough due diligence, consider DFND as part of a diversified DeFi strategy
DFND Trading Participation Methods
- Spot trading: Purchase DFND tokens on Gate.com
- DeFi staking: Participate in yield farming or liquidity provision if available
- Dollar-cost averaging: Regularly invest small amounts to mitigate market volatility
Cryptocurrency investments carry extremely high risks, and this article does not constitute investment advice. Investors should make decisions carefully based on their own risk tolerance and are advised to consult professional financial advisors. Never invest more than you can afford to lose.
FAQ
Is Denison Mines Corp a good buy?
Yes, Denison Mines Corp looks promising. With uranium demand rising and its strategic assets, it's positioned for growth in the nuclear energy sector.
Is Diana shipping a good buy?
Yes, Diana shipping looks like a promising investment in 2025. With increasing global trade, the shipping industry is poised for growth. Diana's strong fleet and financial position make it an attractive option.
Is DND a buy or sell?
Based on current market trends and potential growth, DND appears to be a buy. Its innovative technology and increasing adoption suggest promising future value.
What is the price target for Denison Mines?
Analysts predict Denison Mines could reach $2.50-$3.00 per share by 2026, driven by uranium market recovery and project developments.
Share
Content
Introduction: DFND's Market Position and Investment Value
I. DFND Price History Review and Current Market Status
II. Key Factors Affecting DFND's Future Price
III. DFND Price Prediction for 2025-2030
IV. DFND Professional Investment Strategies and Risk Management
V. Potential Risks and Challenges for DFND
VI. Conclusion and Action Recommendations
FAQ

