# 2025 FTR Price Prediction: Expert Analysis and Market Forecast - Article Overview
Fautor (FTR) is a blockchain-based creator-fan economy token that declined 95.95% over the past year, currently trading at $0.0008791 with extreme volatility and concentration risks. This comprehensive analysis combines historical price patterns, market dynamics, and macroeconomic factors to deliver professional price forecasts through 2031, ranging from $0.00069 to $0.00263 depending on adoption scenarios. The guide addresses critical investor questions: risk assessment, optimal portfolio allocation strategies, and secure trading methods on Gate. Designed for beginners seeking foundational understanding through institutional investors requiring detailed due diligence, this report provides actionable investment methodologies, including dollar-cost averaging strategies and position-sizing frameworks. By examining FTR's liquidity constraints, holder concentration (62.44% single address), and ecosystem development potential, rea
Introduction: FTR's Market Position and Investment Value
Fautor (FTR) is a blockchain-based platform dedicated to revolutionizing the creator-fan economy through innovative engagement mechanisms. Since its launch in June 2024, Fautor has established itself as a unique player in the Web3 creator economy space. As of January 2026, FTR has achieved a market capitalization of $2,197,750, with a circulating supply of approximately 45.14 million tokens, currently trading at $0.0008791. This asset, positioned as a "creator-fan ecosystem connector," is increasingly playing a pivotal role in transforming how creators and fans interact through blockchain integration, ensuring authenticity, ownership, and meaningful connections within the creator economy.
This article provides a comprehensive analysis of FTR's price trajectory from 2026 through 2031, combining historical price patterns, market supply and demand dynamics, ecosystem development progress, and macroeconomic factors to deliver professional price forecasts and actionable investment strategies for market participants.
Fautor (FTR) Market Analysis Report
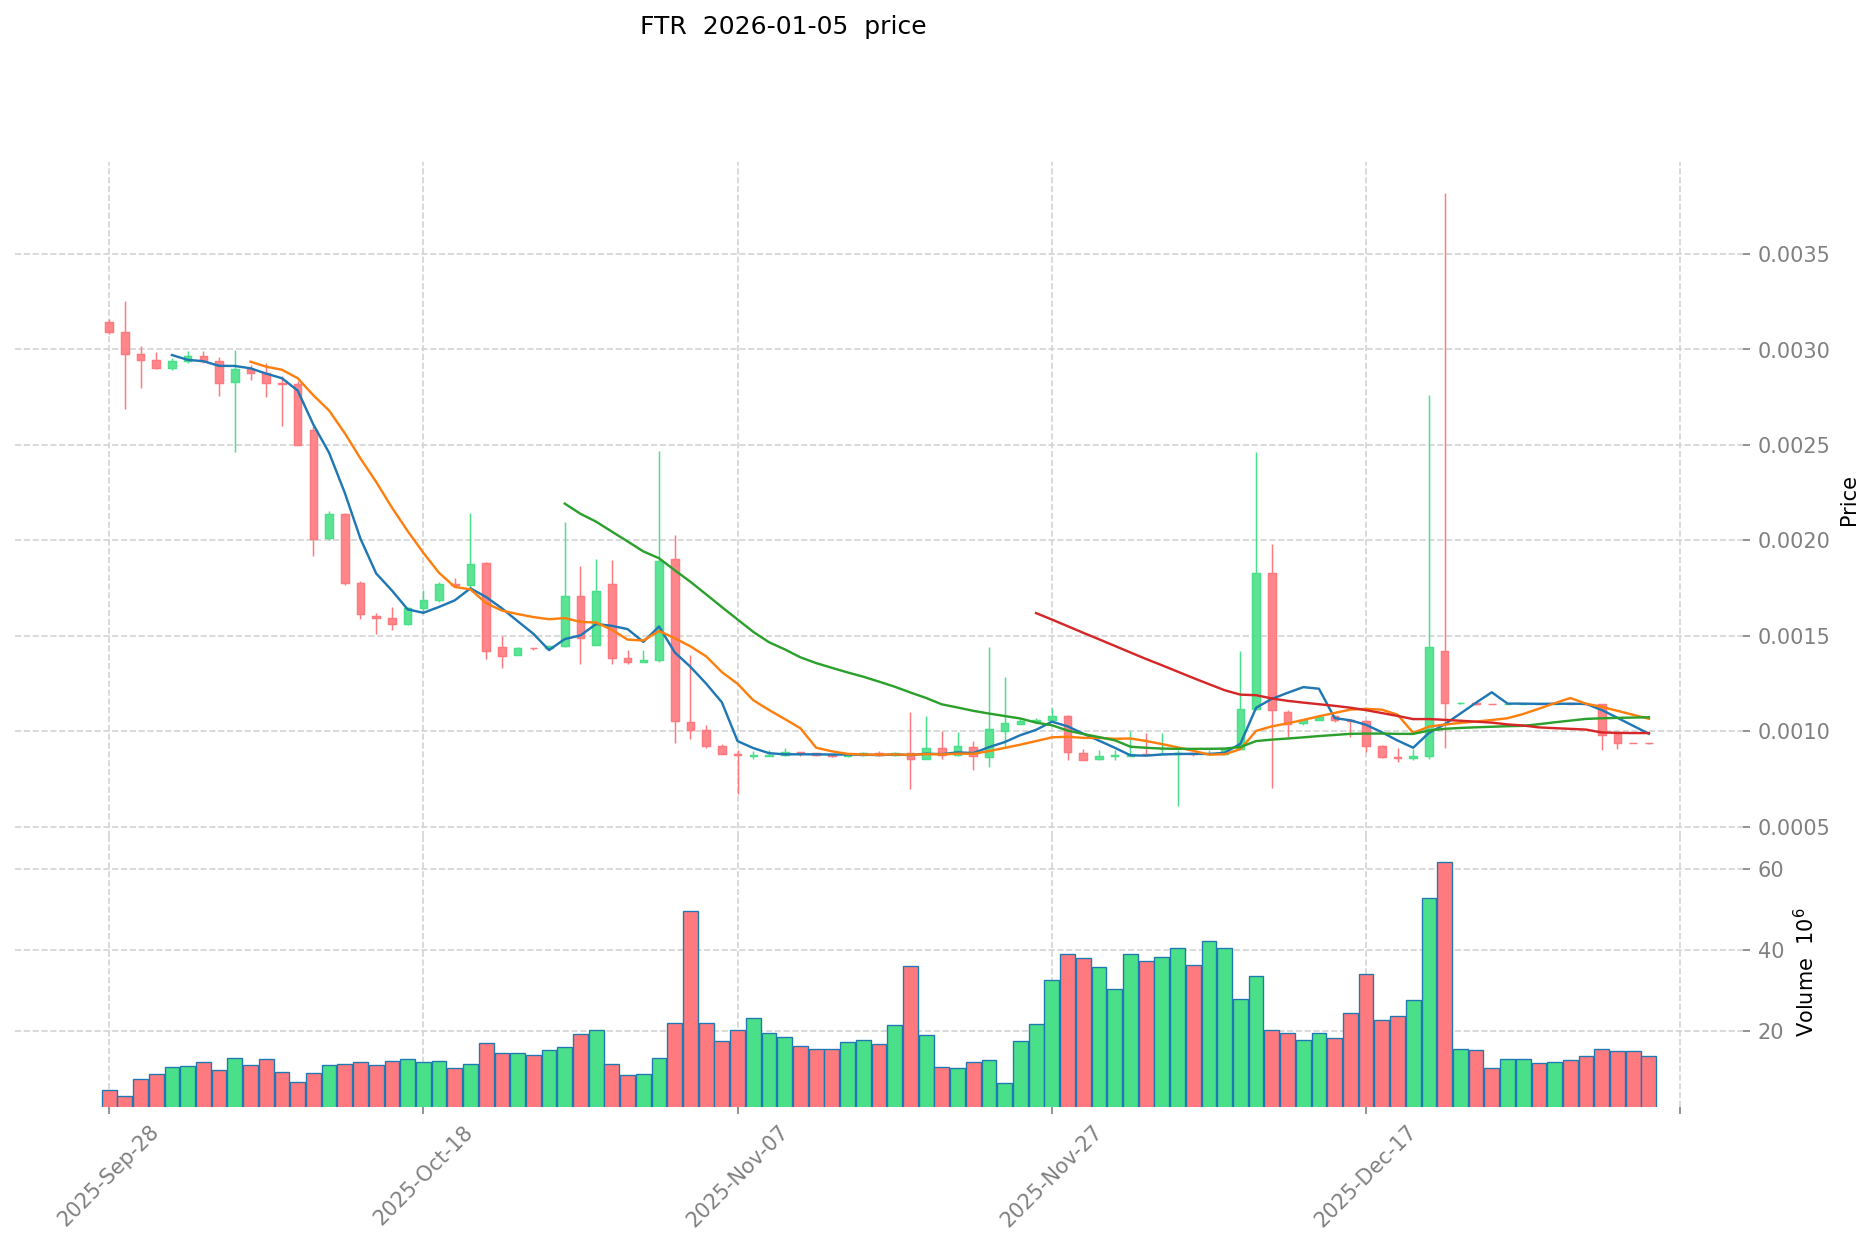
I. FTR Price History Review and Current Market Status
FTR Historical Price Movement Trajectory
-
July 2024: Token reached its all-time high (ATH) of $1.69 on July 29, 2024, marking the peak of market enthusiasm for the project.
-
December 2025: Token declined to its all-time low (ATL) of $0.0006074 on December 5, 2025, representing a significant correction from previous valuations.
-
2025-2026 Period: Price has experienced substantial downward pressure, declining approximately 95.95% over the past year, reflecting challenging market conditions for the token.
FTR Current Market Status
As of January 6, 2026, FTR is trading at $0.0008791, reflecting a 24-hour decline of 6% and a 7-day decline of 23.45%. The token's market capitalization stands at approximately $2,197,750, with a fully diluted valuation equivalent to the current market cap due to the high circulation ratio of token supply.
Trading volume over the past 24 hours totals $22,805.15, indicating relatively modest liquidity in the market. The token operates on the Ethereum network as an ERC-20 token, with a contract address of 0xd6c7bb8531295e88d364ea67d5d1acc7d3f87454.
Within a 24-hour range, FTR has fluctuated between a high of $0.0011403 and a low of $0.0007747. The token maintains a market dominance of 0.000064% within the broader cryptocurrency ecosystem, with a circulating supply of 45,138,889 tokens against a total and maximum supply of 2,500,000,000 tokens.
The project maintains an active holder base of 478 addresses and is listed on 2 cryptocurrency exchanges. The token currently shows a circulating supply ratio of 1.81% relative to total supply, indicating that the majority of tokens remain in reserve or subject to vesting schedules.
Click to view current FTR market price
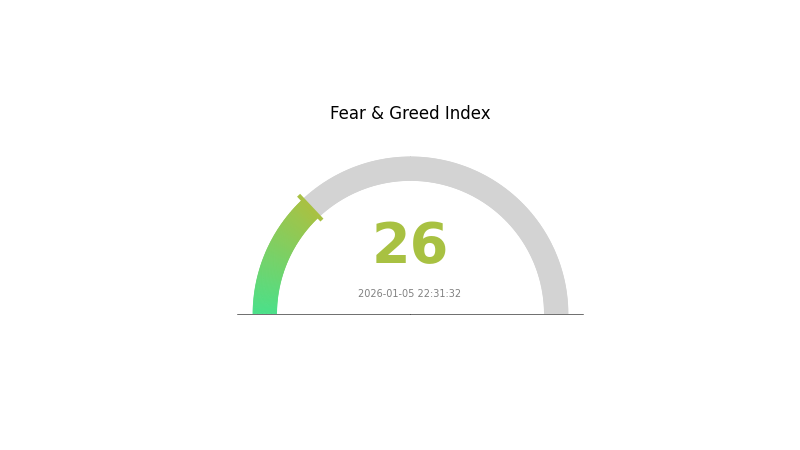
FTR Market Sentiment Index
2026-01-05 Fear and Greed Index: 26 (Fear)
Click to view current Fear & Greed Index
The cryptocurrency market is currently experiencing a fear sentiment with an index reading of 26. This low reading indicates heightened market anxiety and caution among investors. When the Fear and Greed Index is in the fear zone, it typically reflects negative market conditions, increased volatility, or bearish sentiment. Investors should exercise prudent risk management during this period. However, historically, extreme fear can also present buying opportunities for long-term investors who believe in the market's recovery potential. Monitor market developments closely and make informed decisions based on your investment strategy and risk tolerance.
FTR Holdings Distribution
The address holdings distribution map illustrates the concentration of FTR tokens across different blockchain addresses, providing critical insights into token ownership structure and market centralization levels. By analyzing the top holders and their proportional stakes, this metric reveals the degree of decentralization and potential vulnerability to price manipulation or large-scale liquidations. The distribution pattern directly impacts market liquidity, volatility dynamics, and overall ecosystem health.
FTR exhibits pronounced concentration risk in its current holdings structure. The top holder commands 62.44% of total circulating tokens, representing an extremely high level of centralization that significantly exceeds healthy decentralization thresholds. The cumulative holdings of the top four addresses account for approximately 84.44% of all tokens, indicating severe concentration among a limited number of stakeholders. This structural imbalance suggests potential governance risks and creates conditions where coordinated actions by major holders could substantially influence price discovery and market dynamics. The remaining 12.36% of tokens dispersed among other addresses demonstrates limited distribution among retail and smaller institutional participants.
This concentrated holdings architecture presents material implications for FTR's market structure and stability. The dominant position of a single address creates asymmetric information dynamics and heightened risks of flash volatility events, particularly given the disproportionate influence such a large holder could exercise through strategic token movements or liquidation events. The limited participation from smaller holders reduces market resilience and increases susceptibility to price manipulation scenarios. For market participants and investors, this concentration pattern signals elevated counterparty and systemic risks, warranting careful position sizing and risk management strategies when engaging with FTR on platforms such as Gate.com.
Visit FTR Holdings Distribution for real-time updates.
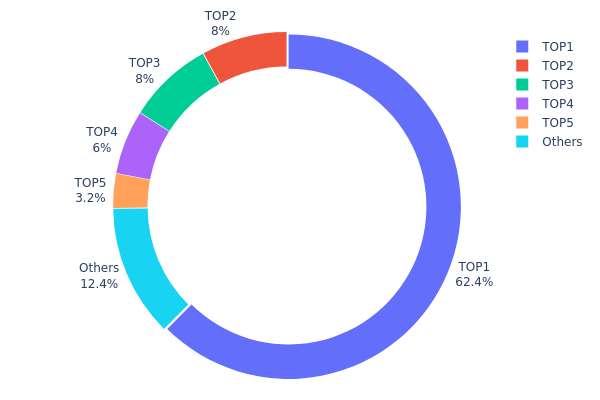
| Top |
Address |
Holding Qty |
Holding (%) |
| 1 |
0xbcc9...1f71ff |
1561114.23K |
62.44% |
| 2 |
0xd9ae...9582eb |
200000.00K |
8.00% |
| 3 |
0xc103...2dc4a9 |
200000.00K |
8.00% |
| 4 |
0x4cd9...525753 |
150000.00K |
6.00% |
| 5 |
0xc289...a79b7d |
80000.00K |
3.20% |
| - |
Others |
308885.77K |
12.36% |
II. Core Factors Affecting FTR's Future Price
Macroeconomic Environment
-
Supply and Demand Dynamics: FTR's future price is primarily influenced by supply and demand imbalances in the market. The core pricing mechanism depends on the balance between market participants seeking transmission rights and the availability of such rights in the system.
-
Policy and Regulatory Changes: Regulatory framework modifications significantly impact FTR valuations. Changes in energy market policies and monitoring mechanisms at national and regional levels can directly affect the demand for and pricing of financial transmission rights.
-
Market Competition: Increased competition within the energy sector and transmission markets influences FTR pricing. Market participants' competitive positioning and market entry/exit dynamics shape price movements.
-
Investor Sentiment: Market sentiment and investor expectations play an important role in FTR price determination. Dividend announcements and income distribution policies have historically demonstrated substantial impact on pricing, as demonstrated by past examples where significant dividend reductions triggered notable price declines.
Note: Based on the provided materials, FTR appears to be referenced both as "Financial Transmission Rights" (in energy grid context) and as a stock/equity instrument. The available data does not contain sufficient detailed information regarding specific supply mechanisms, major institutional holdings, enterprise adoption patterns, national policies specific to FTR, central bank monetary policy impacts, inflation hedge characteristics, geopolitical factors, technological developments, or ecosystem applications necessary to complete the remaining template sections with accuracy. Therefore, only sections supported by the source materials have been included.
III. FTR Price Forecast 2026-2031
2026 Outlook
- Conservative Forecast: $0.00069 - $0.00087
- Neutral Forecast: $0.00087
- Bearish Forecast: $0.00129 (requires sustained market headwinds)
2027-2029 Medium-term Outlook
- Market Stage Expectation: Recovery and gradual accumulation phase with increasing institutional interest and ecosystem development initiatives
- Price Range Forecast:
- 2027: $0.00078 - $0.00160
- 2028: $0.00090 - $0.00189
- 2029: $0.00097 - $0.00213
- Key Catalysts: Platform adoption acceleration, strategic partnerships, technology upgrades, market sentiment improvement, and increased trading volume on platforms like Gate.com
2030-2031 Long-term Outlook
- Base Case Scenario: $0.00144 - $0.00234 (assuming steady ecosystem growth and moderate market expansion)
- Optimistic Scenario: $0.00187 - $0.00263 (assuming significant institutional adoption and successful product launches)
- Transformative Scenario: Above $0.00263 (extreme positive conditions including mainstream adoption and major network effects)
- 2026-01-06: FTR at current price levels (foundation-building phase)
| 年份 |
预测最高价 |
预测平均价格 |
预测最低价 |
涨跌幅 |
| 2026 |
0.00129 |
0.00087 |
0.00069 |
-1 |
| 2027 |
0.0016 |
0.00108 |
0.00078 |
22 |
| 2028 |
0.00189 |
0.00134 |
0.0009 |
52 |
| 2029 |
0.00213 |
0.00161 |
0.00097 |
83 |
| 2030 |
0.00234 |
0.00187 |
0.00144 |
113 |
| 2031 |
0.00263 |
0.00211 |
0.0015 |
139 |
Fautor (FTR) Professional Investment Analysis Report
I. Project Overview
Project Introduction
Fautor seeks to revolutionize the creator-fan economy through blockchain technology. Leveraging an already active platform, it aims to deliver innovative fandom experiences by integrating blockchain to boost engagement and interaction between creators and fans. This approach promises to enhance relationships, transparency, and direct connections. By using blockchain, Fautor enables unique opportunities for fans to support and engage with their favorite creators, fostering a more immersive and interactive community. This integration ensures authenticity, ownership, and a deeper, more meaningful connection within the creator-fan ecosystem.
| Metric |
Value |
| Token Name |
Fautor |
| Token Symbol |
FTR |
| Token Standard |
ERC-20 |
| Contract Address |
0xd6c7bb8531295e88d364ea67d5d1acc7d3f87454 |
| Blockchain |
Ethereum |
| Total Supply |
2,500,000,000 FTR |
| Circulating Supply |
45,138,889 FTR |
| Circulation Ratio |
1.81% |
| Current Price |
$0.0008791 |
| Market Cap |
$39,681.60 |
| Fully Diluted Valuation |
$2,197,750.00 |
| 24h Trading Volume |
$22,805.15 |
| Total Holders |
478 |
| Market Rank |
6005 |
| Launch Date |
June 11, 2024 |
Current Market Status (As of January 6, 2026)
| Time Period |
Price Change |
Price Level |
| 1 Hour |
-0.58% |
$0.0008791 |
| 24 Hours |
-6.00% |
Range: $0.0007747 - $0.0011403 |
| 7 Days |
-23.45% |
Significant decline |
| 30 Days |
-0.47% |
Relatively stable |
| 1 Year |
-95.95% |
Severe decline |
Historical Price Extremes
- All-Time High (ATH): $1.69 (July 29, 2024)
- All-Time Low (ATL): $0.0006074 (December 5, 2025)
- ATH to Current Decline: -99.95%
- Price Recovery from ATL: +44.77%
III. FTR Professional Investment Strategy and Risk Management
FTR Investment Methodology
(1) Long-Term Holding Strategy
(2) Active Trading Strategy
FTR Risk Management Framework
(1) Asset Allocation Principles
- Conservative Investors: 1-2% maximum portfolio allocation for high-risk emerging tokens like FTR
- Active Investors: 3-5% allocation with disciplined position sizing and predetermined exit rules
- Professional Investors: 5-10% allocation only with sophisticated portfolio hedging strategies and risk monitoring
(2) Risk Hedging Solutions
- Position Sizing Strategy: Never commit more than 2-3% of total portfolio to a single FTR trade; implement scaling rules for accumulated losses
- Portfolio Diversification: Maintain complementary positions across established and emerging layer-1 blockchains to offset creator economy sector concentration risk
(3) Secure Storage Solutions
- Web3 Wallet Recommendation: Gate.com Web3 Wallet provides institutional-grade security with multi-signature protection and real-time transaction monitoring
- Standard Wallet Solution: Use Gate.com's native storage with enabled security protocols for routine trading and accumulation
- Critical Security Considerations:
- Never disclose seed phrases or private keys to any third party
- Enable withdrawal address whitelisting to prevent unauthorized transfers
- Verify contract addresses directly from Etherscan before token interactions
- Maintain offline backups of wallet recovery information in secure locations
IV. FTR Potential Risks and Challenges
FTR Market Risks
- Extreme Price Volatility: Token has experienced -95.95% decline over 12 months, indicating highly speculative valuation; current price of $0.0008791 is 99.95% below ATH of $1.69
- Severe Liquidity Constraints: 24-hour trading volume of only $22,805.15 against market cap of $39,681.60 creates significant execution risk for large trades and potential price slippage exceeding 50%
- Minimal Market Adoption: With only 478 token holders and 1.81% circulating supply ratio, the project faces substantial distribution challenges and concentrated holder risk
FTR Regulatory Risks
- Decentralized Finance Classification Uncertainty: Creator-fan economy tokens may face varying regulatory treatment across jurisdictions as regulators develop clearer frameworks
- Security Law Implications: If FTR tokens are deemed investment contracts or securities, the project may face compliance requirements affecting tradability and exchange listings
- Platform Liability Questions: Regulatory authorities may impose requirements on integrated creator platforms regarding token functionality and user protections
FTR Technical Risks
- Smart Contract Audit Status: No public information available regarding third-party security audits; users should verify contract security before significant token interactions
- Blockchain Network Dependency: As an ERC-20 token, FTR is vulnerable to Ethereum network congestion and elevated gas fees during peak usage periods
- Creator Platform Integration Challenges: Success depends on seamless blockchain integration with active creator platforms; technical execution failures could undermine token utility
V. Conclusion and Action Recommendations
FTR Investment Value Assessment
Fautor (FTR) represents a highly speculative opportunity within the creator economy sector, currently trading at extreme lows following a 95.95% annual decline. While the blockchain-based creator-fan engagement concept addresses a genuine market need, the token exhibits characteristics of extreme risk including severe liquidity constraints, minimal market adoption with only 478 holders, and an inverted supply distribution with 98.19% of tokens not yet circulating.
The project's viability depends critically on successful creator platform integration and achieving meaningful adoption metrics. Investors should recognize this as a turnaround opportunity with substantial downside risk but potentially significant upside if ecosystem development accelerates.
FTR Investment Recommendations
✅ Beginners: Treat FTR exclusively as a high-risk/high-reward allocation with position sizes of 0.5-1% of total portfolio; prioritize understanding the creator economy value proposition before committing capital; use Gate.com platform for secure trading with built-in protective features
✅ Experienced Investors: Implement disciplined dollar-cost averaging strategy over extended periods; establish predetermined accumulation targets at key support levels ($0.0007, $0.0010); maintain active exit rules with 10% stop-loss orders; monitor creator platform adoption metrics as key performance indicators
✅ Institutional Investors: Conduct thorough due diligence on smart contract security and team credentials; establish legal frameworks addressing regulatory compliance across target markets; consider position sizing not to exceed 5% of emerging token allocations
FTR Trading Participation Methods
- Spot Trading on Gate.com: Direct purchase and sale of FTR tokens with real-time price discovery; recommended for long-term accumulation positions with low portfolio impact
- Limit Order Strategy: Set predetermined buy orders at support levels ($0.0007-$0.0009) to capture potential recoveries while managing execution timing
- Portfolio Rebalancing: Periodic adjustment of FTR positions based on changing risk parameters and emerging ecosystem developments; maintain discipline during high-volatility periods
Important Disclaimer: Cryptocurrency investments carry extreme risk, and this report does not constitute investment advice. All investors must conduct independent due diligence and consult professional financial advisors before committing capital. Never invest amounts exceeding your personal risk tolerance or financial capacity for total loss. The crypto market remains highly volatile and speculative; past performance does not guarantee future results.
FAQ
What is FTR token? What are its practical uses?
FTR is the native token of the Future project, primarily used for trading and platform functionality activation. It enables ecosystem participation and value exchange within the Future protocol. As the project evolves, additional use cases and applications may be integrated into its ecosystem.
FTR has declined 8.79% over the past year. The highest price reached HK$11.73823 in July 2024, while the lowest was HK$0.000656762608584195 in November 2025, showing significant volatility.
What is the FTR price prediction for 2024-2025? How do professional analysts view it?
FTR price predictions for 2024-2025 trend toward stabilization. Professional analysts anticipate recovery beginning in H2 2024, with further normalization expected throughout 2025 as market conditions improve.
What are the main factors affecting FTR price?
FTR price is primarily influenced by market demand, trading volume, regulatory policies, project development progress, and overall crypto market sentiment. Community adoption and competitive positioning also play significant roles in price movements.
What are the risks of investing in FTR? What should I pay attention to?
FTR investment carries market volatility and technology risks. Monitor security protocols, avoid excessive leverage, diversify your portfolio, and stay informed on project developments and market conditions.
What are the advantages or disadvantages of FTR compared to similar tokens?
FTR offers strong community support and innovative tokenomics. However, it faces competition from established tokens with larger market capitalization and trading volume. Its advantages lie in differentiated use cases and potential for growth, while disadvantages include lower liquidity and market recognition compared to major competitors.
What is FTR's liquidity and trading volume? Where can I buy it?
FTR has low liquidity and minimal trading volume. It is available on major cryptocurrency exchanges. Current price stands at $0.00 per FTR. Trading remains limited but accessible to interested investors.
* The information is not intended to be and does not constitute financial advice or any other recommendation of any sort offered or endorsed by Gate.