# Article Overview: 2025 IOEN Price Prediction - Expert Analysis and Market Forecast
This comprehensive IOEN analysis report provides investors with data-driven price forecasts and strategic investment guidance for 2026-2031. The article examines IOEN's current market position ($0.0006263), historical performance trends, and macro-economic factors influencing the Internet of Energy Network token. It addresses critical investor needs by delivering conservative to optimistic price scenarios, institutional adoption insights, and risk management frameworks suitable for beginners through professional traders on Gate. The report synthesizes technical market data, regulatory environment analysis, and ecosystem development factors to help stakeholders make informed IOEN investment decisions amid extreme market fear conditions.
Introduction: IOEN's Market Position and Investment Value
Internet of Energy Network (IOEN) is a community-driven protocol designed to enable connectivity and value exchange between any energy device, user, or market within clean energy microgrids. As of January 2, 2026, IOEN maintains a market capitalization of $69,143.52, with a circulating supply of approximately 317,051,435 tokens and a current price of $0.0006263. This innovative energy infrastructure asset is playing an increasingly critical role in facilitating the development of a new energy economy powered by blockchain and Holochain technologies.
This article will provide a comprehensive analysis of IOEN's price trends and market dynamics, examining historical performance patterns, market supply and demand factors, ecosystem development, and macroeconomic conditions. By synthesizing these key variables, we aim to deliver professional price forecasts and practical investment strategies for interested market participants.
Internet of Energy Network (IOEN) Market Analysis Report
I. IOEN Price History Review and Market Status
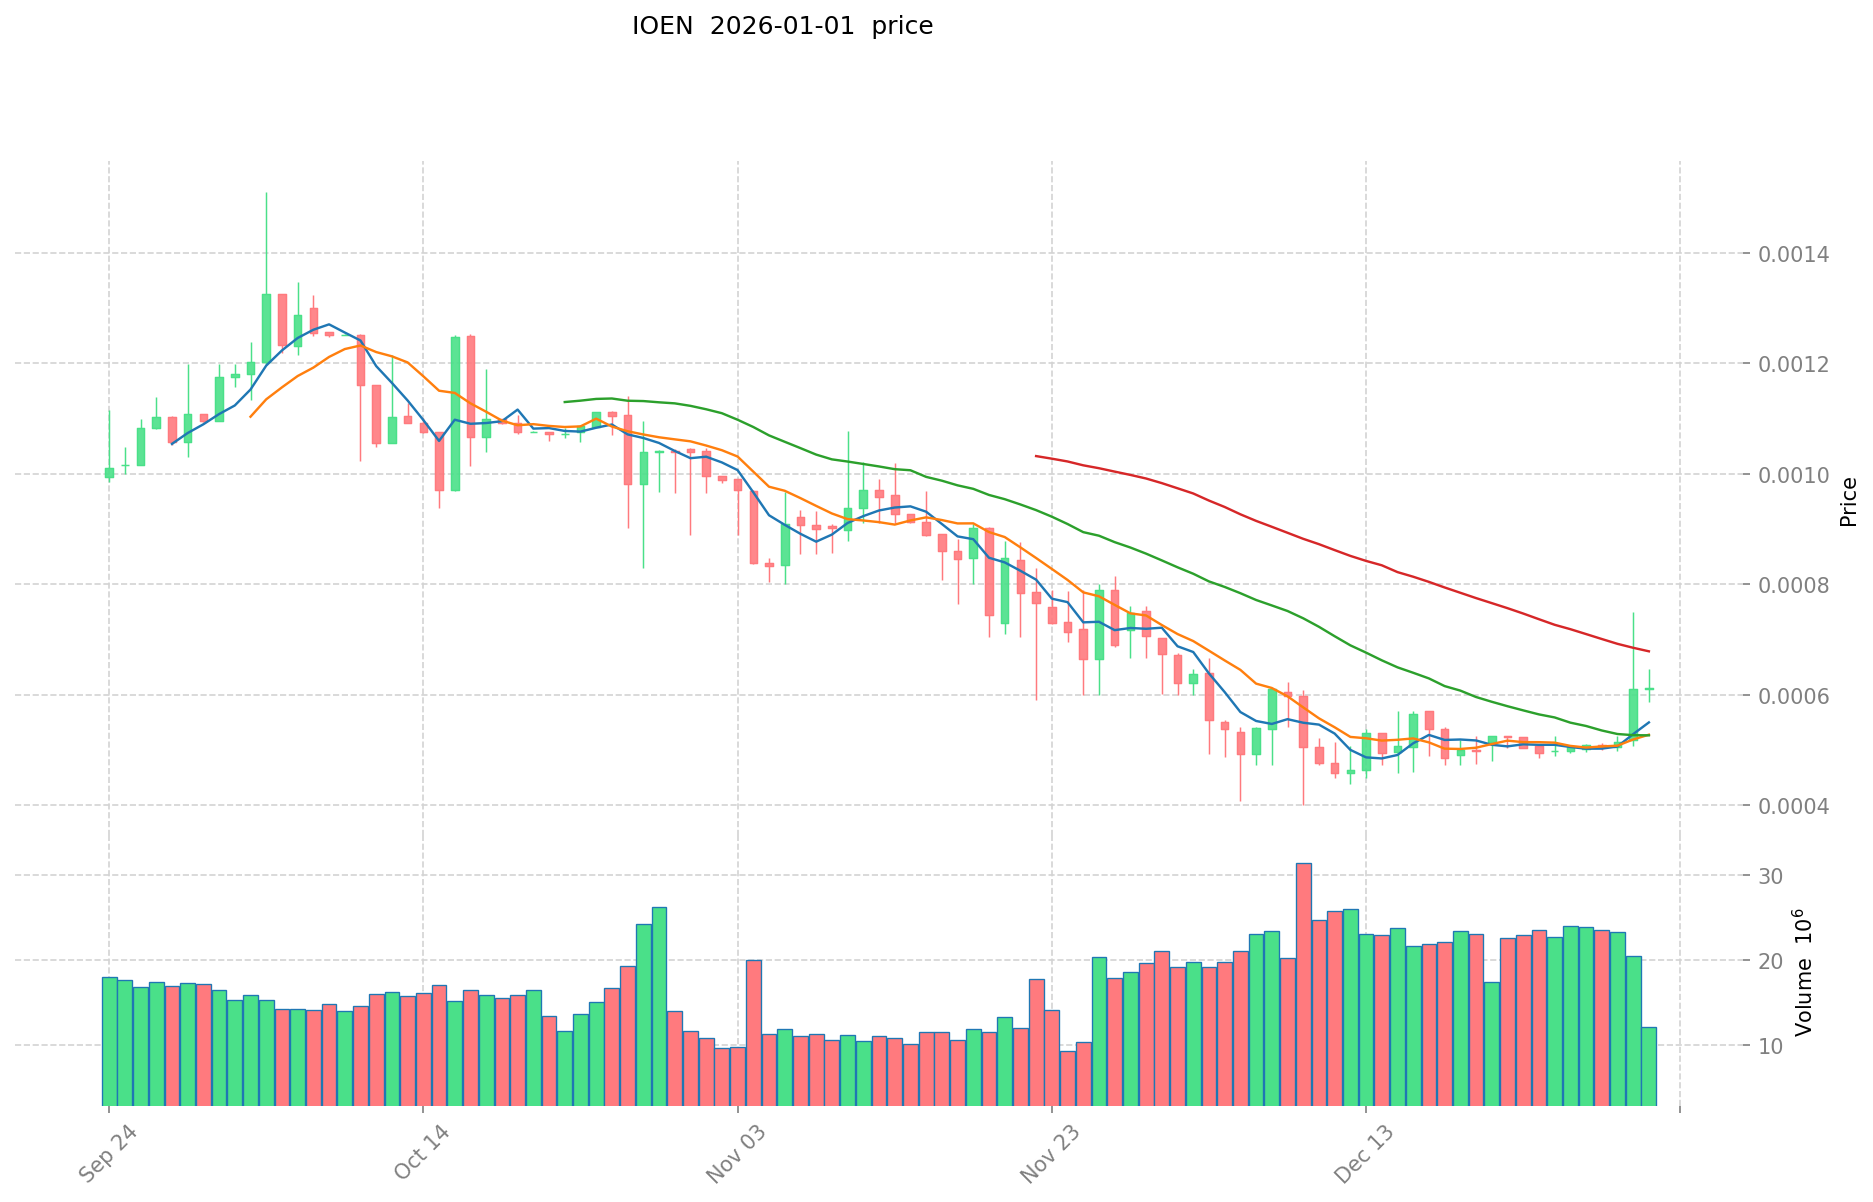
IOEN Historical Price Evolution
-
November 2021: IOEN reached its all-time high (ATH) of $0.442968, representing the project's peak valuation during the bull market cycle.
-
December 2025: IOEN hit its all-time low (ATL) of $0.00040894, marking the lowest point in the token's trading history.
-
2021-2025: The token experienced a significant decline of approximately 72.53% over the one-year period, reflecting prolonged bearish market conditions.
IOEN Current Market Status
As of January 2, 2026, IOEN is trading at $0.0006263, representing a -3.03% decline in the 24-hour period. The token's 24-hour trading range spans from a low of $0.0006115 to a high of $0.0007327.
The current market capitalization stands at approximately $198,569.31, with a fully diluted valuation (FDV) of $69,143.52. This indicates that IOEN's market cap represents approximately 31.71% of its fully diluted valuation, suggesting additional supply expansion potential.
Trading volume over the past 24 hours totaled $4,713.64, demonstrating modest liquidity. The token maintains a market dominance of 0.0000021% across the broader cryptocurrency ecosystem, placing it at rank 4,148 by market capitalization.
From a supply perspective, IOEN has a circulating supply of 317,051,435 tokens out of a total supply of 110,400,000, with a maximum supply cap of 1,000,000,000 tokens. The token currently has 978 unique holders.
The 7-day performance shows resilience with a +24.32% gain, while the 30-day performance reflects modest growth at +2.19%. However, the one-year performance remains significantly negative at -72.53%.
Check the current IOEN market price
IOEN Market Sentiment Index
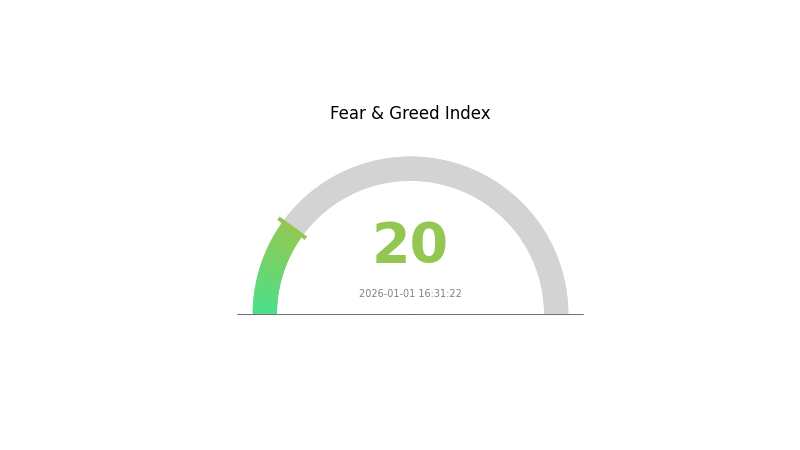
2026-01-01 Fear and Greed Index: 20 (Extreme Fear)
Click to view the current Fear & Greed Index
The cryptocurrency market is experiencing extreme fear with an index reading of 20. This significant level indicates strong negative sentiment among investors, suggesting heightened uncertainty and risk aversion across the digital asset space. When fear reaches such extreme levels, it often presents contrarian opportunities for experienced traders. Market participants should exercise caution while monitoring potential entry points. Stay informed through Gate.com's comprehensive market data tools to navigate these volatile conditions effectively.
IOEN Holdings Distribution
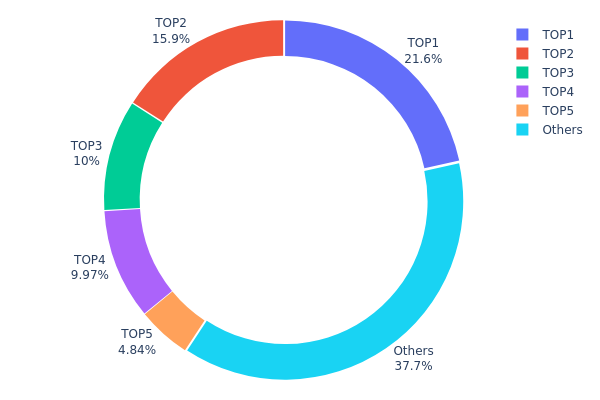
The holdings distribution chart illustrates the concentration of IOEN tokens across blockchain addresses, revealing the degree of token centralization and the distribution pattern among major holders. This metric serves as a critical indicator of the token's market structure, governance dynamics, and susceptibility to potential price volatility driven by large stakeholders.
IOEN currently exhibits moderate concentration characteristics. The top five addresses collectively control approximately 62.3% of the total token supply, with the largest holder commanding 21.57% and the second-largest holding 15.94%. While this concentration level is noteworthy, the remaining 37.7% distribution among other addresses suggests a degree of decentralization that mitigates extreme concentration risk. The relatively even distribution among the top four holders, each maintaining holdings between 9.96% and 21.57%, indicates that no single actor possesses overwhelming dominance, reducing the likelihood of unilateral market manipulation.
This address distribution pattern reflects a market structure with balanced stakeholder representation. The significant portion held by the top five entities, coupled with the substantial minority stake held by dispersed smaller holders, suggests that IOEN maintains a reasonably diversified holder base. This configuration typically supports more stable price dynamics and reduces execution risk for large transactions. The current holdings architecture indicates a developing ecosystem where institutional or strategic entities hold meaningful stakes alongside a growing community of distributed token holders, creating a relatively resilient on-chain structure.
Click to view current IOEN holdings distribution
| Top |
Address |
Holding Qty |
Holding (%) |
| 1 |
0x7930...f75014 |
215713.96K |
21.57% |
| 2 |
0x40ec...5bbbdf |
159429.25K |
15.94% |
| 3 |
0x328e...f8969f |
100000.10K |
10.00% |
| 4 |
0x1ebd...6038f6 |
99691.83K |
9.96% |
| 5 |
0x0d07...b492fe |
48387.08K |
4.83% |
| - |
Others |
376777.78K |
37.7% |
Core Factors Influencing IOEN's Future Price
Macro Economic Environment
Monetary Policy Impact
Central bank policy divergence is expected to shape 2026. The Federal Reserve is entering a confirmed rate-cutting cycle, while the Bank of Japan moves into a tightening phase. European and Chinese central banks are likely to maintain current positions. This monetary fragmentation will create varying investment attractiveness across different cryptocurrency and digital asset markets.
Inflation Hedge Properties
The deflation phenomenon driven by AI advancement ("tech deflation") is emerging as a key macroeconomic theme for 2026. While traditional sectors may experience inflationary pressures, AI-related areas are generating deflationary effects through technological progress. Cryptocurrencies and digital assets are repositioning from traditional inflation hedges toward credit-risk hedging instruments, similar to how gold's valuation logic has shifted from inflation protection to geopolitical risk mitigation.
Geopolitical Factors
Geopolitical conflicts have transitioned from tail risks to primary market drivers. Trade policy uncertainty, particularly following major geopolitical developments, creates volatility across all asset classes including digital currencies. The normalization of conflict-driven disruptions means investors must factor persistent geopolitical premiums into long-term crypto asset positioning strategies.
Institutional and Market Structure Dynamics
Institutional Adoption
Institutional participation is increasingly reshaping crypto market structure in 2026. Unlike retail-driven cycles of previous years, current market movements are predominantly guided by institutional capital flows. The passage of regulatory clarity frameworks—such as the Digital Asset Market Structure Act—is expected to reduce policy uncertainty and encourage deeper participation from banks and asset management firms in cryptocurrency markets.
Regulatory Environment
Regulatory clarity represents a pivotal transition point for the crypto industry. Improved regulatory frameworks are lowering policy uncertainty and establishing compliant pathways for traditional financial institutions to participate in digital asset markets. This institutional foundation-building, while not necessarily driving near-term price appreciation, is supporting long-term infrastructure development and market maturation.
Market Structure Evolution
The crypto market is transitioning from narrative-driven cycles to structure-dependent fundamentals. Perpetual futures contracts are emerging as critical price discovery mechanisms, with derivatives volumes dominating most major trading venues. Stablecoin infrastructure and payment functionality are gaining prominence as practical value drivers, with projected supply growth of approximately 60% by end-2026, with USD-denominated stablecoins maintaining dominance above 99% market share.
III. 2026-2031 IOEN Price Forecast
2026 Outlook
- Conservative Forecast: $0.0005 - $0.00068
- Neutral Forecast: $0.00068 - $0.00098
- Optimistic Forecast: $0.00098 (requires sustained market recovery and increased institutional adoption)
2027-2029 Medium-term Outlook
- Market Stage Expectation: Gradual accumulation phase with increasing market recognition and potential ecosystem expansion
- Price Range Forecast:
- 2027: $0.00074 - $0.00103
- 2028: $0.00065 - $0.00127
- 2029: $0.00091 - $0.00125
- Key Catalysts: Enhanced protocol functionality, strategic partnerships, improved liquidity on major platforms including Gate.com, and broader adoption within the blockchain ecosystem
2030-2031 Long-term Outlook
- Base Case Scenario: $0.00114 - $0.0014 (assuming steady market development and moderate adoption growth)
- Optimistic Scenario: $0.00117 - $0.00179 (with accelerated ecosystem integration and mainstream market penetration)
- Transformative Scenario: $0.00179+ (under conditions of breakthrough technological innovations and significant industry-wide adoption milestones)
- 2026-01-02: IOEN current baseline (market entry point for long-term positioning)
| 年份 |
预测最高价 |
预测平均价格 |
预测最低价 |
涨跌幅 |
| 2026 |
0.00098 |
0.00068 |
0.0005 |
8 |
| 2027 |
0.00103 |
0.00083 |
0.00074 |
32 |
| 2028 |
0.00127 |
0.00093 |
0.00065 |
48 |
| 2029 |
0.00125 |
0.0011 |
0.00091 |
75 |
| 2030 |
0.0014 |
0.00117 |
0.00114 |
87 |
| 2031 |
0.00179 |
0.00129 |
0.00072 |
105 |
IOEN Investment Strategy and Risk Management Report
IV. IOEN Professional Investment Strategy and Risk Management
IOEN Investment Methodology
(1) Long-Term Holding Strategy
- Suitable Investors: Energy sector enthusiasts, blockchain believers, and impact-focused investors seeking exposure to renewable energy innovation
- Operational Recommendations:
- Establish a dollar-cost averaging (DCA) plan to accumulate IOEN tokens gradually, reducing timing risk given the token's high volatility
- Monitor the project's development milestones and protocol adoption rates across clean energy microgrids
- Set long-term targets aligned with the maturation of the blockchain-powered energy economy
(2) Active Trading Strategy
- Technical Analysis Considerations:
- Price Action: Given IOEN's significant volatility (currently trading at $0.0006263, down from all-time high of $0.442968), track support and resistance levels carefully
- Volume Analysis: Monitor the 24-hour trading volume of $4,713.64 to assess liquidity and potential price movements
- Trading Considerations:
- Be cautious of the token's illiquidity, with limited exchange presence (currently trading on 1 exchange)
- Consider timing entries and exits during periods of higher activity
- Account for the token's downside history, including the recent low of $0.00040894
IOEN Risk Management Framework
(1) Asset Allocation Principles
- Conservative Investors: 1-3% of crypto portfolio allocation
- Active Investors: 3-7% of crypto portfolio allocation
- Specialized/Professional Investors: 7-15% of crypto portfolio allocation
(2) Risk Hedging Strategies
- Position Sizing: Limit individual IOEN holdings to a percentage aligned with your risk tolerance, given the token's micro-cap status (market cap of $69,143.52)
- Liquidity Management: Maintain awareness of the token's concentration risk with only 978 token holders
(3) Secure Storage Solutions
- Self-Custody Option: Use Gate Web3 Wallet for secure, non-custodial storage of IOEN tokens
- Exchange Custody: Alternatively, maintain holdings on Gate.com with appropriate security measures (two-factor authentication and withdrawal whitelisting)
- Security Precautions: Never share private keys, use hardware verification for large transactions, and regularly review account activity
V. IOEN Potential Risks and Challenges
IOEN Market Risk
- Extreme Volatility: IOEN has experienced severe price fluctuations, declining 72.53% over the past year and recently hitting new lows, creating significant portfolio drawdown risk
- Liquidity Risk: With only one exchange listing and minimal trading volume, investors may face difficulty executing large positions without significant slippage
- Market Capitalization Risk: The token's ultra-low market cap ($69,143.52) makes it susceptible to pump-and-dump dynamics and manipulation
IOEN Regulatory Risk
- Energy Sector Regulations: Changes in renewable energy policies and grid modernization standards across different jurisdictions could impact protocol adoption
- Securities Classification: Regulatory uncertainty regarding token classification in various markets may affect trading accessibility and compliance obligations
- Microgrid Regulations: Evolving regulations around peer-to-peer energy trading and microgrid operations could present adoption barriers
IOEN Technology Risk
- Holochain Integration Risk: The project's reliance on both blockchain and Holochain technologies introduces dual-system complexity and potential technical vulnerabilities
- Protocol Adoption Risk: The success of IOEN depends on widespread adoption among energy devices and users, which remains unproven at scale
- Development Stage Risk: Limited information on technical progress suggests the project may still be in early development phases
VI. Conclusion and Action Recommendations
IOEN Investment Value Assessment
IOEN presents a speculative opportunity in the emerging intersection of blockchain technology and renewable energy infrastructure. The project's vision of enabling peer-to-peer energy trading through distributed protocols addresses a genuine market need. However, the token currently exhibits characteristics of an extremely early-stage, illiquid asset with significant downside risk. The project's modest market cap, limited exchange presence, and small holder base indicate it remains in the pre-mainstream adoption phase. While the conceptual framework has merit, investors should approach IOEN with appropriate caution given the current trading environment and the project's execution risks.
IOEN Investment Recommendations
✅ Beginners: Avoid or allocate only a minimal speculative position (0.1-1% of crypto holdings) after thorough research. Consider waiting for improved liquidity and broader market validation before participation.
✅ Experienced Traders: May conduct limited swing trading using Gate.com's platform with strict stop-loss discipline. Maintain awareness of the illiquidity risk and avoid over-leveraging on this micro-cap asset.
✅ Institutional Investors: Not recommended for institutional allocation given the lack of sufficient liquidity, market infrastructure, and project validation. The risks outweigh potential returns for large capital deployment.
IOEN Trading Participation Methods
- On Gate.com: Directly trade IOEN tokens through Gate.com's spot trading platform
- Secure Storage: Transfer tokens to Gate Web3 Wallet for non-custodial holdings with personal key control
- Dollar-Cost Averaging: Execute periodic small purchases on Gate.com to manage entry price risk
Cryptocurrency investment carries extreme risk. This report does not constitute investment advice. Investors should make decisions based on personal risk tolerance and professional financial consultation. Never invest funds you cannot afford to lose entirely.
FAQ
What is the current price of IOEN token? What are the historical high and low prices?
IOEN current price is BTC0.087375. Historical high price reached BTC0.056912, while historical low price is BTC0.084414. The token has shown a 29.60% increase over the past 7 days.
What are the main factors affecting IOEN price?
IOEN price is primarily influenced by underlying asset prices, market volatility, interest rates, and expiration dates. Rising asset prices typically increase IOEN value, while market fluctuations and rate changes directly impact pricing.
What is the IOEN price prediction for 2024/2025?
Based on market analysis, IOEN was predicted to reach approximately $0.000735 in 2024, representing a potential 32% return on investment. This projection reflects the network's development trajectory and adoption metrics during that period.
What are the advantages and disadvantages of IOEN compared to similar tokens?
IOEN's advantages include innovative trading mechanisms and efficient transaction processes. Disadvantages involve potential IP/geographic restrictions and scalability challenges that may impact platform expansion and user growth.
What risks should I pay attention to when investing in IOEN tokens?
IOEN token investment risks include token credit dependency on issuers, high market volatility, and potential policy changes. Capital gains taxes apply to profits, and losses can offset future returns. Invest carefully and conduct thorough research.
* The information is not intended to be and does not constitute financial advice or any other recommendation of any sort offered or endorsed by Gate.