# IOEN Price Prediction: Expert Analysis and Market Forecast for 2026-2031
## Article Overview
This comprehensive analysis examines IOEN (Internet of Energy Network) as a blockchain-based clean energy trading protocol, currently trading at $0.0005104 with an 80% yearly decline. The article provides institutional-grade price forecasts spanning 2026-2031, integrating macroeconomic factors, regulatory developments, and market structure analysis. Designed for investors ranging from beginners to institutions, it delivers actionable trading strategies on Gate, risk management frameworks, and detailed volatility assessments. By combining technical metrics, holdings distribution analysis, and sentiment indicators, this guide equips readers with data-driven insights for navigating IOEN's micro-cap market dynamics while emphasizing extreme risk considerations and realistic profit expectations.
Introduction: Market Position and Investment Value of IOEN
Internet of Energy Network (IOEN) is a community-driven protocol designed to enable connectivity and value exchange between any energy device, user, or market within clean energy microgrids. As of January 2, 2026, IOEN has established itself in the energy sector with a market capitalization of $161,823.05 and a circulating supply of approximately 317,051,435 tokens, currently trading at $0.0005104 per token. This innovative asset, which represents the convergence of blockchain technology and decentralized energy systems, is playing an increasingly significant role in the emerging clean energy economy powered by blockchain and Holochain technologies.
This article will conduct a comprehensive analysis of IOEN's price trends from 2026 through 2031, integrating historical performance patterns, market supply and demand dynamics, ecosystem development, and macroeconomic factors to deliver professional price forecasts and practical investment strategies for investors seeking exposure to this emerging energy infrastructure sector.
I. IOEN Price History Review and Current Market Status
IOEN Historical Price Trajectory
- 2021: Project gained market attention, reaching an all-time high of $0.442968 on November 16, 2021
- 2022-2025: Extended bear market period, with significant price depreciation as market conditions deteriorated
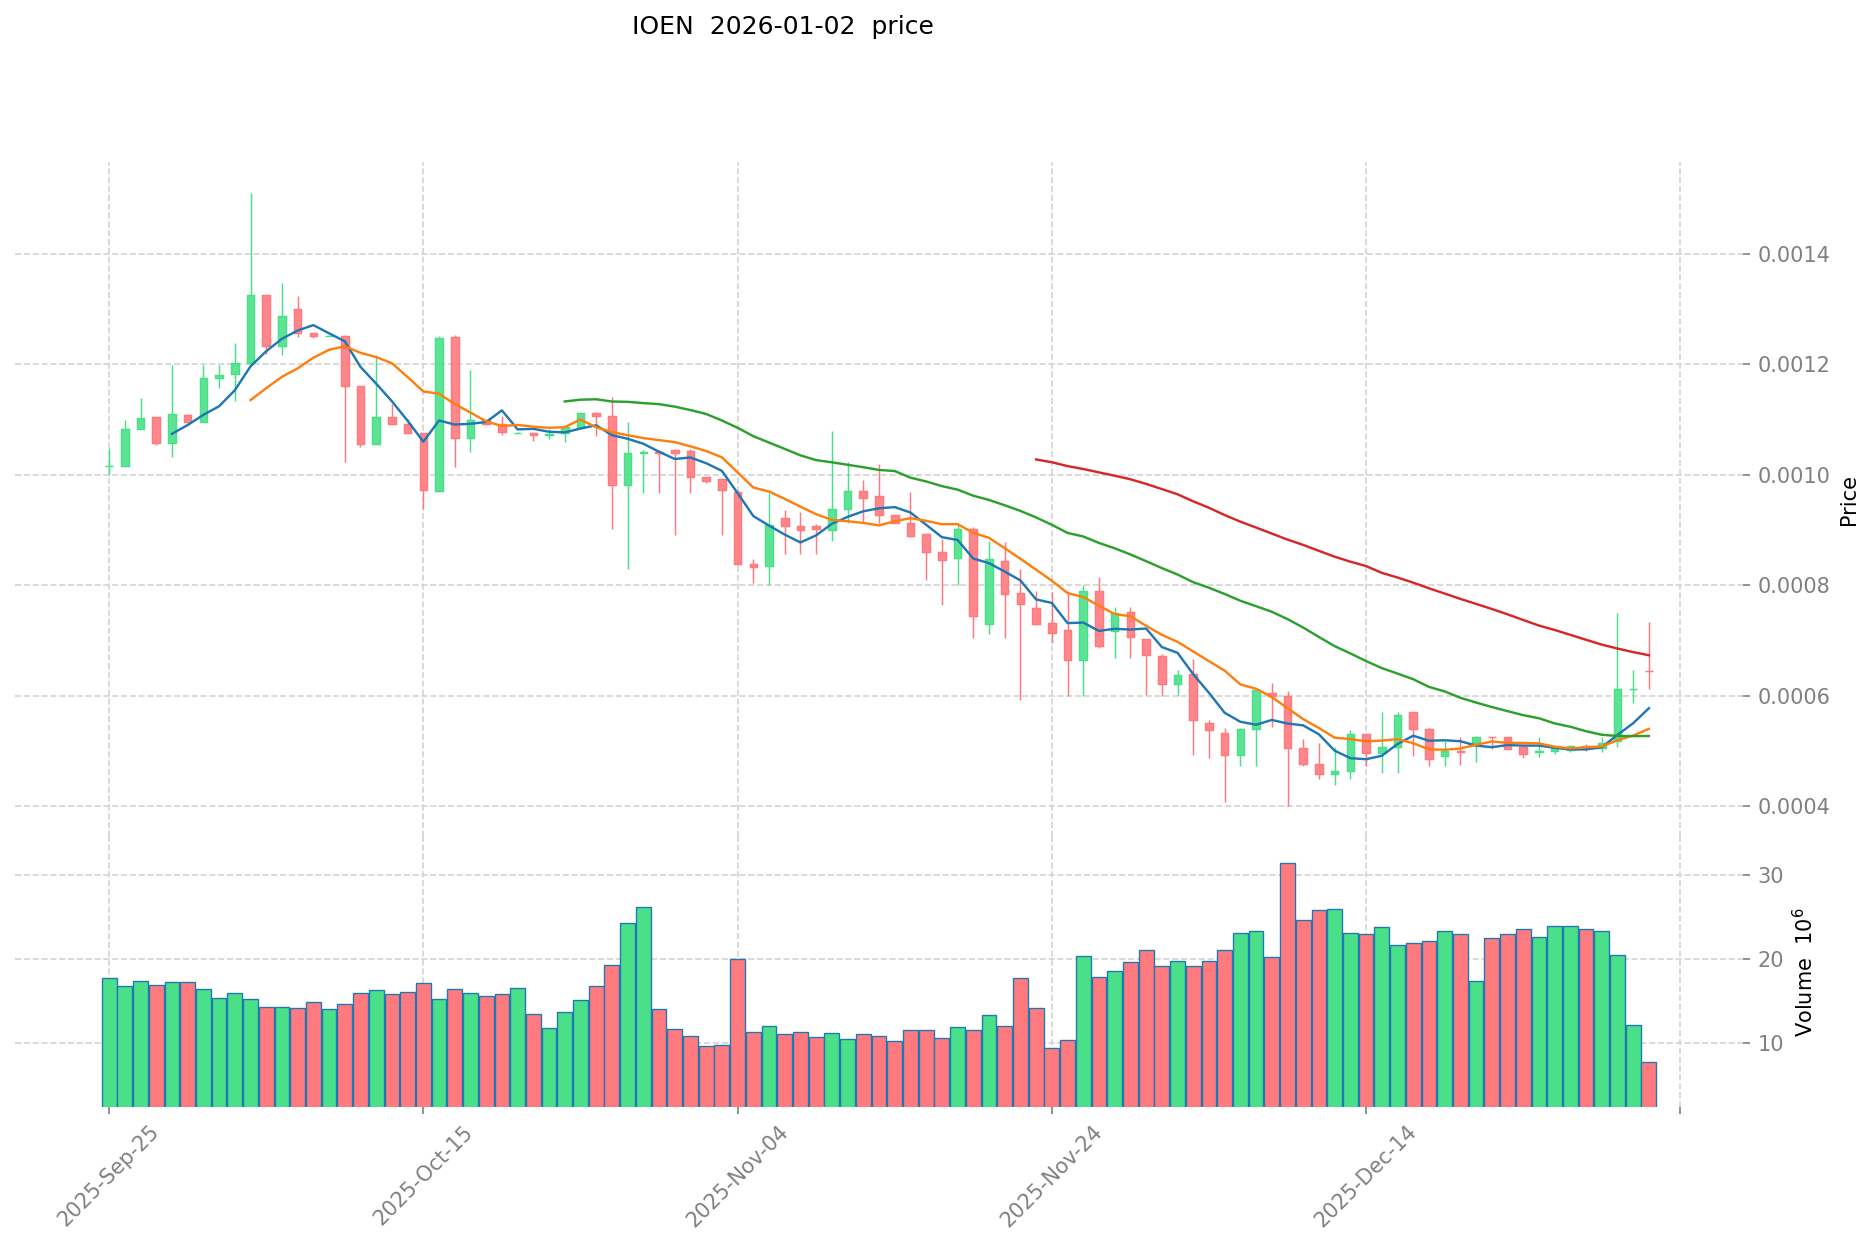
- December 2025: Hit an all-time low of $0.00040894 on December 5, 2025, marking the lowest point in the token's trading history
IOEN Current Market Situation
As of January 2, 2026, IOEN is trading at $0.0005104, representing a dramatic decline of approximately 77.94% over the past year. The token has experienced severe downward pressure in recent periods, with a 21.81% drop over the last 24 hours and a 20.34% decline over the past 30 days. However, there are modest signs of recovery on the weekly timeframe, with a 1.92% gain over the past 7 days.
The token's market metrics reflect its current depressed valuation. With a market capitalization of $161,823.05 and a fully diluted valuation of $56,348.16, IOEN ranks 4,376th among all cryptocurrencies by market cap. The circulating supply stands at 317,051,435 tokens out of a total supply of 110,400,000, with a maximum supply cap of 1,000,000,000 tokens. Daily trading volume is recorded at $6,435.76, indicating relatively low liquidity. The token is held by 976 addresses, demonstrating a dispersed holder base.
The Internet of Energy Network (IOEN) is a community-driven protocol designed to enable connectivity and value exchange between energy devices, users, and markets. It functions as a protocol for connecting devices within clean energy microgrids, allowing them to trade energy directly with one another. The project aims to establish a new energy economy powered by blockchain and Holochain technologies, serving as an open standard for facilitating value flow across any energy device, user, or market.
IOEN is built on the Ethereum blockchain and can be traded on Gate.com.
Click to view current IOEN market price
IOEN Market Sentiment Index
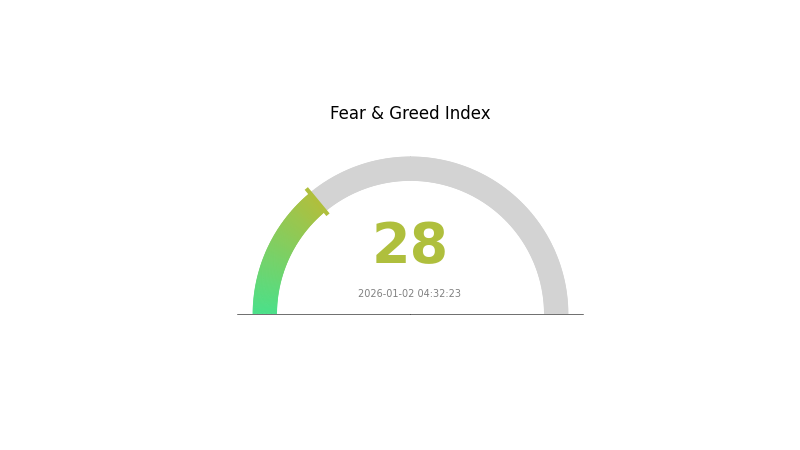
2026-01-02 Fear and Greed Index: 28 (Fear)
Click to view the current Fear & Greed Index
The cryptocurrency market is currently experiencing a fear-dominated sentiment with an index reading of 28. This indicates significant market anxiety and risk aversion among investors. When fear levels are this pronounced, it often creates excellent buying opportunities for long-term investors, as assets tend to be undervalued. However, caution is still advised as volatility may persist. Market participants should maintain a diversified portfolio and consider dollar-cost averaging strategies during such fearful periods. Monitor Gate.com's market data tools to track sentiment shifts and make informed trading decisions.
IOEN Holdings Distribution
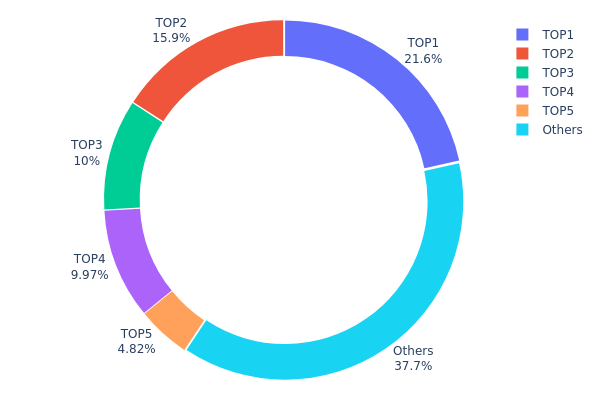
The holdings distribution chart illustrates the concentration of token ownership across blockchain addresses, serving as a critical metric for assessing the decentralization level and market structure of IOEN. By analyzing the top holders and the distribution of remaining addresses, investors and analysts can evaluate potential risks related to token concentration, price volatility susceptibility, and market manipulation risks.
IOEN currently exhibits a moderate concentration pattern with notable concentration among the top five addresses. The leading address (0x7930...f75014) controls 21.57% of total holdings, while the second-largest holder (0x40ec...5bbbdf) maintains 15.89%. Combined, the top two addresses account for 37.46% of all tokens in circulation. The third and fourth addresses hold 10.00% and 9.96% respectively, bringing the cumulative share of the top four addresses to approximately 57.42%. This concentration level indicates a moderately centralized structure, with a significant portion of voting power and market influence concentrated in relatively few addresses. The remaining addresses collectively hold 37.77%, suggesting a fragmented ownership base that may partially offset concerns about extreme centralization.
The current distribution presents a mixed outlook regarding market dynamics and stability. While the top holders' combined stake raises concerns about potential coordinated actions or price manipulation, the substantial proportion held by dispersed addresses provides a degree of decentralization that could mitigate extreme volatility. The concentration ratio suggests IOEN operates in a space between full decentralization and problematic oligopoly control, requiring continued monitoring of large holder movements and potential accumulation or distribution patterns that could signal shifts in market sentiment or governance power.
Click to view current IOEN holdings distribution
| Top |
Address |
Holding Qty |
Holding (%) |
| 1 |
0x7930...f75014 |
215713.96K |
21.57% |
| 2 |
0x40ec...5bbbdf |
158973.20K |
15.89% |
| 3 |
0x328e...f8969f |
100000.10K |
10.00% |
| 4 |
0x1ebd...6038f6 |
99691.83K |
9.96% |
| 5 |
0x0d07...b492fe |
48192.67K |
4.81% |
| - |
Others |
377428.25K |
37.77% |
Core Factors Influencing IOEN's Future Price
Macroeconomic Environment
-
Monetary Policy Impact: Global central banks are entering a phase of policy divergence. The U.S. Federal Reserve is expected to enter a decisive rate-cutting cycle, while the Bank of Japan is moving into a tightening phase. The European Central Bank and China's central bank are likely to maintain a cautious stance. This divergence will reshape global liquidity conditions and capital flows into alternative assets like cryptocurrencies.
-
Inflation Dynamics: While near-term inflation pressures are moderating, the "tech deflation" phenomenon driven by AI advancement may create mixed inflationary environments. Traditional sectors could experience residual inflation pressures, while AI-related sectors may see deflationary impacts from technological productivity improvements.
-
Geopolitical Factors: Geopolitical tensions have transitioned from tail risks to primary market drivers. Trade conflicts, regional conflicts, and currency volatility—particularly around the Japanese yen—create systemic spillover effects across global markets, including cryptocurrency markets. This heightened geopolitical uncertainty increases demand for alternative value-storage assets.
Regulatory Development and Institutional Adoption
-
Regulatory Framework Evolution: The passing of legislation such as the U.S. Digital Asset Market Structure Clarity Act represents a critical inflection point. As regulatory frameworks become clearer and more comprehensive at the federal level, institutional barriers to cryptocurrency participation diminish. This institutional deepening transforms market dynamics from narrative-driven speculation to structure-driven institutional participation.
-
Institutional Capital Inflows: Declining policy uncertainty and improved compliance pathways encourage deeper participation from banks and asset managers. Major financial institutions are increasingly establishing cryptocurrency Treasury strategies and allocation frameworks, fundamentally altering capital flow patterns into the digital asset space.
-
ETF Product Expansion: The SEC's provision of standardized listing criteria has accelerated cryptocurrency ETF launches. These products democratize access to digital assets and enable institutional allocation through traditional financial channels, creating more scalable and compliant investment mechanisms.
Macro Imbalance and Value Storage Demand
-
Debt and Fiscal Pressures: Global fiscal deficits remain elevated, and debt-to-GDP ratios continue rising across developed economies. Central banks' capacity to normalize policy remains constrained by debt servicing concerns. This structural imbalance creates persistent demand for alternative value-storage instruments that transcend traditional currency frameworks.
-
Currency Debasement Risk: With expectations of weaker U.S. dollar performance in 2026 and concerns about purchasing power erosion, investors increasingly allocate to assets perceived as portable, transferable, and scarce. Bitcoin and similar cryptocurrencies function as hedges against currency debasement and monetary policy uncertainty.
-
Asset Rotation Effects: As traditional safe-haven assets like gold and silver rally on value-storage narratives (gold up 60%+ in 2025, silver up 175%), cryptocurrency benefits from similar risk-on flows. Market participants incorporating digital assets into their value-storage allocation framework creates synchronized demand patterns.
Market Structure and Derivatives Development
-
Perpetual Futures as Price Discovery Mechanism: Derivatives trading volumes now dominate major venues, with perpetual contracts serving as the primary price discovery mechanism. The market structure has transitioned from retail-driven speculation to institutional-grade financial infrastructure with stricter margin requirements and risk management protocols, reducing systemic collapse risks while creating more resilient market microstructure.
-
Stablecoin Infrastructure Growth: Stablecoin supplies are projected to expand by approximately 60% through 2026, with U.S. dollar stablecoins maintaining 99%+ dominance. This infrastructure expansion enables more efficient settlement, cross-border transfers, and liquidity management, reducing friction in cryptocurrency trading ecosystems.
-
Prediction Market Development: Prediction markets are transitioning from experimental products to persistent financial infrastructure, attracting non-crypto-native participants and improving market pricing mechanisms through broader participation.
Market Sentiment and Positioning
-
Institutional Underexposure: Despite macroeconomic fundamentals supporting digital asset valuations, institutional cryptocurrency allocation remains compressed relative to historical levels. Low search volume for Bitcoin, reduced social media activity, and below-average positioning create significant upside risk once sentiment inflects, potentially triggering forced rebalancing flows.
-
Market Structure Resilience: Unlike previous cycles dominated by retail leverage and forced liquidations, 2026's market structure is anchored by institutional participation with improved risk management. While 2025 experienced deleveraging adjustments in derivatives markets, this represents structural reset rather than demand destruction, improving market resilience for absorbing shocks.
Disclaimer: This analysis is based on publicly available information and institutional perspectives as of January 2, 2026. Cryptocurrency markets remain highly volatile and speculative. This content is for informational purposes only and should not be considered investment advice. Please conduct thorough research through platforms like Gate.com before making investment decisions.
III. 2026-2031 IOEN Price Forecast
2026 Outlook
- Conservative Forecast: $0.00038-$0.00051
- Neutral Forecast: $0.00051 (average expected price)
- Optimistic Forecast: $0.0006 (requiring sustained market stability and increased adoption)
2027-2029 Medium-term Outlook
- Market Phase Expectation: Gradual recovery and accumulation phase with moderate growth trajectory
- Price Range Forecast:
- 2027: $0.00053-$0.00069 (8% increase)
- 2028: $0.00051-$0.00086 (22% increase)
- 2029: $0.00056-$0.0008 (45% increase)
- Key Catalysts: Ecosystem development progress, increased institutional interest, and market sentiment improvement
2030-2031 Long-term Outlook
- Base Case Scenario: $0.00045-$0.00111 (50% increase by 2030, assuming steady market expansion)
- Optimistic Scenario: $0.00078-$0.00119 (84% cumulative increase by 2031, assuming accelerated adoption and positive regulatory environment)
- Transformation Scenario: $0.00119+ (assuming breakthrough in technology integration, major partnership announcements, and strong market-wide recovery conditions)
- 2026-01-02: IOEN at current baseline (consolidation phase with neutral market positioning)
| 年份 |
预测最高价 |
预测平均价格 |
预测最低价 |
涨跌幅 |
| 2026 |
0.0006 |
0.00051 |
0.00038 |
0 |
| 2027 |
0.00069 |
0.00056 |
0.00053 |
8 |
| 2028 |
0.00086 |
0.00063 |
0.00051 |
22 |
| 2029 |
0.0008 |
0.00074 |
0.00056 |
45 |
| 2030 |
0.00111 |
0.00077 |
0.00045 |
50 |
| 2031 |
0.00119 |
0.00094 |
0.00078 |
84 |
IOEN Investment Strategy and Risk Management Report
IV. IOEN Professional Investment Strategy and Risk Management
IOEN Investment Methodology
(1) Long-term Holding Strategy
- Suitable for: Investors with conviction in renewable energy tokenization and blockchain-based energy trading ecosystems
- Operational recommendations:
- Accumulate IOEN during market downturns, particularly given the -77.94% decline over the past year, which may present entry opportunities for long-term believers
- Monitor project development milestones related to clean energy microgrid connectivity and protocol adoption
- Establish a multi-year holding horizon to allow the project's energy economy vision to mature and scale
(2) Active Trading Strategy
- Technical Analysis Tools:
- Support and Resistance Levels: Utilize the 24-hour range ($0.0004482 to $0.0007327) as immediate trading boundaries; monitor historical levels
- Volume Analysis: Track the relatively modest 24-hour volume of $6,435.76 to identify periods of increased trading activity and potential breakout opportunities
- Swing Trading Key Points:
- Recent 24-hour decline of -21.81% suggests potential oversold conditions that may warrant tactical entries
- Monitor 7-day positive performance (1.92% gain) against the broader 30-day and 1-year downtrends to identify reversal signals
IOEN Risk Management Framework
(1) Asset Allocation Principles
- Conservative Investors: 0.5-1% portfolio allocation maximum
- Active Investors: 1-3% portfolio allocation, with dollar-cost averaging recommended
- Professional Investors: 3-5% portfolio allocation with structured position sizing and rebalancing protocols
(2) Risk Hedging Solutions
- Diversification Approach: Pair IOEN holdings with established blockchain infrastructure tokens to mitigate project-specific risk
- Position Sizing: Implement strict position limits given the token's micro-cap status (market cap: $56,348.16) and limited liquidity
(3) Secure Storage Solutions
- Hardware Wallet Recommendations: For significant holdings, employ hardware wallets with Ethereum network support to secure the ERC-20 token
- Exchange Custody: For active traders, maintain portions on Gate.com with two-factor authentication and withdrawal whitelisting enabled
- Security Considerations: Treat private keys with extreme caution; utilize multi-signature arrangements for large holdings; avoid storing recovery phrases digitally
V. IOEN Potential Risks and Challenges
IOEN Market Risk
- Extreme Volatility: Historical high of $0.442968 (November 2021) versus current price of $0.0005104 reflects 99.9% decline, indicating severe price instability and potential for significant losses
- Liquidity Risk: Limited trading volume ($6,435.76 in 24 hours) and only 976 token holders create poor exit liquidity; large position sales could trigger price collapses
- Market Cap Concentration: Extremely low market capitalization ($56,348.16) classifies IOEN as a micro-cap asset with high susceptibility to whale manipulation
IOEN Regulatory Risk
- Energy Sector Compliance: As an energy-focused protocol, IOEN faces evolving regulatory frameworks across multiple jurisdictions that could impact its utility and value proposition
- Token Classification Uncertainty: Regulatory classification of IOEN as security versus utility token remains ambiguous in several markets, creating potential compliance exposure
- Grid Integration Policy: Government energy policies and smart grid regulations may evolve in ways that either accelerate or hinder the protocol's adoption
IOEN Technical Risk
- Protocol Maturity: Limited public information on active development status, technical roadmap transparency, or implementation of promised features
- Adoption Barriers: Achieving integration with actual clean energy microgrids and real-world energy trading infrastructure remains unproven at scale
- Competition and Standards Risk: Alternative energy trading protocols and established IoT standards may outcompete IOEN's technical approach
VI. Conclusion and Action Recommendations
IOEN Investment Value Assessment
IOEN presents a high-risk, speculative investment opportunity targeting the emerging intersection of decentralized energy trading and blockchain infrastructure. While the conceptual vision of enabling peer-to-peer energy exchange across microgrids through tokenized protocols addresses a genuine market need, the project's severely diminished valuation (99.9% below all-time high) reflects either fundamental challenges in execution or broader market skepticism. The token's micro-cap status, limited liquidity, small holder base, and lack of clear evidence of protocol adoption create substantial execution risk. Investment decisions should be driven by thorough technical due diligence rather than speculative price action.
IOEN Investment Recommendations
✅ Beginners: Avoid this token due to extreme volatility, limited liquidity, and high technical complexity. Focus instead on established blockchain infrastructure projects with proven adoption metrics.
✅ Experienced Investors: Consider micro-allocation (0.5-1% of portfolio) only if you possess strong conviction regarding energy tokenization trends and can withstand potential total loss. Conduct extensive technical and market research before any position establishment.
✅ Institutional Investors: Evaluate IOEN only as part of structured due diligence into emerging energy sector tokens, with position sizing reflecting its speculative nature and liquidity constraints.
IOEN Trading Participation Methods
- Direct Purchase on Gate.com: Access IOEN through Gate.com's token trading interface using ETH or stablecoins; execute trades during periods of elevated volume to minimize slippage
- Spot Trading: Establish and manage positions through Gate.com's spot market with limit orders to control entry and exit pricing
- Long-term Custody: Transfer holdings to secure self-custody solutions for positions intended for multi-year accumulation, reducing counterparty risk
Cryptocurrency investments carry extreme risk. This report does not constitute investment advice. Investors must make decisions aligned with their personal risk tolerance and financial circumstances. Always consult qualified financial advisors before deploying capital. Never invest more than you can afford to lose completely.
FAQ
What is IOEN? What are its main uses and application scenarios?
IOEN is a native token for a decentralized blockchain-based energy trading platform. It enables peer-to-peer energy trading, incentivizes renewable energy producers and consumers, supports platform governance, and facilitates green energy certification and traceability.
What is the historical price trend of IOEN and what are the main factors affecting its price?
IOEN has experienced significant volatility. Key price drivers include market supply and demand dynamics, trading volume, network adoption rates, and broader cryptocurrency market sentiment.
Use time series analysis with machine learning models like LSTM and RNN to forecast IOEN prices. Analyze historical price data, trading volume, and market trends. Python libraries such as TensorFlow and Keras are effective tools for building predictive models.
What is the future outlook of IOEN? What is the project team and development roadmap?
IOEN has strong future prospects with a clear 5-step development roadmap. The experienced team focuses on key milestones and strategic objectives. The project maintains solid technical foundation and continues expanding its ecosystem through innovative features and partnerships.
What are the risks of investing in IOEN? How should investment risks be assessed?
IOEN investment involves market, liquidity, and volatility risks. Assess risks by analyzing project fundamentals, team credibility, trading volume, market capitalization, and historical price movements to make informed decisions.
What are the advantages or disadvantages of IOEN compared to similar tokens?
IOEN offers strong ecosystem integration and innovative use cases in decentralized finance. Its advantages include efficient transaction processing and community-driven governance. Compared to similar tokens, IOEN demonstrates competitive trading volume and solid technical fundamentals for long-term growth potential.
* The information is not intended to be and does not constitute financial advice or any other recommendation of any sort offered or endorsed by Gate.