# 2025 NAOS Price Prediction: Expert Analysis and Market Forecast
## Article Overview
This comprehensive NAOS price prediction guide delivers professional analysis for cryptocurrency investors seeking DeFi lending exposure. The article examines NAOS Finance's market position, historical price trajectories from $3.44 (May 2021) to current levels ($0.00182), and provides detailed forecasts through 2031. Designed for beginners, experienced traders, and institutional investors, it addresses critical investment decisions through supply analysis, macroeconomic factors, and risk management frameworks. Featuring step-by-step trading strategies on Gate, holdings distribution insights, and actionable recommendations, this guide equips stakeholders with data-driven insights for navigating NAOS market volatility and identifying optimal entry points in the recovering DeFi sector.
---
**Article Structure:**
**Section I:** Market Status & Historical Performance - Current pricing, trading volume, sentiment indicators, a
Introduction: NAOS Market Position and Investment Value
NAOS Finance (NAOS) operates as a decentralized finance lending platform that bridges DeFi lenders and small and medium-sized enterprise borrowers through permissionless blockchain interactions. Since its inception in 2021, NAOS Finance has established itself as a bridge between on-chain and off-chain lending ecosystems. As of January 2026, NAOS maintains a market capitalization of approximately $153,285.66, with a circulating supply of 84,222,892.66 tokens and a current price hovering around $0.00182. This specialized asset is playing an increasingly vital role in enabling real-world asset automation and end-to-end lending processes through blockchain infrastructure.
This article will provide a comprehensive analysis of NAOS price movements and market trends, incorporating historical performance patterns, market supply and demand dynamics, ecosystem development, and macroeconomic factors to deliver professional price forecasts and practical investment guidance for stakeholders.
NAOS Finance Market Analysis Report
I. NAOS Price History Review and Current Market Status
NAOS Historical Price Trajectory
- May 2021: Token launch and market peak, reaching an all-time high of $3.44
- 2021-2025: Extended bear market period, price declined significantly from peak levels
- April 2025: New all-time low of $0.00104796 reached, marking the lowest point in token history
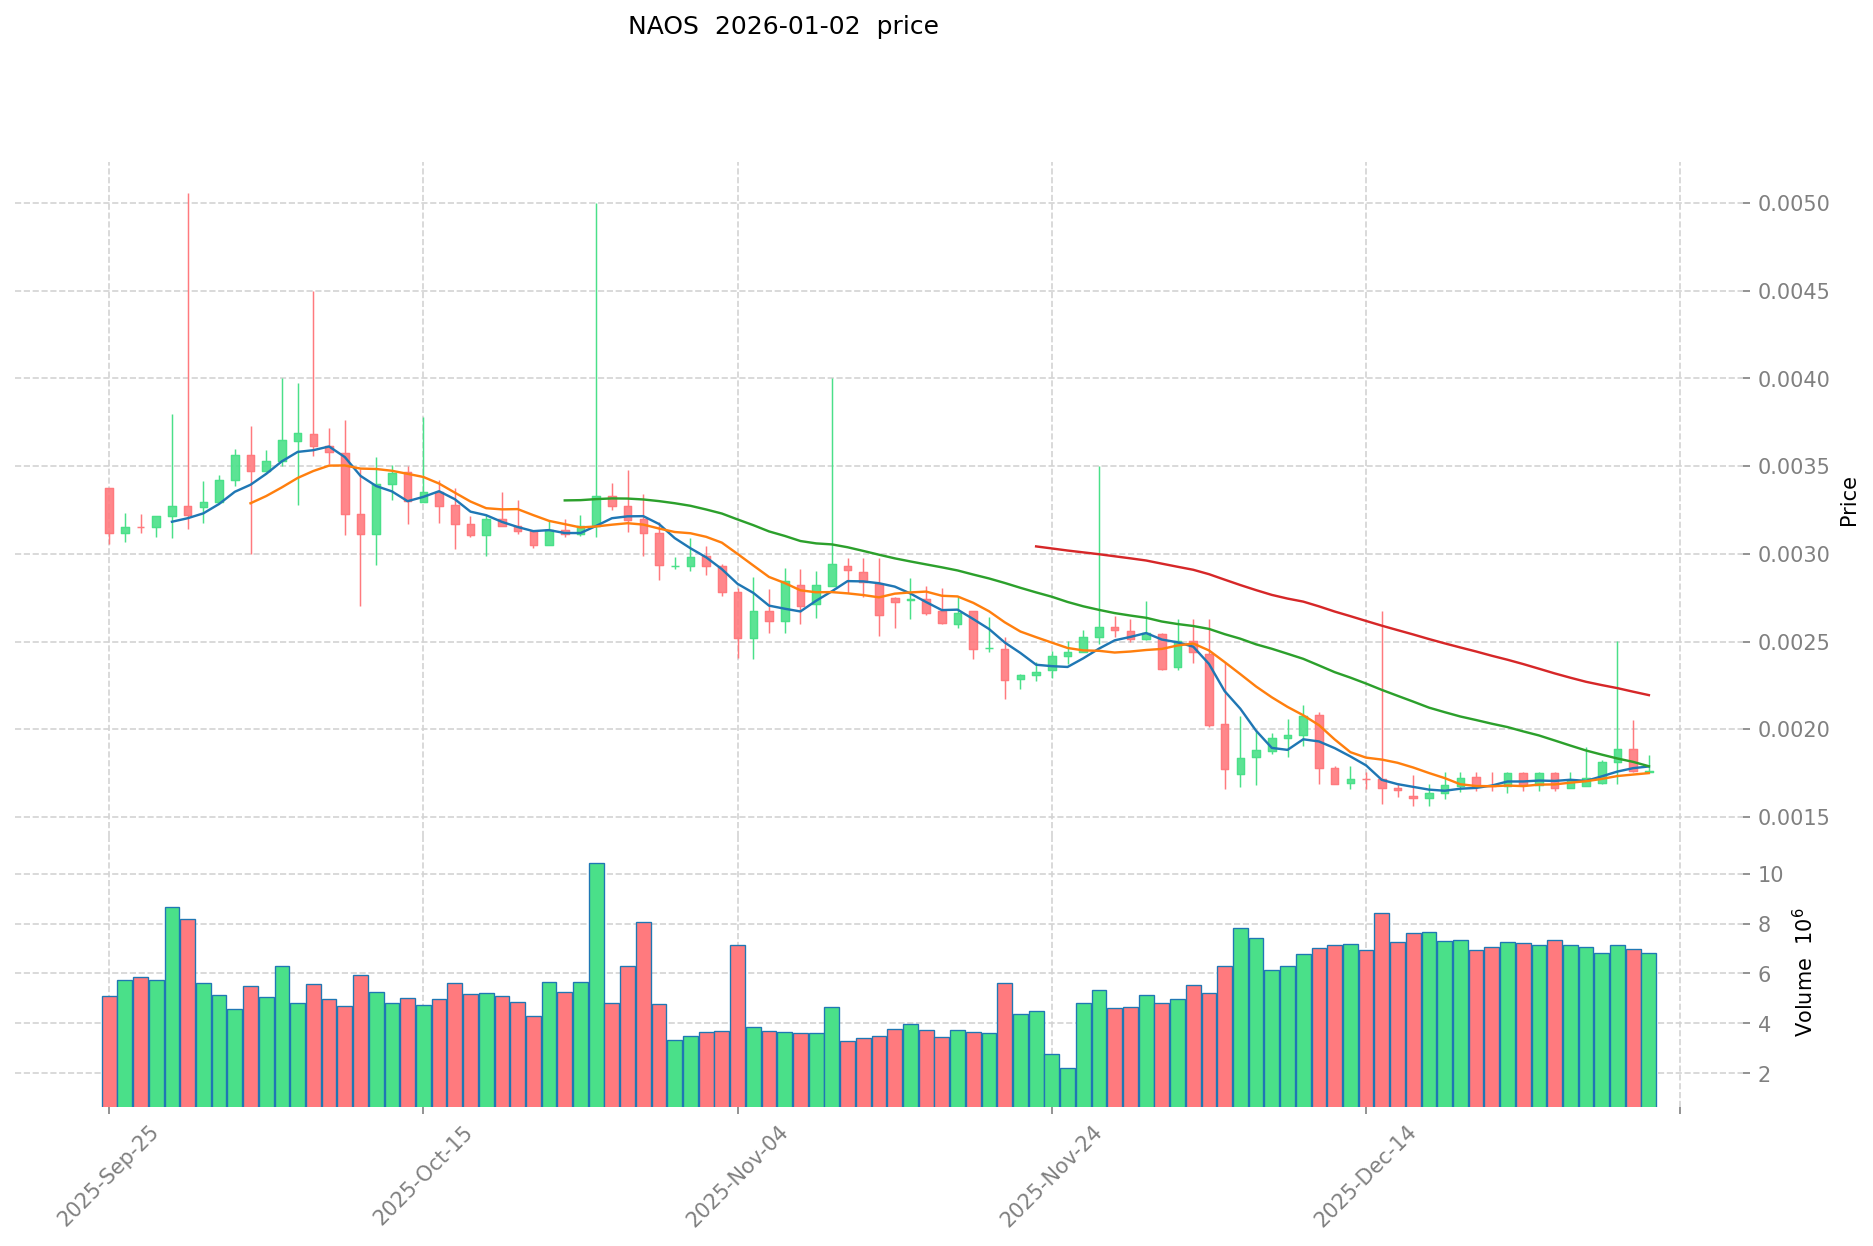
- January 2026: Current price recovery to $0.00182, representing a rebound from recent lows
NAOS Current Market Conditions
As of January 2, 2026, NAOS is trading at $0.00182, with a 24-hour trading volume of $12,643.38. The token has demonstrated short-term positive momentum, with a 1-hour price increase of 2.53% and a 7-day gain of 9.79%. However, the longer-term performance remains challenged, with a 30-day decline of -23.45% and a 1-year loss of -52.11%.
The current circulating supply stands at 84,222,892.66 NAOS tokens out of a total supply of 219,177,144.66, with a maximum supply capped at 300,000,000 tokens. The fully diluted market capitalization is approximately $398,902.40, while the current market capitalization based on circulating supply is $153,285.66. The circulating supply represents 28.07% of the fully diluted valuation.
NAOS maintains a market rank of 4,433 among all cryptocurrencies, with a market dominance of 0.000012%. The token is held by 2,265 unique addresses, indicating a distributed holder base. Trading activity remains relatively modest, with the asset primarily accessible on major cryptocurrency platforms.
View current NAOS market price
NAOS Market Sentiment Indicator
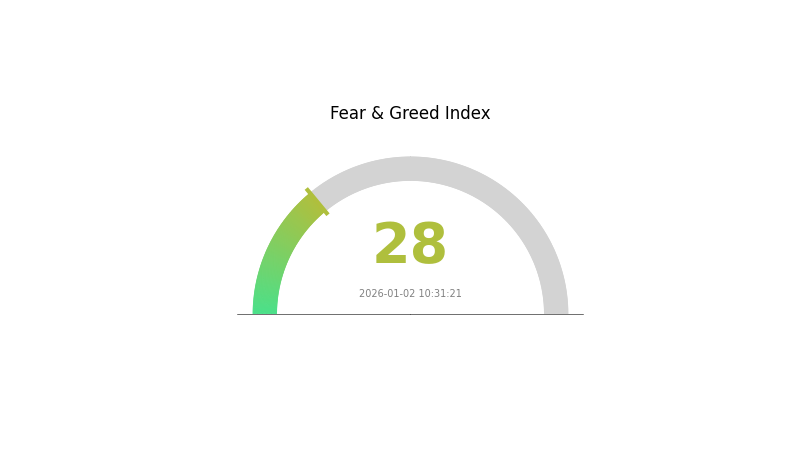
2026-01-02 Fear and Greed Index: 28 (Fear)
Click to view the current Fear & Greed Index
The cryptocurrency market is currently experiencing a fear sentiment with an index reading of 28. This indicates heightened market anxiety and cautious investor behavior. During such periods, opportunities often emerge for long-term investors as asset prices decline. Market participants should exercise prudent risk management and consider their investment strategies carefully. Monitor Gate.com's market data tools to stay informed on sentiment shifts and make data-driven trading decisions during volatile market conditions.
NAOS Holdings Distribution
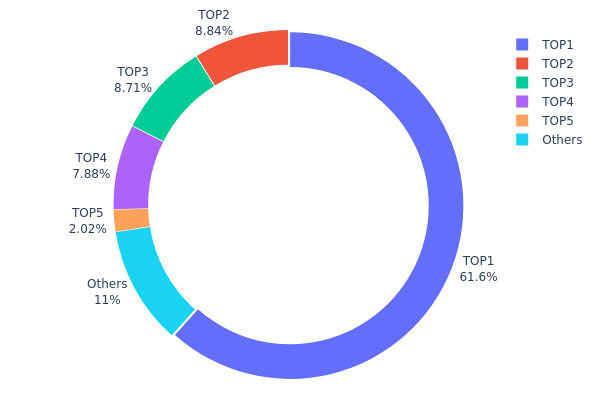
The address holdings distribution represents the concentration of NAOS tokens across blockchain addresses, serving as a critical metric for assessing token decentralization, market structure stability, and potential manipulation risks. This distribution reveals how wealth is concentrated among the largest holders and provides insight into the token's governance resilience and price discovery mechanisms.
NAOS exhibits significant concentration risk, with the top holder commanding 61.57% of total supply—an exceptionally high proportion that substantially exceeds healthy decentralization benchmarks. The top four addresses collectively control 86.97% of all NAOS tokens, indicating pronounced centralization. While the second and third largest holders maintain relatively comparable positions at 8.83% and 8.70% respectively, the dramatic gap between the primary address and secondary holders underscores an imbalanced distribution structure. The remaining addresses, accounting for 11.01% of supply, are fragmented across numerous smaller stakeholders, further emphasizing the outsized influence of the dominant participant.
This concentration pattern presents considerable structural vulnerabilities for NAOS market dynamics. The substantial holdings by the principal address create elevated risks for price manipulation, liquidity constraints during large sell-offs, and potential governance imbalances if token-based voting mechanisms are implemented. The highly concentrated distribution may impede genuine price discovery and increases sensitivity to decisions made by the largest stakeholders. Additionally, such extreme concentration typically undermines market confidence and can deter institutional participation due to counterparty and manipulation concerns. The current distribution reflects a market structure heavily dependent on whale behavior, where the stability and intentions of a single entity disproportionately influence token value trajectories and overall ecosystem sustainability.
Click to view current NAOS Holdings Distribution
| Top |
Address |
Holding Qty |
Holding (%) |
| 1 |
0x4432...a36744 |
134954.25K |
61.57% |
| 2 |
0x9b57...98c35d |
19365.12K |
8.83% |
| 3 |
0x0be4...8b4228 |
19079.80K |
8.70% |
| 4 |
0x533e...ff9648 |
17267.03K |
7.87% |
| 5 |
0x99e4...aef581 |
4433.16K |
2.02% |
| - |
Others |
24077.79K |
11.01% |
II. Core Factors Affecting NAOS Future Price
Supply Mechanism
- Total Token Supply: NAOS has a total supply of 300,000,000 tokens, with a circulating supply of approximately 84,222,892.66 NAOS as of November 28, 2025. This supply structure directly impacts price and investment value.
Macroeconomic Environment
-
DeFi Lending Ecosystem Impact: NAOS is positioned as a permissionless lending and financing platform on the blockchain, connecting DeFi lenders with small and medium-sized enterprise borrowers and bridging on-chain and off-chain assets. Its focus on DeFi lending and SME financing strengthens network utility and increases investment appeal.
-
Market Sentiment and External Factors: Price fluctuations reflect market sentiment, user adoption trends, and external factors affecting the DeFi lending ecosystem. The platform's long-term potential in the DeFi lending sector exists despite significant short-term price volatility risks.
III. 2026-2031 NAOS Price Forecast
2026 Outlook
- Conservative Forecast: $0.00109 - $0.00184
- Base Case Forecast: $0.00184
- Optimistic Forecast: $0.00254 (requires sustained market recovery and increased adoption)
2027-2029 Mid-Term Outlook
- Market Stage Expectation: Gradual accumulation phase with consolidation patterns, characterized by incremental growth and market maturation
- Price Range Forecast:
- 2027: $0.00156 - $0.00278
- 2028: $0.00231 - $0.00284
- 2029: $0.00210 - $0.00367
- Key Catalysts: Ecosystem expansion, institutional interest, improved market liquidity on platforms like Gate.com, and enhanced tokenomic mechanisms
2030-2031 Long-Term Outlook
- Base Case Scenario: $0.00165 - $0.00348 (assumes moderate adoption growth and stable market conditions)
- Optimistic Scenario: $0.00243 - $0.00479 (assumes accelerated ecosystem development and broader cryptocurrency market expansion)
- Transformational Scenario: $0.00479+ (extreme positive conditions including breakthrough partnerships, significant protocol upgrades, and mainstream adoption)
- 2031-12-31: NAOS projected to reach $0.00479 (peak scenario with 82% cumulative appreciation potential)
| 年份 |
预测最高价 |
预测平均价格 |
预测最低价 |
涨跌幅 |
| 2026 |
0.00254 |
0.00184 |
0.00109 |
1 |
| 2027 |
0.00278 |
0.00219 |
0.00156 |
20 |
| 2028 |
0.00284 |
0.00249 |
0.00231 |
36 |
| 2029 |
0.00367 |
0.00266 |
0.0021 |
46 |
| 2030 |
0.00348 |
0.00317 |
0.00165 |
74 |
| 2031 |
0.00479 |
0.00333 |
0.00243 |
82 |
NAOS Finance (NAOS) Professional Investment Strategy and Risk Management Report
IV. NAOS Professional Investment Strategy and Risk Management
NAOS Investment Methodology
(1) Long-term Holding Strategy
- Target Investor Profile: Risk-averse investors seeking exposure to DeFi lending infrastructure with medium to long-term investment horizons
- Operational Recommendations:
- Establish a core position at support levels, with dollar-cost averaging over 3-6 months to reduce entry risk
- Hold through market cycles while monitoring project developments and ecosystem partnerships
- Reinvest any earned yields to compound returns over 2+ year periods
(2) Active Trading Strategy
NAOS Risk Management Framework
(1) Asset Allocation Principles
- Conservative Investors: 1-2% of total portfolio
- Moderate Investors: 2-5% of total portfolio
- Aggressive Investors: 5-10% of total portfolio
(2) Risk Hedging Solutions
- Position Sizing Hedging: Limit single position size to 3-5% of total capital to minimize downside exposure from potential 50%+ corrections
- Diversification Across DeFi: Balance NAOS holdings with other established DeFi protocol tokens to reduce concentration risk
(3) Secure Storage Solutions
- Hot Wallet Approach: Use Gate.com's integrated wallet for active trading and frequent transactions with enhanced 2FA security
- Cold Storage Method: Transfer long-term holdings to self-custody solutions with hardware security for amounts exceeding $10,000 USD equivalent
- Security Considerations: Enable withdrawal whitelisting, use non-reusable addresses for each transaction, and maintain encrypted backup of private keys in multiple secure locations
V. NAOS Potential Risks and Challenges
NAOS Market Risk
- Extreme Volatility: NAOS has experienced a 52.11% decline over the past year and a 23.45% drop in the last 30 days, indicating high price instability that could result in significant losses for retail investors
- Low Trading Volume: 24-hour volume of $12,643 with only 2,265 token holders suggests limited liquidity, potentially causing slippage during larger trades
- Market Capitalization Concentration: With only $398,902 in fully diluted valuation and $153,285 in current market cap, the token is highly susceptible to whale manipulation and flash crashes
NAOS Regulatory Risk
- Evolving DeFi Regulation: Regulatory bodies worldwide continue tightening oversight of decentralized lending platforms, which could impact NAOS Finance's operational model and token utility
- Securities Classification: DeFi tokens face ongoing scrutiny regarding potential securities classification, which could affect trading venues and investor accessibility
- Geographic Restrictions: Some jurisdictions may implement bans or restrictions on DeFi lending protocols, limiting market expansion and reducing token demand
NAOS Technology Risk
- Smart Contract Vulnerability: As with all blockchain-based lending platforms, NAOS faces potential smart contract exploits or bugs that could result in fund loss
- Blockchain Dependency: Network congestion on Ethereum and Binance Smart Chain could impair transaction processing speed and increase gas costs for NAOS transactions
- Protocol Evolution: Changes to the underlying blockchain infrastructure or competing DeFi platforms could diminish NAOS Finance's competitive advantage
VI. Conclusion and Action Recommendations
NAOS Investment Value Assessment
NAOS Finance represents a speculative opportunity in the DeFi lending sector with significant downside risk. The token has lost over half its value in the past year, indicating either market pessimism regarding the project or broader DeFi sector challenges. With a market capitalization of approximately $398,902 and limited trading volume, NAOS remains a highly illiquid micro-cap asset. The project's vision of automating real-world asset lending and combining on-chain/off-chain functionality presents long-term potential, but execution risk remains substantial. Current price levels ($0.00182) represent a 99.95% decline from all-time highs ($3.44 in May 2021), suggesting either fundamental challenges or potential recovery opportunity depending on project developments.
NAOS Investment Recommendations
✅ Beginners: Execute small experimental positions (0.5-1% of portfolio) only after reviewing the project whitepaper and recent development updates. Do not invest funds needed for living expenses. Use only Gate.com for trading with strict stop-loss orders at 15-20% below entry price.
✅ Experienced Investors: Conduct fundamental analysis of lending activity metrics, active borrowers/lenders, and protocol revenue. Consider position sizing of 2-5% for contrarian accumulation at historical lows, with clear exit criteria if key metrics deteriorate.
✅ Institutional Investors: Perform comprehensive due diligence on NAOS Finance's governance structure, smart contract audits, and regulatory compliance. Evaluate correlation with broader DeFi market trends and implement structured position allocation strategies with defined rebalancing intervals.
NAOS Trading Participation Methods
- Gate.com Spot Trading: Execute buy/sell orders on the NAOS/USDT pair with real-time order matching and competitive spreads
- Limit Orders: Set predetermined entry prices below current market levels to accumulate during downtrends while avoiding emotional trading decisions
- Portfolio Diversification: Combine NAOS positions with higher-conviction DeFi assets to reduce unsystematic risk
Cryptocurrency investment carries extreme risk. This report does not constitute investment advice. Investors must carefully assess their risk tolerance and financial situation before participating. Always consult qualified financial advisors and never invest capital you cannot afford to lose.
FAQ
What is NAOS? What are its uses and value?
NAOS is an innovative operating system for IoT devices that enhances efficiency and connectivity. It integrates decentralized finance (DeFi) and real-world asset support, bridging blockchain technology with traditional finance to optimize IoT operations and unlock new value in connected ecosystems.
What is the current price of NAOS? What is the historical price trend?
NAOS is currently trading significantly below its all-time high of $0.094041. The token has risen 62% from its all-time low of $0.001053, demonstrating recovery momentum. Historical data shows NAOS experienced substantial volatility, with current pricing reflecting strong consolidation patterns within the mid-range of its historical trading band.
How do experts predict NAOS future price trends?
Experts predict NAOS price will rise 27.6% over 5 years based on 5% price movement analysis. Current price is US$0.0023. Predictions utilize technical analysis, transaction volume trends, and market sentiment indicators to forecast future price movements.
What are the main risks of investing in NAOS?
NAOS investment risks include market volatility, potential capital loss, and trading system performance fluctuations. Cryptocurrency markets are inherently uncertain and subject to rapid price movements and external factors.
What distinguishes NAOS from other similar assets?
NAOS stands out by tokenizing real-world assets through the Centrifuge protocol, enabling flexible stablecoin issuance. Unlike traditional alternatives, it bridges DeFi with tangible asset backing, offering enhanced stability and yield opportunities for participants.
What are the main factors affecting NAOS price?
NAOS price is primarily influenced by supply and demand dynamics, market sentiment, technological innovations, and trading volume. Macroeconomic factors and investor confidence also significantly impact its valuation in the crypto market.
* The information is not intended to be and does not constitute financial advice or any other recommendation of any sort offered or endorsed by Gate.