# 2025 ORTB Price Prediction: Expert Analysis, Market Trends, and Investment Outlook
This comprehensive guide analyzes ORTB (Okratech Token), a utility token powering the OrtJob decentralized freelancing platform, currently trading at $0.0002722 with extreme market volatility. The article provides professional price forecasts spanning 2026-2031, detailed investment strategies suitable for beginners through institutional investors, and critical risk assessments. Addressing both long-term holders and active traders, this analysis integrates historical performance data, market sentiment metrics, and macroeconomic factors to help investors navigate ORTB's micro-cap dynamics. Readers will discover strategic entry points on Gate, risk management frameworks, and actionable recommendations aligned with their investment profile and risk tolerance levels.
Introduction: Market Position and Investment Value of ORTB
Okratech Token (ORTB) is a blockchain-based token supporting the OrtJob platform, a decentralized freelancing ecosystem powered by DeFi and autonomous DAO technologies. Since its launch, ORTB has established itself as a utility token within the gig economy sector. As of January 2026, ORTB maintains a market capitalization of approximately $237,902.80, with a circulating supply of around 870.74 million tokens, currently trading at $0.0002722 per token. This token represents a unique approach to commission-free freelancing, enabling transparent and secure transactions between employers and freelancers on a decentralized platform.
This article will provide a comprehensive analysis of ORTB's price trends and market dynamics for 2026-2031, incorporating historical performance data, market sentiment, ecosystem developments, and macroeconomic factors to deliver professional price forecasts and actionable investment strategies for market participants.
I. ORTB Price History Review and Market Status
ORTB Historical Price Evolution
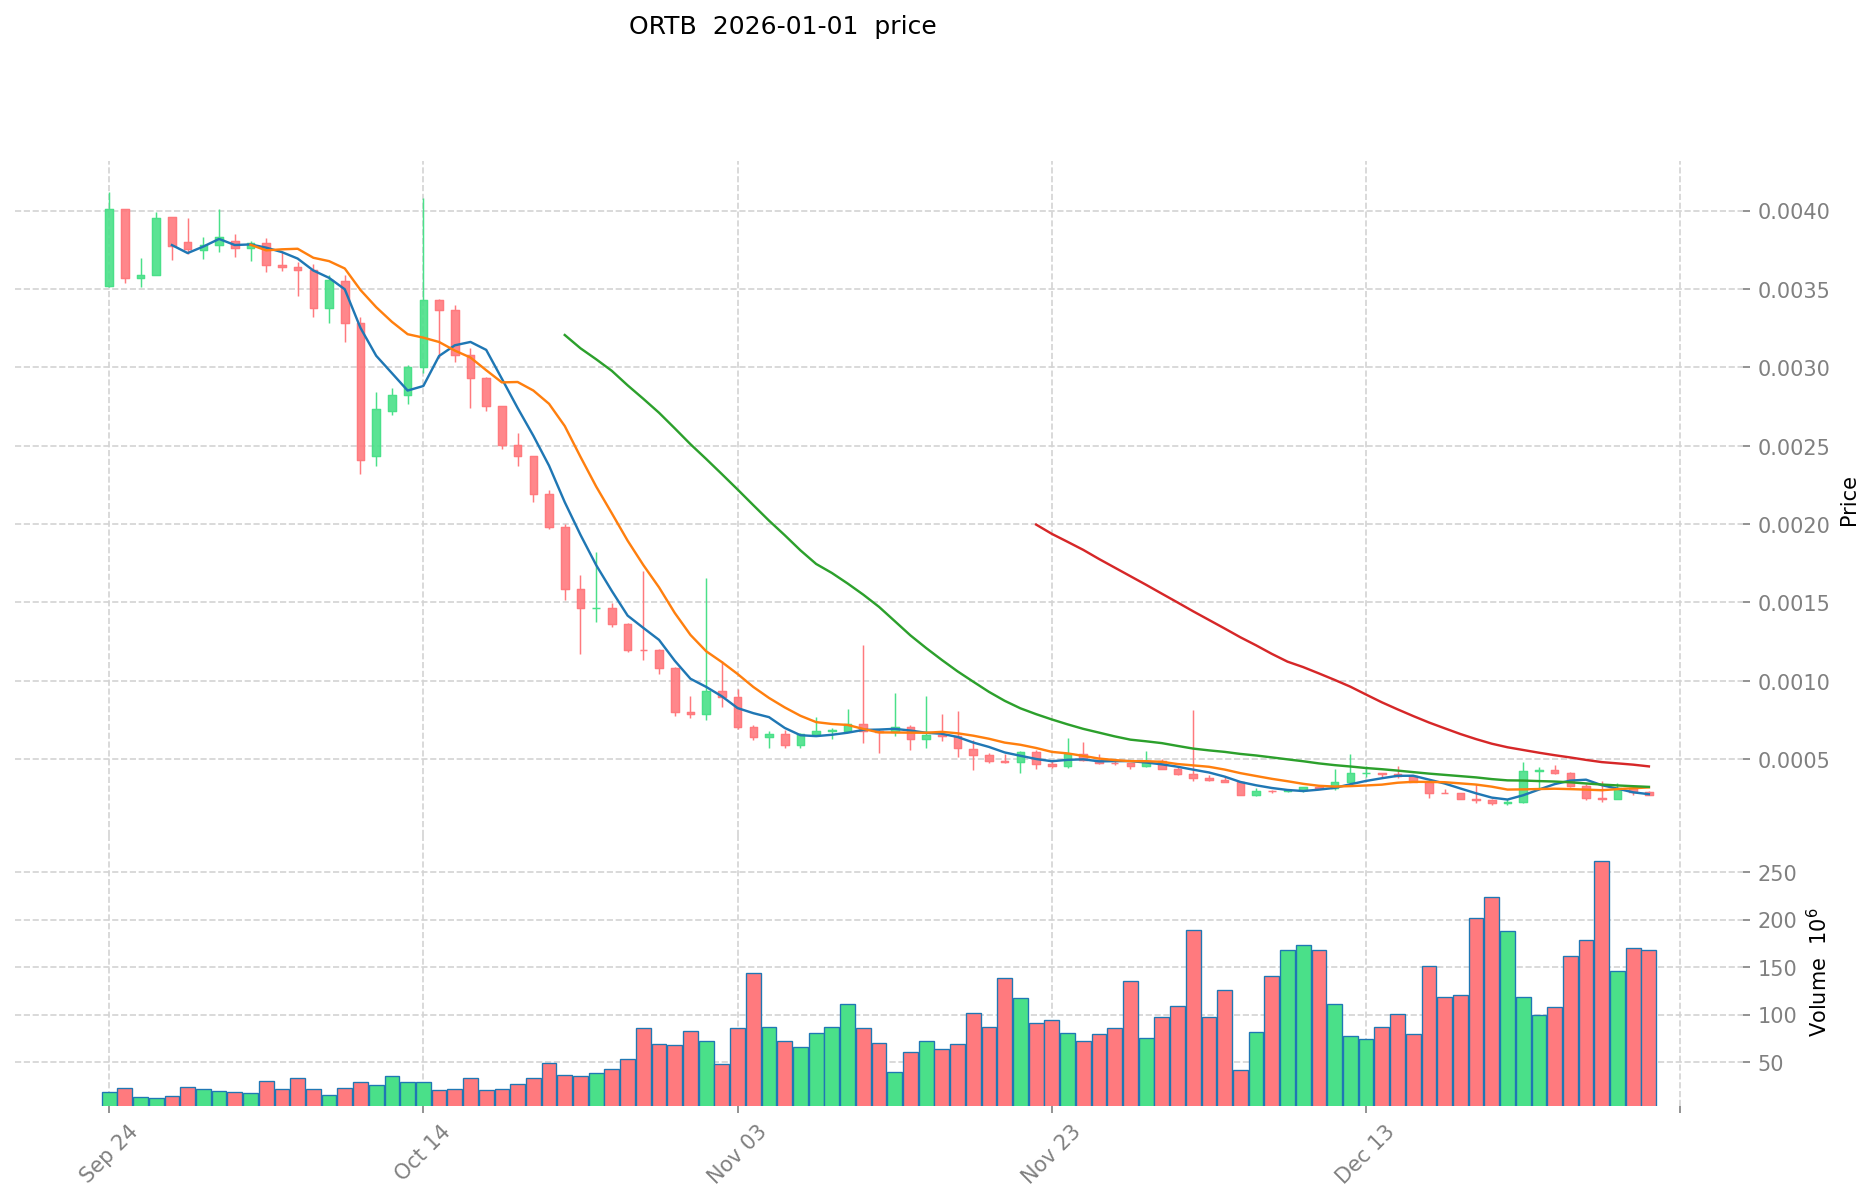
- April 2022: ORTB reached its all-time high (ATH) of $0.121426, marking the peak of its market performance during the early project phase.
- December 2025: ORTB touched its all-time low (ATL) of $0.00021052, representing a significant decline from historical peaks.
ORTB Current Market Position
As of January 1, 2026, ORTB is trading at $0.0002722, reflecting a 24-hour decline of 6.69%. The token demonstrates the following market characteristics:
Price Performance Metrics:
- 1-hour change: +0.41%
- 7-day change: -38.17%
- 30-day change: -36.02%
- 1-year change: -95.14%
Market Capitalization and Supply:
- Current market capitalization: $237,016.09
- Fully diluted valuation: $237,902.80
- Circulating supply: 870,742,437 ORTB (96.75% of total supply)
- Total supply: 874,000,000 ORTB
- Maximum supply: 900,000,000 ORTB
Trading Activity:
- 24-hour trading volume: $47,878.61
- Market dominance: 0.0000075%
- Number of active holders: 16,387
- Trading range (24h): $0.0002607 to $0.0002943
ORTB maintains listings on 2 cryptocurrency exchanges, with available trading pairs on Gate.com. The token exhibits significant long-term depreciation, with a year-to-date decline of over 95% from previous levels.
View current ORTB market price
ORTB Market Sentiment Index
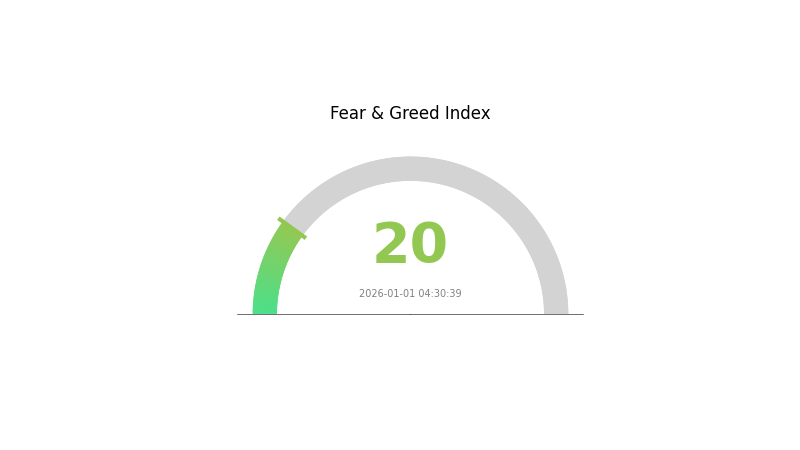
2026-01-01 Fear and Greed Index: 20 (Extreme Fear)
Click to view the current Fear & Greed Index
The crypto market is currently experiencing extreme fear, with the Fear and Greed Index at 20. This exceptionally low reading suggests widespread investor anxiety and pessimistic sentiment across the market. During periods of extreme fear, asset prices often reach attractive levels as panic selling intensifies. Savvy investors typically view such conditions as potential buying opportunities, as markets historically recover from fear-driven downturns. However, caution is advised when entering positions during heightened volatility. Consider conducting thorough research and implementing proper risk management strategies on Gate.com before making investment decisions in this uncertain market environment.
ORTB Holdings Distribution
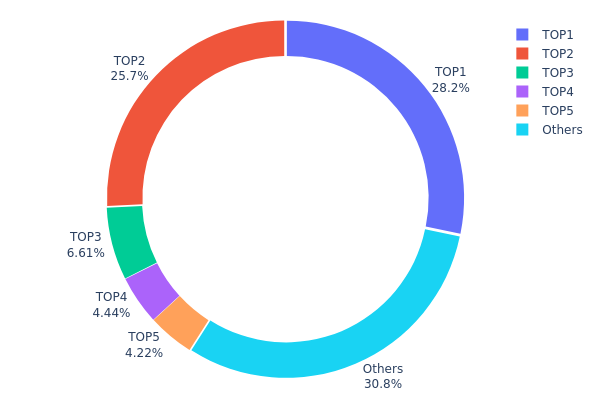
The address holdings distribution map illustrates the concentration of ORTB tokens across blockchain addresses, revealing the proportion of total token supply held by the largest stakeholders. This metric serves as a critical indicator of token distribution dynamics and market structure integrity.
ORTB currently exhibits moderate concentration characteristics, with the top five addresses controlling approximately 69.22% of the circulating supply. The dominant position is held by the dead address (0x0000...00dead) with 28.23%, followed by address 0x4982...6e89cb commanding 25.73% of holdings. While this concentration level warrants attention, the remaining 30.78% distribution among other addresses suggests a degree of decentralization. The gap between the second and third largest holders (25.73% versus 6.61%) indicates a bifurcated structure where power consolidates among top tier participants, though no single entity maintains overwhelming majority control.
From a market dynamics perspective, this distribution pattern presents moderate risk considerations. The substantial holdings concentrated in the top two addresses could theoretically facilitate coordinated price movements or liquidity fluctuations, particularly during periods of elevated market volatility. However, the presence of the dead address holding 28.23% effectively removes a significant portion from active circulation, thereby reducing the practical concentration risk among active market participants. The distributed nature of remaining holdings across numerous smaller addresses enhances market resilience and suggests a reasonably healthy ecosystem structure that supports long-term stability.
Click to view current ORTB Holdings Distribution
| Top |
Address |
Holding Qty |
Holding (%) |
| 1 |
0x0000...00dead |
254119.84K |
28.23% |
| 2 |
0x4982...6e89cb |
231625.86K |
25.73% |
| 3 |
0x0d07...b492fe |
59529.06K |
6.61% |
| 4 |
0x724c...f4df63 |
40000.01K |
4.44% |
| 5 |
0x2e8f...725e64 |
37963.00K |
4.21% |
| - |
Others |
276762.22K |
30.78% |
Analysis of Core Factors Influencing ORTB's Future Price Trends
II. Core Factors Affecting ORTB's Future Price
Macroeconomic Environment
-
Market Demand and Sentiment: ORTB's future price trends are primarily influenced by market demand, macroeconomic events, and investor sentiment. These factors work together to drive price volatility and direction across the cryptocurrency market.
-
Economic Indicators: Economic indicators and competitive dynamics play crucial roles in forecasting price movements. Market participants closely monitor these metrics to assess potential price trajectories.
Technology Development and Regulatory Framework
- Regulatory Changes: Technological advancements and regulatory changes are significant factors in determining ORTB's price performance. Changes in the regulatory landscape can have substantial impacts on market sentiment and asset valuations.
Note: The provided source materials primarily contain general information about Bitcoin (BTC) price factors and computational advertising concepts, rather than specific information about ORTB's supply mechanisms, institutional holdings, enterprise adoption, specific technological upgrades, or ecosystem applications. Therefore, these sections have been omitted from this analysis.
III. 2026-2031 ORTB Price Forecast
2026 Outlook
- Conservative Forecast: $0.00018 - $0.00027
- Neutral Forecast: $0.00027 (baseline average)
- Optimistic Forecast: $0.00037 (requires positive market sentiment and increased adoption)
2027-2029 Medium-term Outlook
- Market Stage Expectation: Gradual recovery and consolidation phase with incremental growth trajectory
- Price Range Forecast:
- 2027: $0.00022 - $0.00041 (17% potential upside)
- 2028: $0.00032 - $0.00046 (33% cumulative growth)
- 2029: $0.00022 - $0.00044 (50% cumulative growth)
- Key Catalysts: Ecosystem development, increased institutional interest, improved market liquidity on platforms like Gate.com, and broader cryptocurrency market recovery
2030-2031 Long-term Outlook
- Base Case Scenario: $0.00027 - $0.00044 (assumes steady adoption and stable market conditions)
- Optimistic Scenario: $0.00043 - $0.00050 (assumes accelerated platform integration and network expansion)
- Transformative Scenario: $0.00050+ (extreme favorable conditions including mainstream institutional adoption and significant technological breakthroughs)
- 2026-01-01: ORTB shows potential for sustained growth through 2031 with cumulative gains reaching 59% by end of forecast period
| 年份 |
预测最高价 |
预测平均价格 |
预测最低价 |
涨跌幅 |
| 2026 |
0.00037 |
0.00027 |
0.00018 |
0 |
| 2027 |
0.00041 |
0.00032 |
0.00022 |
17 |
| 2028 |
0.00046 |
0.00036 |
0.00032 |
33 |
| 2029 |
0.00044 |
0.00041 |
0.00022 |
50 |
| 2030 |
0.00044 |
0.00043 |
0.00027 |
56 |
| 2031 |
0.0005 |
0.00043 |
0.00029 |
59 |
IV. ORTB Professional Investment Strategy and Risk Management
ORTB Investment Methodology
(1) Long-term Holding Strategy
- Suitable for: Investors with high risk tolerance who believe in the OrtJob platform's long-term vision of decentralized freelance services
- Operation Recommendations:
- Accumulate ORTB during periods of market weakness, particularly when prices retreat significantly from historical highs
- Hold positions through market cycles, focusing on the platform's adoption metrics and DeFi ecosystem development
- Regularly review project milestones and community growth to reassess your investment thesis
(2) Active Trading Strategy
- Price Action Observation:
- Monitor the 24-hour volatility patterns: Current 24-hour change of -6.69% indicates active trading opportunities within the $0.0002607 to $0.0002943 range
- Track the significant 7-day decline of -38.17% to identify potential support and resistance levels
- Wave Trading Key Points:
- Entry signals: Consider accumulation when prices approach recent lows, given the -95.14% year-to-date decline
- Exit timing: Set profit targets based on the historical high price of $0.121426 as a long-term reference point
ORTB Risk Management Framework
(1) Asset Allocation Principles
- Conservative Investors: 0.5% - 1% of portfolio
- Active Investors: 1% - 3% of portfolio
- Professional Investors: 3% - 5% of portfolio
(2) Risk Hedging Solutions
- Portfolio diversification: Balance ORTB holdings with other established cryptocurrency assets to reduce concentration risk
- Position sizing: Given the highly volatile nature of ORTB (96.75% of circulating supply relative to fully diluted valuation), maintain smaller position sizes than traditional altcoin investments
(3) Secure Storage Solution
- Exchange custody: For active traders, maintain a portion on Gate.com for liquidity and trading flexibility
- Self-custody security: Transfer long-term holdings to Gate Web3 Wallet for enhanced security and personal asset control
- Security considerations: Enable two-factor authentication on all exchange accounts, use strong passwords, and never share private keys or seed phrases with anyone
V. ORTB Potential Risks and Challenges
ORTB Market Risk
- Extreme price volatility: ORTB has experienced a devastating 95.14% decline over one year, indicating severe market instability and potential for further downside
- Low trading liquidity: With only 2 active exchanges and a 24-hour volume of $47,878.61, ORTB faces significant liquidity constraints that could impede efficient entry and exit from positions
- Small market capitalization: At $237,016 market cap, ORTB is highly susceptible to price manipulation and sudden collapses from minimal trading activity
ORTB Regulatory Risk
- Platform compliance uncertainty: As a decentralized freelance platform operating in multiple jurisdictions, OrtJob faces potential regulatory challenges regarding labor laws and user protections
- Cryptocurrency market regulation: Increased regulatory scrutiny on blockchain and token projects could impact ORTB's operational freedom and market access
- Geographic restrictions: Certain jurisdictions may restrict or prohibit trading and use of ORTB tokens
ORTB Technical Risk
- Platform development uncertainty: Limited information available regarding OrtJob's technical roadmap, smart contract audits, or security assessments
- Smart contract vulnerabilities: As a DeFi-based platform, ORTB faces inherent risks from potential code exploits or vulnerabilities in its blockchain infrastructure
- Network dependency: The project relies on BSC (Binance Smart Chain) infrastructure, creating exposure to Layer 1 blockchain risks and network congestion
VI. Conclusion and Action Recommendations
ORTB Investment Value Assessment
ORTB presents a highly speculative investment opportunity within the decentralized freelance platform sector. While the concept of commission-free, blockchain-based freelancing aligns with growing demand for decentralized work solutions, the token's extreme price deterioration (-95.14% year-to-date), minimal market liquidity, and limited exchange availability indicate significant structural challenges. The project's viability depends heavily on achieving substantial platform adoption and demonstrating tangible value creation beyond speculative trading. Current market conditions reflect low investor confidence, suggesting caution is warranted.
ORTB Investment Recommendations
✅ Beginners: Avoid ORTB as a primary investment; if interested in decentralized work platforms, only allocate 0.5% of a diversified portfolio as a high-risk experimental position
✅ Experienced Investors: Consider small speculative positions only after conducting thorough due diligence on OrtJob's development progress and community engagement; treat as a high-risk venture capital allocation
✅ Institutional Investors: Exercise significant caution; insufficient liquidity and market infrastructure make ORTB unsuitable for substantial institutional positions
ORTB Trading and Participation Methods
- Exchange trading: Trade ORTB on Gate.com, which offers reliable infrastructure for managing positions in micro-cap tokens
- Direct purchase: Access ORTB through Gate.com's spot trading functionality with immediate settlement
- Liquidity considerations: Given low volume, execute large orders with caution using limit orders to avoid significant slippage
Cryptocurrency investment carries extreme risk. This report does not constitute investment advice. Investors should make decisions based on their individual risk tolerance and financial situation. Consult professional financial advisors before investing. Never invest more capital than you can afford to lose completely.
FAQ
What is ORTB (Open Real-time Bidding) and what are its functions?
ORTB is an open protocol enabling real-time bidding in programmatic advertising. It facilitates transparent, efficient ad transactions between ad exchanges and platforms, standardizing communication for automated ad purchasing and auction mechanisms in digital advertising ecosystems.
What are the main methods and techniques for ORTB price prediction?
ORTB price prediction primarily uses machine learning, regression analysis, and deep learning techniques. These methods analyze real-time bidding data, transaction volume, and market trends to forecast optimal bid prices and assess ad value accurately.
How to use machine learning models for ORTB price prediction?
Collect and clean historical ORTB data including price, trading volume, and market indicators. Apply feature engineering to extract relevant patterns. Train models like LSTM or XGBoost on historical data. Validate model accuracy using backtesting. Monitor real-time performance and adjust parameters continuously for optimal predictions.
What are the practical application scenarios of ORTB price prediction in programmatic advertising?
ORTB price prediction optimizes ad bidding in programmatic advertising by analyzing real-time transaction volume and market data. It enables advertisers to adjust bids intelligently, maximize ROI, control costs effectively, and improve ad placement efficiency through data-driven decision making.
What are the key factors affecting ORTB real-time bidding prices?
Key factors include trading volume, market liquidity, supply and demand dynamics, network activity, investor sentiment, and macroeconomic conditions. These collectively drive ORTB price movements in real-time bidding markets.
How is the accuracy of ORTB price prediction assessed?
ORTB price prediction accuracy is evaluated through multiple metrics including historical performance analysis, volatility assessment, and transaction volume correlation. Comparing predicted prices against actual market movements over different timeframes provides comprehensive accuracy evaluation for informed trading decisions.
What are the advantages of ORTB compared to traditional advertising bidding methods?
ORTB offers real-time bidding precision, lower costs, and automated optimization. It targets each impression individually through programmatic auctions, enabling better ad performance and higher ROI compared to traditional bulk purchasing models.
* The information is not intended to be and does not constitute financial advice or any other recommendation of any sort offered or endorsed by Gate.