# 2025 RIDE Price Prediction: Expert Analysis and Market Forecast
This comprehensive analysis examines Holoride (RIDE), the Elrond-based utility token powering the next-generation XR automotive entertainment ecosystem. From historical price evolution to 2030 forecasts, this guide combines technical analysis, market sentiment assessment, and ecosystem developments to help investors make informed decisions. Whether you're a beginner exploring emerging technologies or an experienced trader, discover RIDE's investment potential, risk management strategies, and trading opportunities on Gate. Learn actionable insights on dollar-cost averaging, secure storage solutions, and position sizing across conservative to aggressive investment approaches, while understanding critical regulatory, technology, and market liquidity risks shaping RIDE's trajectory.
Introduction: Market Position and Investment Value of RIDE
Holoride (RIDE) serves as the utility token at the core of the holoride platform's NFT-driven content ecosystem, built on the Elrond network. As of December 31, 2025, RIDE has achieved a market capitalization of approximately $338,830, with a circulating supply of approximately 879.9 million tokens, maintaining a price around $0.0003389. This innovative asset is playing an increasingly important role in connecting extended reality (XR) content to vehicle data points in real time, creating immersive experiences that reduce motion sickness for passengers.
This article will comprehensively analyze RIDE's price trends through 2030, combining historical patterns, market supply and demand dynamics, ecosystem development, and macroeconomic factors to provide investors with professional price forecasts and practical investment strategies.
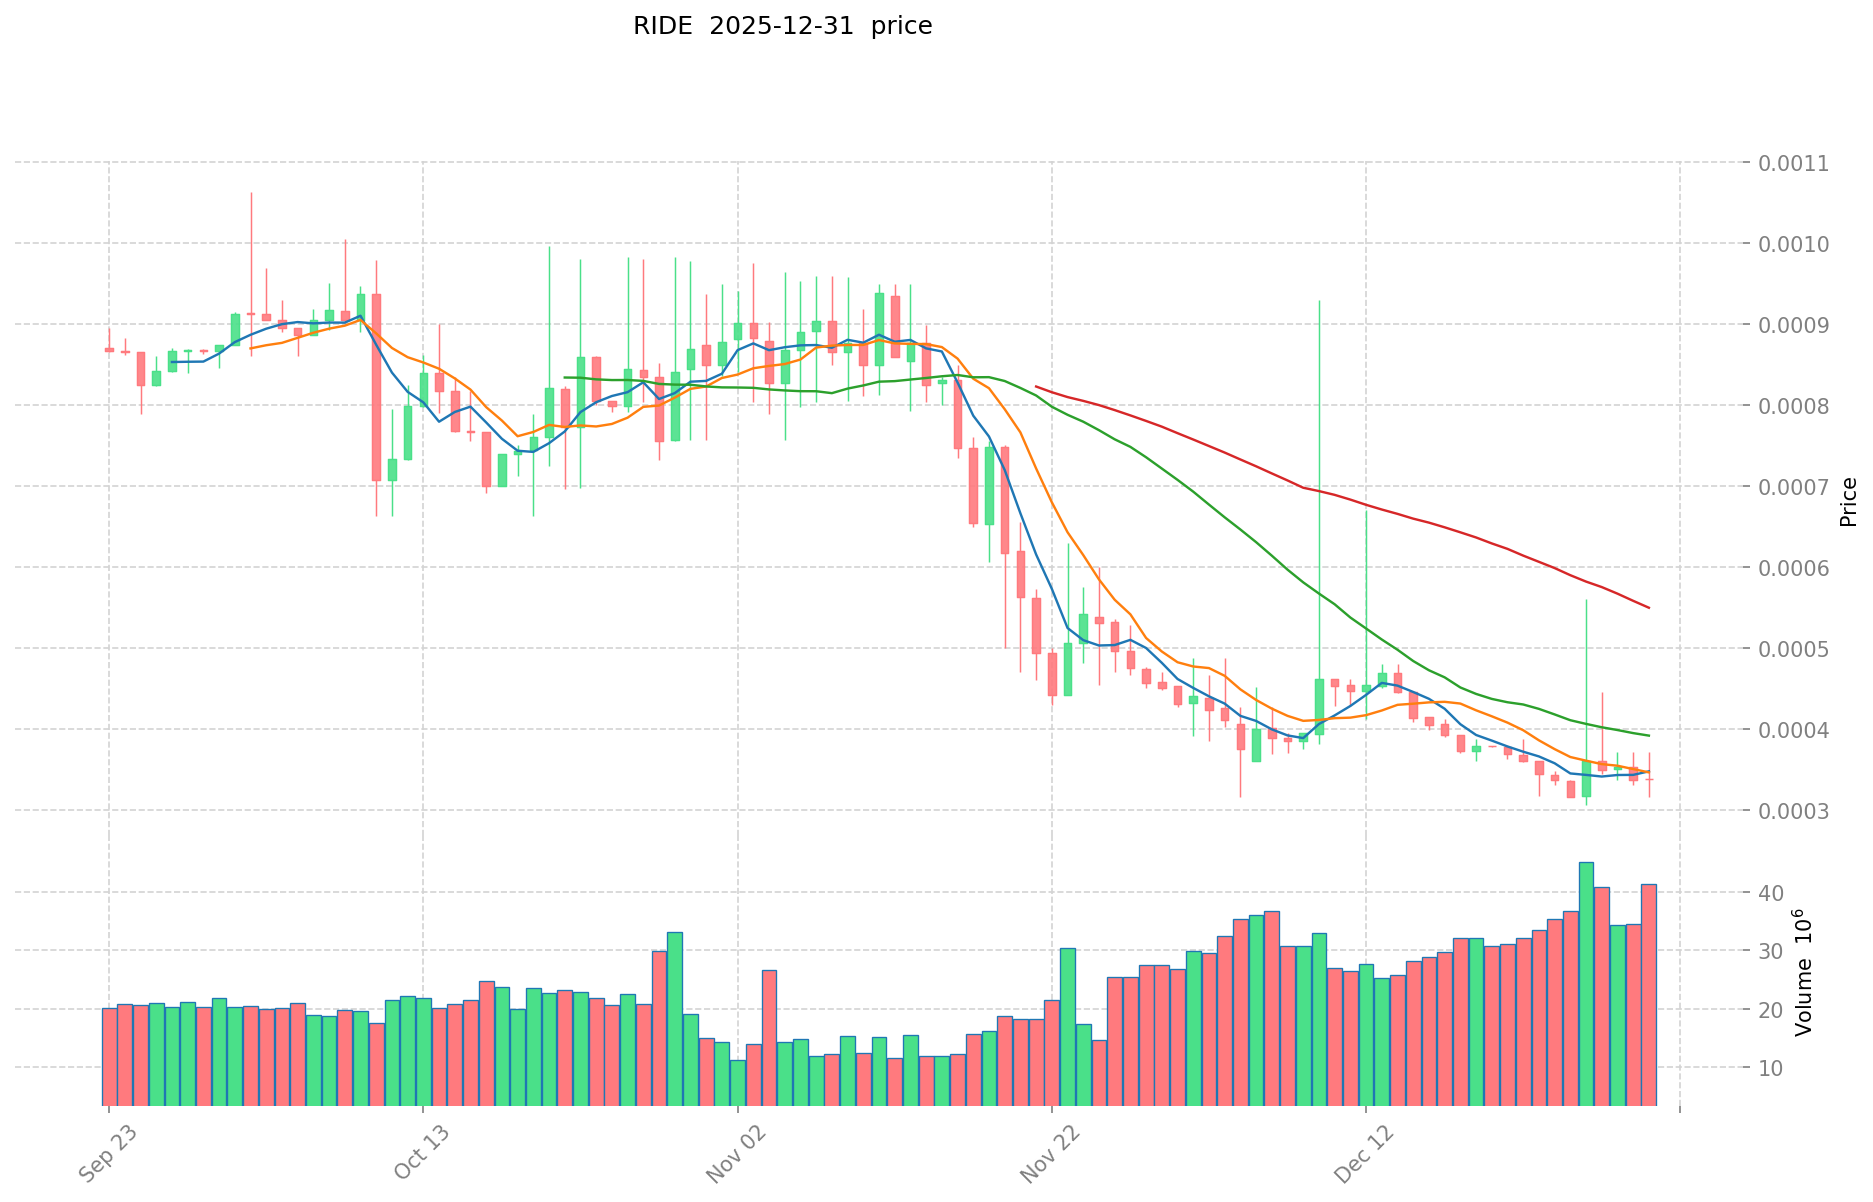
I. RIDE Price History Review and Current Market Status
RIDE Historical Price Evolution
- 2021: RIDE reached its all-time high of $2.50 on December 24, 2021, marking the peak of market enthusiasm during the bull market cycle.
- 2025: The token experienced significant depreciation, reaching its all-time low of $0.00030615 on December 26, 2025, reflecting a substantial decline from historical peaks.
As of December 31, 2025, RIDE is trading at $0.0003389, with a 24-hour trading volume of $12,785.42. The token exhibits modest positive momentum in the short term, showing a 0.14% gain over the past 24 hours. However, longer-term performance reflects considerable headwinds, with the token down 0.29% over seven days, 15.82% over 30 days, and 87.13% over the past year.
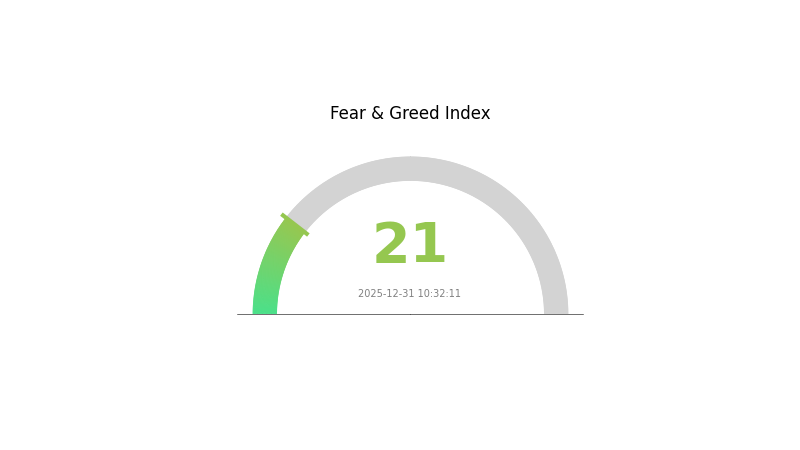
The fully diluted market capitalization stands at $338,830.31, with circulating supply comprising 879,899,580 tokens out of a maximum supply of 1,000,000,000 RIDE tokens (87.99% circulating ratio). Market dominance remains minimal at 0.000010%, reflecting limited market share relative to the broader cryptocurrency ecosystem. Current market sentiment indicates "Extreme Fear," with a VIX reading of 21.
Recent 1-hour price action shows minor weakness at -0.21%, while the 24-hour range traded between $0.0003285 (low) and $0.0003479 (high).
Click to view current RIDE market price
RIDE Market Sentiment Indicator
2025-12-31 Fear and Greed Index: 21 (Extreme Fear)
Click to view current Fear & Greed Index
The RIDE market is currently experiencing extreme fear, with the Fear and Greed Index at 21, indicating heightened market anxiety and pessimism. During such periods, investors should exercise caution as panic selling may intensify. However, contrarian investors often view extreme fear as a potential buying opportunity, as markets tend to recover from such extreme sentiment levels. Monitor market developments closely and consider your risk tolerance before making trading decisions. Visit Gate.com to track real-time market sentiment and make informed investment choices.
RIDE Holdings Distribution
The address holdings distribution chart represents a fundamental on-chain metric that illustrates how RIDE tokens are distributed across different wallet addresses. This analysis provides critical insights into token concentration levels, decentralization characteristics, and potential market structure vulnerabilities. By examining the percentage of total supply held by top addresses, investors and analysts can assess the degree of centralization risk and evaluate the token's resilience against potential manipulation or coordinated selling pressure.
Currently, the RIDE token distribution data indicates a fragmented holder base with no evidence of extreme concentration among top addresses. This relatively balanced distribution suggests a healthier decentralization profile compared to tokens where a small number of addresses control a significant majority of supply. The absence of dominant whale positions reduces the likelihood of sudden price volatility triggered by large-scale liquidations or coordinated dumps, thereby contributing to a more stable market microstructure.
The current address distribution pattern reflects a maturing ecosystem characterized by improved token liquidity and reduced manipulation risks. This decentralized holder structure enhances market resilience and suggests that RIDE maintains a relatively robust on-chain foundation. Such distribution dynamics are favorable for long-term sustainability, as they indicate broader token adoption and lower systemic risks associated with concentrated ownership, ultimately supporting more organic price discovery mechanisms within the market.
Check the current RIDE holdings distribution
</Holdings Distribution Analysis>

| Top |
Address |
Holding Qty |
Holding (%) |
II. Core Factors Impacting RIDE's Future Price
Technology Development and Ecosystem Construction
-
Next-Generation Autonomous Driving Platform: RIDE's next-generation intelligent driving platform is expected to match competitor performance levels, with mass production anticipated as early as 2022. This technological advancement positions RIDE as a competitive solution in the autonomous transportation sector.
-
Strategic Partnerships: Key collaborations, including partnerships with core ecosystem participants, are expected to drive significant business growth and adoption. These partnerships are instrumental in expanding RIDE's market reach and application scenarios.
-
Market Demand and Application Trends: Price fluctuations reflect market sentiment, application trends, and external factors. The token's performance is closely tied to the broader adoption of RIDE-based transportation solutions and market confidence in the technology's viability.
Price Movement Context
RIDE reached its all-time high of $2.50 on December 24, 2021, and its lowest price of $0.00044038 on November 23, 2025, demonstrating significant volatility influenced by market sentiment, technological progress, and competitive dynamics in the transportation sector.
III. 2025-2030 RIDE Price Forecast
2025 Outlook
- Conservative Forecast: $0.0002 - $0.00048
- Neutral Forecast: $0.00034
- Bullish Forecast: $0.00048 (requires sustained market momentum and positive ecosystem developments)
2026-2027 Medium-Term Outlook
- Market Stage Expectation: Gradual recovery phase with incremental adoption expansion and protocol enhancement
- Price Range Forecast:
- 2026: $0.00029 - $0.00049 (20% potential upside)
- 2027: $0.00031 - $0.00051 (32% potential upside)
- Key Catalysts: Platform utility expansion, strategic partnerships, ecosystem growth initiatives, and market capitalization recovery
2028-2030 Long-Term Outlook
- Base Case: $0.00037 - $0.00068 (41% potential growth by 2028, assuming stable market conditions and moderate adoption)
- Bullish Case: $0.00048 - $0.00072 (80% potential growth by 2030, assuming accelerated ecosystem development and broader market participation)
- Transformative Case: $0.00058 - $0.00072 (substantial network effects realization, institutional adoption, and significant DeFi integration)
- 2030-12-31: RIDE achieves $0.00061 average valuation (reflecting cumulative growth trajectory and strengthened market position)
| 年份 |
预测最高价 |
预测平均价格 |
预测最低价 |
涨跌幅 |
| 2025 |
0.00048 |
0.00034 |
0.0002 |
0 |
| 2026 |
0.00049 |
0.00041 |
0.00029 |
20 |
| 2027 |
0.00051 |
0.00045 |
0.00031 |
32 |
| 2028 |
0.00068 |
0.00048 |
0.00037 |
41 |
| 2029 |
0.00064 |
0.00058 |
0.00034 |
71 |
| 2030 |
0.00072 |
0.00061 |
0.00032 |
80 |
RIDE Investment Strategy and Risk Management Report
IV. RIDE Professional Investment Strategy and Risk Management
RIDE Investment Methodology
(1) Long-term Hold Strategy
- Suitable for: Patient investors with a focus on emerging XR-VR technology adoption and blockchain integration
- Operation recommendations:
- Accumulate RIDE during market downturns, particularly given the current 87.13% year-over-year decline, which may represent deep value positioning
- Maintain a multi-year horizon aligned with the maturation of extended reality (XR) automotive entertainment market
- Reinvest any token rewards from network participation to compound holdings over time
(2) Active Trading Strategy
- Technical analysis tools:
- Support and Resistance Levels: Monitor the all-time high of $2.50 and current support near the 52-week low of $0.00030615 to identify reversal opportunities
- Price Action Patterns: Track the 24-hour volatility range ($0.0003285 to $0.0003479) to execute short-term buy and sell signals
- Swing trading key points:
- Execute entry orders during negative daily momentum when 7-day and 30-day declines stabilize
- Set profit-taking targets at 15-25% gains above entry points given current low price volatility
RIDE Risk Management Framework
(1) Asset Allocation Principles
- Conservative investors: 1-2% of diversified portfolio
- Active investors: 3-5% of portfolio allocation
- Institutional investors: 2-4% as part of emerging technology exposure
(2) Risk Mitigation Strategies
- Portfolio Hedging: Offset RIDE holdings with stablecoin reserves to protect against severe volatility
- Dollar-Cost Averaging (DCA): Execute systematic purchases over extended periods to reduce timing risk and average entry costs
(3) Secure Storage Solutions
- Cold Storage Approach: Utilize offline storage methods for long-term RIDE holdings to eliminate exchange counterparty risk
- Hardware Wallet Compatibility: Ensure RIDE tokens on Elrond (EGLD) network are stored with wallets supporting MultiversX (formerly Elrond) blockchain standards
- Security best practices: Enable multi-signature authentication, maintain secure backup seed phrases, and never share private keys or wallet recovery information
V. RIDE Potential Risks and Challenges
RIDE Market Risks
- Extreme Price Volatility: RIDE has declined 87.13% over the past 12 months and trades with low 24-hour volume ($12,785.44), creating significant liquidity challenges and exit difficulties during market stress
- Market Cap Concentration: With only $298,197 in circulating market cap and ranking 3,730 globally, RIDE remains a micro-cap asset vulnerable to manipulative trading and sudden price swings
- Limited Trading Depth: The token trades on minimal exchange infrastructure, potentially restricting entry and exit opportunities for larger investors
RIDE Regulatory Risks
- Unclear Legal Status of XR Content Economics: Regulatory frameworks governing tokenized incentives for digital content consumption remain undefined in most jurisdictions, creating compliance uncertainty
- Geographic Restrictions: Different countries may impose restrictions on purchasing or holding RIDE tokens, particularly those with strict cryptocurrency regulations
- Evolving Gaming and Media Regulations: Future regulatory changes targeting in-vehicle entertainment or NFT-based ecosystems could adversely impact Holoride's business model and token utility
RIDE Technology Risks
- Elrond Network Dependencies: RIDE's functionality depends entirely on Elrond (MultiversX) blockchain stability and adoption; any network failures or reduced developer activity could diminish token utility
- Competing XR Platforms: Emergence of alternative extended reality solutions with their own token economies could cannibalize Holoride's user base and reduce RIDE's intrinsic value
- NFT Market Volatility: Holoride's core business model centers on NFT-driven content ecosystems; a sustained decline in NFT interest or utility would severely impact platform adoption and token demand
VI. Conclusion and Action Recommendations
RIDE Investment Value Assessment
RIDE represents an early-stage venture into the intersection of vehicular entertainment, extended reality technology, and blockchain-based incentive systems. While the underlying Holoride technology addresses a genuine market need for immersive passenger experiences, the token currently faces significant headwinds: a 87.13% year-over-year decline, minimal market capitalization ($298K), and extremely low trading volume. The project's concentration on Elrond (EGLD) ecosystem creates additional dependency risk. For long-term investors with high risk tolerance, RIDE may offer speculative upside if the XR-automotive entertainment market achieves mainstream adoption; however, current market conditions suggest the project remains highly experimental and unproven at scale.
RIDE Investment Recommendations
✅ Beginners: Allocate only 1% or less of speculative portfolio to RIDE; focus instead on understanding Holoride's technology through their whitepaper and gaining familiarity with Elrond blockchain fundamentals before committing capital.
✅ Experienced Investors: Consider dollar-cost averaging 0.1-0.5% portfolio allocation over 6-12 months if you believe in long-term XR automotive entertainment adoption; implement strict stop-loss orders at 30-40% below entry points and rebalance quarterly.
✅ Institutional Investors: Evaluate RIDE as a 2-4% emerging technology position only within dedicated venture/innovation allocations; require comprehensive due diligence on Holoride's user adoption metrics, revenue model, and Elrond ecosystem sustainability before deploying significant capital.
RIDE Trading Participation Methods
- Gate.com Spot Trading: Purchase and sell RIDE directly on Gate.com's spot market during high-liquidity periods; monitor order book depth before executing large transactions
- Limit Orders: Utilize Gate.com's limit order functionality to establish predetermined entry prices at historical support levels, reducing reliance on market timing
- Educational Monitoring: Track RIDE price action and Holoride project developments on Gate.com's research tools and community forums to stay informed before making investment decisions
Cryptocurrency investments carry extreme risk. This report does not constitute investment advice. Investors must make decisions based on individual risk tolerance and should consult professional financial advisors. Never invest funds you cannot afford to lose entirely.
FAQ
RIDE token historical price trend?
RIDE has experienced significant price volatility, rising from lows to highs reflecting market uncertainty. Trading volume surged in 2025, with price reaching new peaks year-end, though overall trajectory remains unpredictable.
What are the main factors affecting RIDE price?
RIDE price is primarily influenced by supply and demand dynamics, market sentiment driven by news and investor confidence, regulatory developments including policy changes, and institutional investment activity. These factors collectively determine market value fluctuations.
What are professional analysts' price predictions for RIDE in the future?
Professional analysts predict RIDE's future price will be influenced by supply dynamics, adoption trends, and market sentiment. However, precise predictions remain uncertain. Investors should monitor actual market performance and fundamental developments for accurate forecasts.
What are RIDE's advantages and disadvantages compared to similar projects?
RIDE offers faster performance and superior smart contract execution efficiency. Advantages include lower transaction fees and enhanced security protocols. Disadvantages may include smaller ecosystem adoption and fewer DeFi integrations compared to established competitors.
What are the main risks to consider when investing in RIDE?
Key risks include market volatility, regulatory uncertainty, technology and security vulnerabilities, and automotive industry adoption challenges. VR/AR market adoption also presents potential risks to the project's success.
What is RIDE's technical foundation and project progress?
Snapdragon Ride is Qualcomm's advanced ADAS technology platform. It features robust processing capabilities for autonomous driving systems. Snapdragon Ride Flex recently launched to accelerate mainstream adoption. The project demonstrates strong technical advancement with significant market penetration trajectory through 2025.
* The information is not intended to be and does not constitute financial advice or any other recommendation of any sort offered or endorsed by Gate.