# Article Overview: 2025 XNL Price Prediction - Expert Analysis and Market Forecast
This comprehensive analysis examines Novastro (XNL), a cross-chain Real-World Asset tokenization platform trading at $0.000711 as of January 2026. The article provides professional price forecasting across 2026-2031, addressing critical market dynamics including historical price evolution, current market sentiment, and holder concentration risks. Designed for crypto investors ranging from beginners to institutional participants, this guide delivers actionable investment strategies, risk management frameworks, and technical analysis insights through Gate spot trading. The report systematically evaluates XNL's extreme volatility (79% decline from ATH), liquidity constraints, and regulatory uncertainties while projecting conservative to optimistic price scenarios. Essential reading for investors seeking RWA tokenization exposure with clear understanding of downside risks, security protocols, and asset allocation principles.
---
Introduction: Market Position and Investment Value of XNL
Novastro (XNL) is a cross-chain Real-World Asset (RWA) platform that enables seamless tokenization of tangible assets on the Ethereum ledger, ensuring regulatory compliance and verifiable ownership. The platform integrates AI-powered yield optimization mechanisms, dynamically compounding returns from RWA-backed stable assets such as real estate, credit, and commodities. As of January 2026, XNL has achieved a market cap of approximately $142,200, with a circulating supply of 200,000,020 tokens and a current price hovering around $0.000711. This innovative asset is increasingly playing a crucial role in transforming real-world yields into scalable, on-chain opportunities through a decentralized, trust-anchored ecosystem.
This article will provide a comprehensive analysis of XNL's price trajectory and market dynamics as of January 2, 2026, combining historical trends, market supply and demand dynamics, ecosystem development, and macroeconomic factors to deliver professional price forecasting and practical investment strategies for investors seeking to understand this emerging RWA-focused digital asset.
Novastro (XNL) Market Analysis Report
I. XNL Price History Review and Market Status
XNL Historical Price Evolution
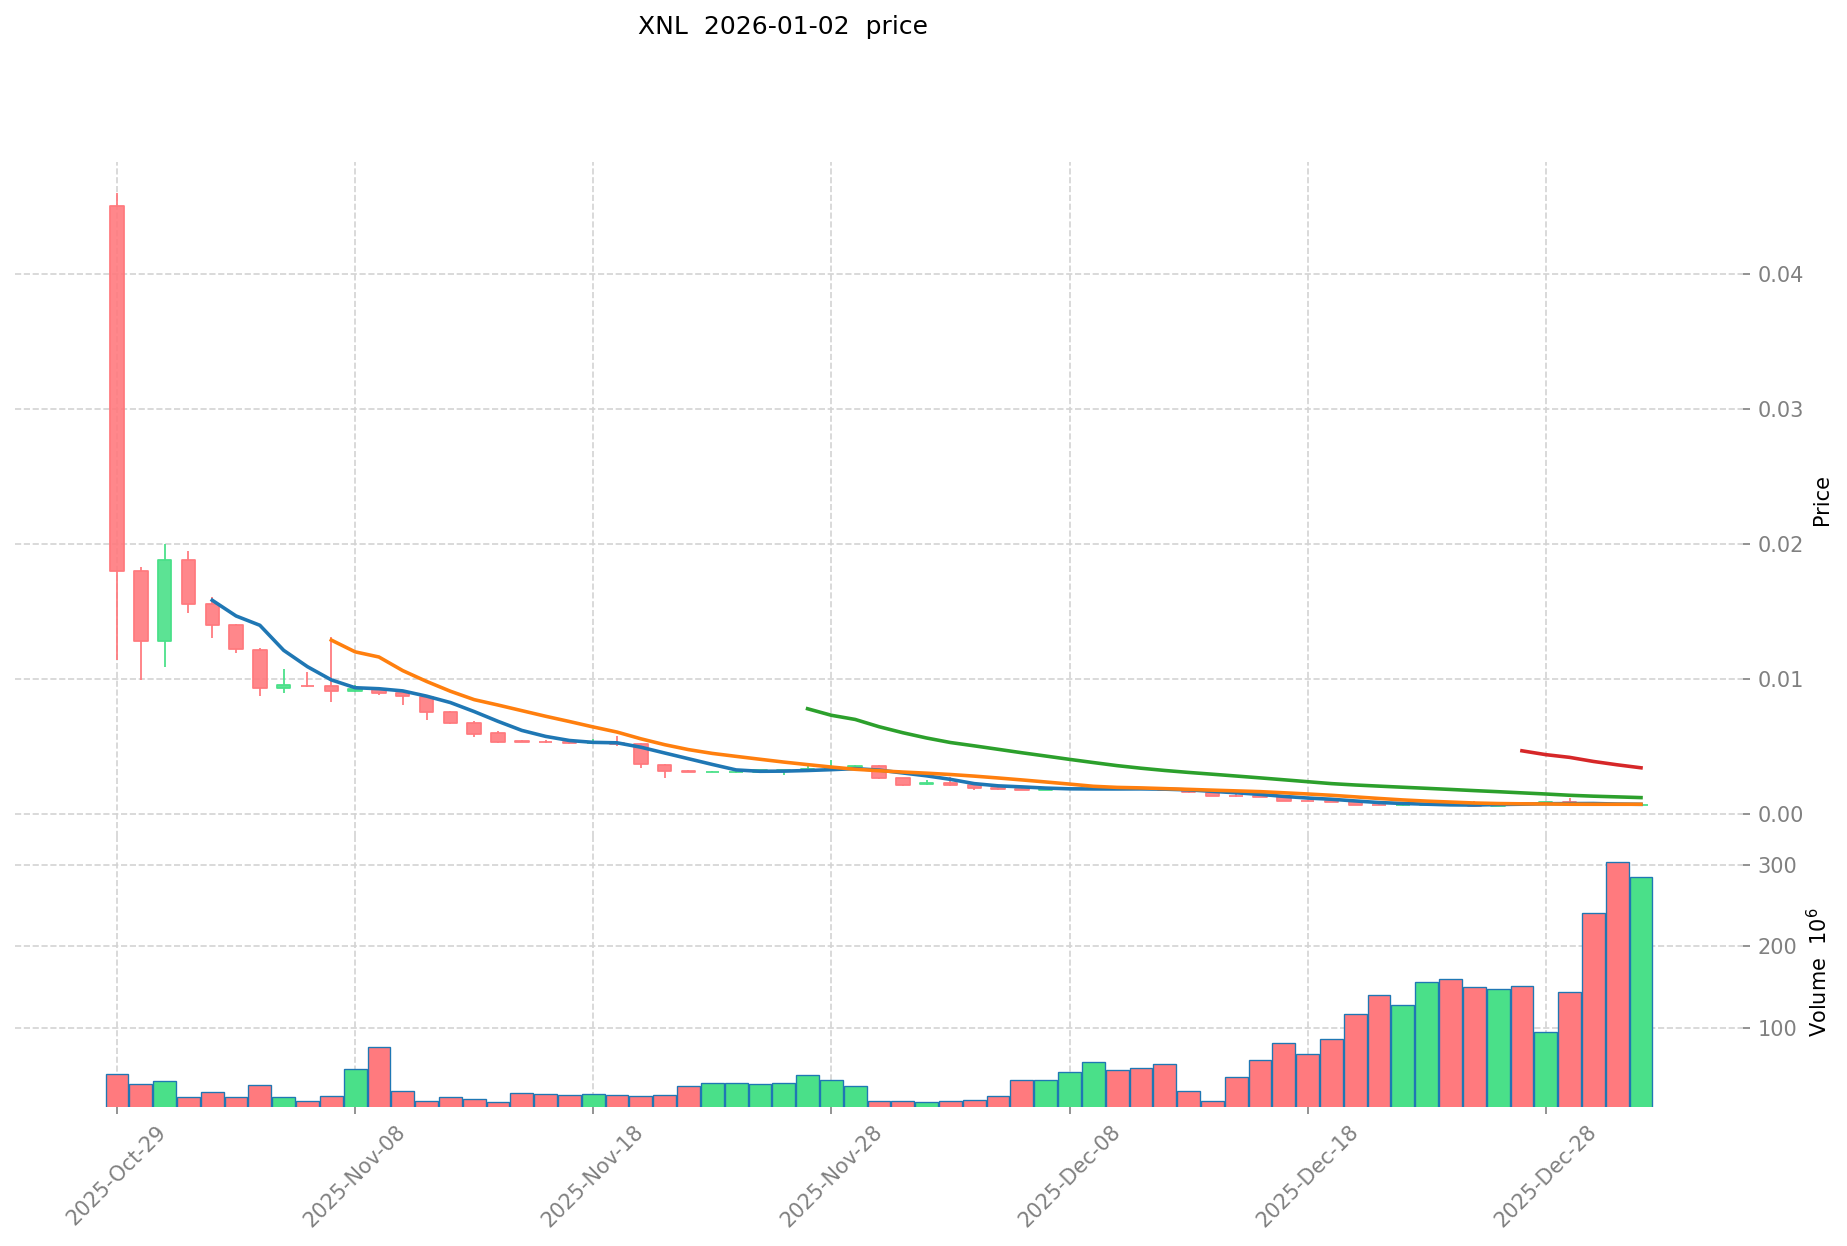
Based on available data, Novastro (XNL) has experienced significant volatility since its launch:
- October 29, 2025: All-Time High (ATH) reached at $0.046, marking the peak performance of the token during its trading history.
- December 29, 2025: All-Time Low (ATL) recorded at $0.0005841, representing a substantial correction from peak levels.
- Recent Period (Last 30 Days): The token has declined 67.72% from its 30-day reference point, reflecting considerable bearish pressure.
XNL Current Market Posture
As of January 2, 2026, Novastro (XNL) is trading at $0.000711, with a 24-hour trading volume of $167,509.18. The token has demonstrated recent upward momentum with a +17.73% gain over the last 24 hours, recovering from the low of $0.0005892 to a 24-hour high of $0.0007359.
The current market capitalization stands at approximately $142,200, with a fully diluted valuation of $711,000. XNL maintains a circulating supply of 200,000,020 tokens out of a total supply of 1,000,000,000 tokens. The token ranks #4,501 by market capitalization and is currently listed on Gate.com, commanding a market dominance of 0.000022%.
Short-term price action shows mixed signals: while the 24-hour period reflects recovery with +17.73% gains, the 7-day performance has declined 5.31%, and the 30-day trend shows substantial weakness at -67.72%. The hourly chart indicates slight downward pressure with -0.67% change. The token currently has 12,196 active holders, indicating a developing user base.
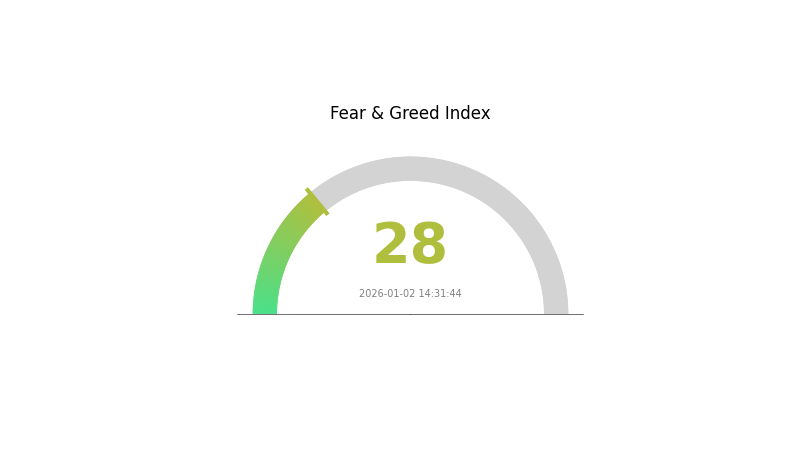
Market sentiment suggests caution, as the broader market environment is characterized by fear conditions (VIX at 28).
Click to view current XNL market price
XNL Market Sentiment Indicator
2026-01-02 Fear and Greed Index: 28 (Fear)
Click to view current Fear & Greed Index
The crypto market is currently showing strong fear sentiment with an index reading of 28. This fear-driven environment typically reflects investor anxiety and cautious positioning across digital assets. Market participants are exercising restraint, creating potential opportunities for contrarian investors. During fear phases, risk-averse traders often reduce exposure while experienced investors scout entry points. Monitor key support levels and market catalysts closely, as sentiment can shift rapidly when positive developments emerge. Consider your risk tolerance and investment strategy carefully in this fear-dominated market phase.
XNL Holding Distribution
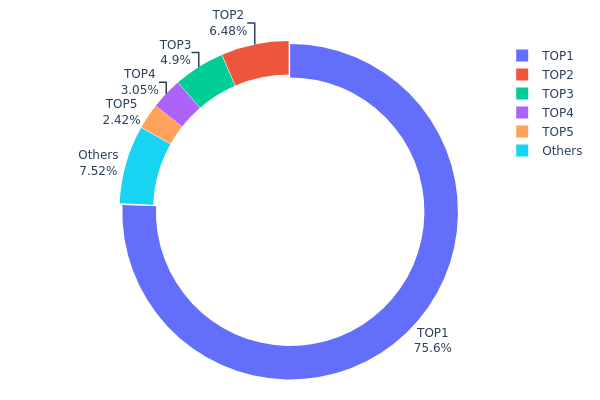
The address holding distribution map illustrates the concentration of XNL tokens across blockchain addresses, revealing critical insights into the token's ownership structure and market concentration dynamics. By analyzing the top addresses and their respective holdings, this metric provides essential visibility into potential risks related to token centralization, market manipulation susceptibility, and the overall decentralization status of the network.
XNL exhibits a pronounced concentration pattern, with the top holder commanding 75.63% of total supply, representing an extremely centralized distribution structure. The top five addresses collectively control 92.46% of all tokens in circulation, leaving merely 7.54% distributed among remaining addresses. This level of concentration significantly exceeds healthy decentralization benchmarks, indicating substantial centralization risk. The dominant position of the leading address, holding over three-quarters of the supply, creates a single point of control that warrants careful consideration regarding potential governance risks and market stability.
The severe concentration observed in XNL's address distribution raises considerable concerns regarding market structure integrity and price stability. Such extreme token centralization amplifies susceptibility to coordinated liquidations, sudden price movements triggered by large holder transactions, and potential market manipulation scenarios. The thin distribution among smaller holders suggests limited liquidity diversity and increased dependency on the actions of major stakeholders. This structure constrains organic market development and introduces elevated counterparty risk, as the network's stability and price discovery mechanisms become heavily reliant on the decision-making and actions of a minimal number of influential addresses rather than a broad-based, decentralized holder base.
Click to view current XNL holding distribution
| Top |
Address |
Holding Qty |
Holding (%) |
| 1 |
0xa028...96b14f |
755710.10K |
75.63% |
| 2 |
0xb8aa...04f5c5 |
64746.36K |
6.48% |
| 3 |
0x53f7...f3fa23 |
48913.54K |
4.89% |
| 4 |
0x0d07...b492fe |
30436.74K |
3.04% |
| 5 |
0x09d8...ee72c6 |
24185.54K |
2.42% |
| - |
Others |
75179.12K |
7.54% |
II. Core Factors Affecting XNL's Future Price
Supply Mechanism
-
Fixed Supply Cap: XNL has a fixed total supply limit, which serves as a fundamental mechanism to control inflation and maintain scarcity.
-
Historical Patterns: During the Token Generation Event (TGE), the full unlock of all tokens caused a sharp price decline. This massive supply injection, combined with initial low demand and limited liquidity, allowed sellers to dominate the market dynamics.
-
Current Impact: The supply dynamics established at TGE continue to influence market sentiment. The initial oversupply situation has created a bearish pressure that may require sustained demand growth and ecosystem development to overcome.
Market Demand and Investor Confidence
-
Cross-Chain RWA Platform Positioning: XNL is positioned as a cross-chain Real-World Asset (RWA) platform token, which provides utility beyond speculation and connects traditional financial assets with blockchain infrastructure.
-
Liquidity Conditions: Limited liquidity at launch constrained price discovery and contributed to selling pressure. Expanded liquidity through platforms like Gate.com is essential for price stabilization and investor participation.
-
Market Sentiment: XNL's future price movement will depend significantly on investor confidence in its RWA platform use case and the broader adoption of blockchain-based real-world asset solutions.
III. 2026-2031 XNL Price Forecast
2026 Outlook
- Conservative Prediction: $0.00057 - $0.00071
- Neutral Prediction: $0.00071 (baseline average)
- Optimistic Prediction: $0.00082 (requires sustained market interest and positive ecosystem developments)
2027-2029 Medium-term Outlook
- Market Stage Expectation: Gradual accumulation phase with modest growth trajectory, characterized by incremental adoption and ecosystem maturation
- Price Range Predictions:
- 2027: $0.00061 - $0.00097
- 2028: $0.00047 - $0.00115
- 2029: $0.00070 - $0.00118
- Key Catalysts: Protocol upgrades, partnership announcements, increased utility adoption, and overall market sentiment recovery
2030-2031 Long-term Outlook
- Base Case Scenario: $0.00082 - $0.00149 (assumes steady ecosystem development and moderate market expansion)
- Optimistic Scenario: $0.00112 - $0.00186 (assumes significant partnerships, mainstream adoption acceleration, and favorable regulatory environment)
- Transformative Scenario: $0.00186+ (assumes breakthrough technological advancement, institutional adoption, and XNL becoming essential infrastructure component)
- 2026-01-02: XNL trading at baseline levels with significant upside potential over the five-year forecast period (approximately 127% growth by 2031 under optimistic conditions)
| 年份 |
预测最高价 |
预测平均价格 |
预测最低价 |
涨跌幅 |
| 2026 |
0.00082 |
0.00071 |
0.00057 |
0 |
| 2027 |
0.00097 |
0.00077 |
0.00061 |
7 |
| 2028 |
0.00115 |
0.00087 |
0.00047 |
22 |
| 2029 |
0.00118 |
0.00101 |
0.0007 |
41 |
| 2030 |
0.00149 |
0.0011 |
0.00082 |
54 |
| 2031 |
0.00186 |
0.00129 |
0.00112 |
81 |
Novastro (XNL) Professional Investment Strategy and Risk Management Report
IV. XNL Professional Investment Strategy and Risk Management
XNL Investment Methodology
(1) Long-Term Holding Strategy
-
Target Investors: Investors with strong risk tolerance seeking exposure to emerging Real-World Asset (RWA) tokenization platforms, blockchain infrastructure believers, and those committed to 12+ month investment horizons.
-
Operational Recommendations:
- Accumulate XNL during market downturns; current 30-day drawdown of -67.72% may present entry opportunities for believers in the RWA narrative
- Establish a dollar-cost averaging (DCA) approach to mitigate timing risk, allocating capital across multiple entry points
- Monitor key platform milestones including asset tokenization achievements, cross-chain integration completeness, and adoption metrics on the Ethereum ledger
(2) Active Trading Strategy
XNL Risk Management Framework
(1) Asset Allocation Principles
- Conservative Investors: 0.5-2% portfolio allocation maximum, treating XNL as high-risk/high-reward experimental allocation only
- Aggressive Investors: 2-5% portfolio allocation, with clear understanding of potential total loss scenarios
- Professional Investors: 5-10% allocation, conditional on thorough due diligence on platform development progress and market adoption metrics
(2) Risk Hedging Solutions
- Portfolio Diversification: Pair XNL holdings with stable, established cryptocurrency positions and traditional assets to offset extreme volatility exposure
- Staged Entry/Exit Strategies: Implement predetermined profit-taking schedules at key price milestones (e.g., 50% position reduction at 100% gains, 25% at 200% gains) to manage black swan risks
(3) Secure Storage Solution
- Hardware wallet Approach: For holdings exceeding $5,000, consider cold storage solutions compatible with BSC network to eliminate smart contract risk
- Exchange Storage with Caution: If using Gate.com for trading and short-term storage, enable all available security features including two-factor authentication and withdrawal whitelisting
- Security Considerations:
- Never share private keys or recovery phrases with any entity
- Verify contract address authenticity: 0xdfeb13936a8975f9f788e73fb93861ce461541f9 (BSC)
- Be vigilant against phishing attempts targeting XNL holders
- Store recovery phrases offline in multiple secure locations
V. Novastro (XNL) Potential Risks and Challenges
XNL Market Risks
-
Extreme Volatility: XNL demonstrates severe price fluctuation, declining 79% from ATH of $0.046 to ATL of $0.0005841 within months. Current market cap of only $711,000 with 12,196 holders indicates limited liquidity and thin order books, creating substantial price impact from moderate trading volumes.
-
Liquidity Constraints: Trading volume of $167,509 (24-hour) relative to fully diluted valuation of $711,000 signals severe liquidity challenges. Investors may face difficulty exiting significant positions without substantial slippage.
-
Early-Stage Project Risk: Novastro operates as a relatively new entrant in the RWA tokenization space. Limited market history, unproven platform scalability, and nascent adoption create fundamental uncertainty regarding long-term viability.
XNL Regulatory Risks
-
RWA Regulatory Uncertainty: Real-World Asset tokenization remains in regulatory grey zones across most jurisdictions. Future regulatory clarifications or restrictions on asset tokenization could materially impact Novastro's operational model and token utility.
-
Compliance Burden Evolution: As governments establish RWA frameworks, Novastro may face increased compliance requirements and operational costs, potentially diluting platform economics and token value.
-
Jurisdiction-Specific Restrictions: Certain jurisdictions may restrict or prohibit participation in RWA platforms or restrict specific asset classes (real estate, credit, commodities) from blockchain tokenization.
XNL Technical Risks
-
Cross-Chain Bridge Security: Novastro's reliance on cross-chain bridging mechanisms for multi-chain asset deployment introduces smart contract risks, bridge vulnerability exposure, and potential loss of funds through protocol exploits.
-
AI Model Performance: Platform's AI-driven yield optimization mechanisms lack proven track records. Underperformance or model failures could erode investor returns and platform credibility.
-
Smart Contract Audit Status: Limited publicly available information regarding comprehensive security audits of Novastro's core protocols creates uncertainty regarding technical robustness and exploit vulnerability.
VI. Conclusions and Action Recommendations
XNL Investment Value Assessment
Novastro represents a speculative play on the emerging Real-World Asset tokenization narrative within decentralized finance. The platform's core proposition—enabling AI-optimized yield from tokenized real-world assets—addresses genuine market demand for yield-generating on-chain opportunities. However, current market indicators suggest significant execution risk: the project's extreme volatility (-67.72% in 30 days), microscopic market capitalization ($711,000), and limited adoption (12,196 holders) indicate early-stage fragility. Success depends entirely on achieving meaningful platform adoption, demonstrating consistent yield generation capability, and navigating evolving regulatory frameworks. For risk-averse investors, the fundamental risk/reward profile remains highly unfavorable at current valuation.
XNL Investment Recommendations
✅ Beginners: Allocate maximum 0.5-1% of portfolio only if philosophically aligned with RWA tokenization thesis; prioritize learning platform mechanics through small experimental positions rather than significant capital deployment.
✅ Experienced Investors: Maintain 1-3% tactical allocation with active monitoring of key milestones: asset tokenization volume, cross-chain adoption metrics, AI yield performance, and regulatory developments; establish clear exit thresholds at -30% to -50% levels.
✅ Institutional Investors: Conduct comprehensive due diligence on platform development progress, team credentials, and technical security architecture before any allocation consideration; structure exposure through staged deployment correlated with demonstrated platform traction.
XNL Trading Participation Methods
-
Gate.com Spot Trading: Access XNL/USDT and XNL/USDC spot pairs on Gate.com for direct trading, leveraging the platform's liquidity pools and secure custody for short-term holdings.
-
Manual On-Chain Accumulation: Acquire XNL directly through Novastro's ecosystem interfaces or decentralized protocols for participants seeking direct exposure to platform governance and yield mechanisms.
-
Hedged Position Entry: Combine XNL purchases with stablecoin reserves to maintain flexibility during extreme volatility, enabling opportunistic averaging into positions during severe price declines.
Cryptocurrency investments carry extreme risk. This report does not constitute investment advice. Investors must make decisions based on personal risk tolerance and financial circumstances. Consult qualified financial advisors before deploying capital. Never invest funds you cannot afford to lose completely.
FAQ
What is the historical price trend of XNL tokens?
XNL reached an all-time high of $0.05 and currently trades at $0.0006463, representing a 98.79% decline. As of January 1, 2026, circulating supply stands at 202,001,000 XNL with a market cap of approximately $122,600.
What are the main factors affecting XNL price?
XNL price is primarily influenced by supply mechanisms and scarcity, institutional adoption, macroeconomic environment, market sentiment, trading volume, and technological developments within the Novastro ecosystem.
How to conduct XNL price technical analysis and prediction?
Analyze XNL price movements using historical data and trading volume to identify trends and patterns. Apply technical indicators like moving averages and RSI to forecast future price direction. Monitor market factors and chart patterns for predictive insights.
XNL未来价格前景和发展潜力如何?
XNL future price is expected to rise driven by offshore RMB market growth and expanding international adoption. Strong fundamentals from China's economic development and Belt and Road initiatives support long-term appreciation potential. Hong Kong's financial hub status further strengthens market confidence and demand.
What are the risks to note regarding XNL price predictions?
XNL price predictions carry risks including high volatility, limited liquidity, and competitive project pressure. These factors may significantly impact XNL's market performance and trading volume.
What are XNL's price advantages compared to other similar tokens?
XNL offers competitive pricing with an annual return rate up to 67% compared to similar tokens. Its high yield and voting rights integration provide strong value for holders seeking passive income opportunities.
* The information is not intended to be and does not constitute financial advice or any other recommendation of any sort offered or endorsed by Gate.