This comprehensive analysis examines KNC's market dynamics and price trajectory from 2026 to 2031. The article reviews Kyber Network Crystal's historical performance, current market position at $0.223 with a $37.94M market cap, and provides detailed price predictions across multiple scenarios. Key sections analyze the token's holding distribution (57.24% concentration in top addresses), market sentiment indicators showing current fear conditions, and core factors influencing future performance. The guide presents practical investment strategies for different investor profiles—from conservative 1-2% allocations to aggressive 5-10% positions—alongside comprehensive risk management frameworks including portfolio diversification and secure storage solutions on Gate. Long-term outlooks project price ranges of $0.237-$0.502 by 2031, contingent on DeFi adoption expansion and protocol competitiveness. The analysis also addresses regulatory risks, technical vulnerabilities, and competition challenges while recommendin
Introduction: KNC's Market Position and Investment Value
Kyber Network (KNC), as a decentralized trading platform designed for high-liquidity digital asset exchange, has been facilitating seamless token swaps since its launch in 2017. As of 2026, KNC maintains a market capitalization of approximately $37.94 million, with a circulating supply of around 170.15 million tokens, and the price hovers around $0.223. This asset, recognized as a pioneering liquidity protocol in the DeFi ecosystem, continues to play an increasingly vital role in enabling instant cryptocurrency exchanges and powering decentralized finance applications.
This article will comprehensively analyze KNC's price trajectory from 2026 to 2031, combining historical patterns, market supply-demand dynamics, ecosystem development, and macroeconomic conditions to provide investors with professional price forecasts and practical investment strategies.
I. KNC Price History Review and Market Status
KNC Historical Price Evolution Trajectory
- 2017: KNC was launched on October 1, 2017, with an initial offering price of $0.5, marking the beginning of its market journey in the decentralized exchange space
- 2022: KNC reached its historical peak on April 29, 2022, with the price climbing to $5.7, representing a significant milestone in the token's valuation amid the broader crypto market expansion
- 2025: The token experienced substantial correction, with the price declining to its historical low of $0.211149 on December 19, 2025, reflecting the challenging market conditions faced throughout the year
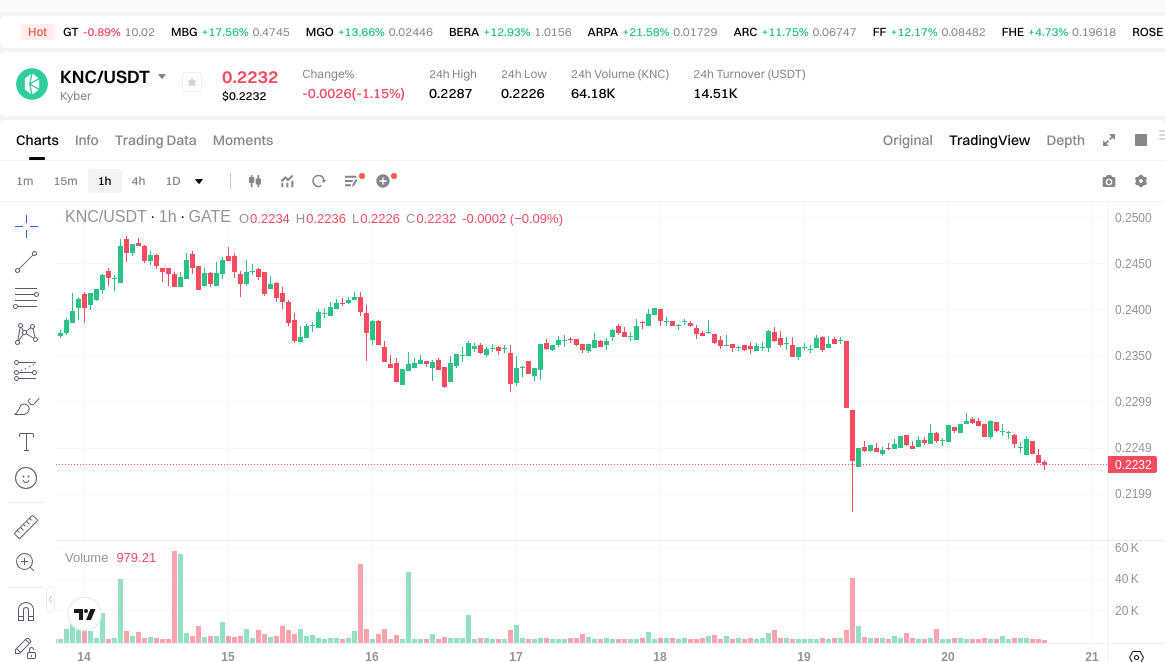
KNC Current Market Situation
As of January 20, 2026, KNC is trading at $0.223, showing a marginal recovery from its recent historical low. The token has experienced a -0.54% decline over the past hour and a -1.5% decrease in the last 24 hours, with trading activity reaching $14,553.89 in 24-hour volume. Over the past week, KNC has declined by -6.03%, while the 30-day performance shows a -2.53% decrease. The annual performance reflects a significant -57.96% decline, indicating prolonged market pressure.
The token's market capitalization stands at $37,944,085.82, with a circulating supply of 170,152,851.23 KNC tokens, representing approximately 67.44% of the total supply of 240,863,075.99 tokens. The maximum supply is capped at 252,301,550 tokens. KNC's fully diluted market capitalization reaches $53,712,465.95, with the token holding a 0.0016% share of the overall cryptocurrency market. The 24-hour price range has fluctuated between $0.2226 and $0.2287.
KNC is currently ranked at position 621 in the cryptocurrency market, with approximately 17,806 token holders. The token is listed on 30 exchanges and maintains active trading on Gate.com. The current market sentiment index shows a reading of 32, indicating a "Fear" sentiment level in the broader cryptocurrency market.
Click to view the current KNC market price
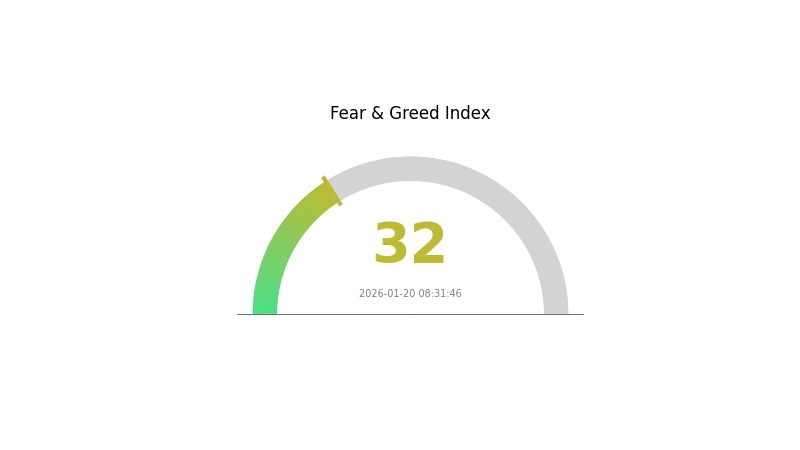
KNC Market Sentiment Index
2026-01-20 Fear and Greed Index: 32 (Fear)
Click to view current Fear & Greed Index
The cryptocurrency market is currently displaying significant fear sentiment with an index reading of 32. This indicates heightened investor anxiety and risk aversion in the market. During such fearful periods, market participants tend to adopt a cautious stance, with reduced trading activity and increased selling pressure. This contrarian indicator often signals potential buying opportunities for risk-tolerant investors, as markets typically recover after extreme fear phases. Monitor market developments closely and consider your risk tolerance before making investment decisions.
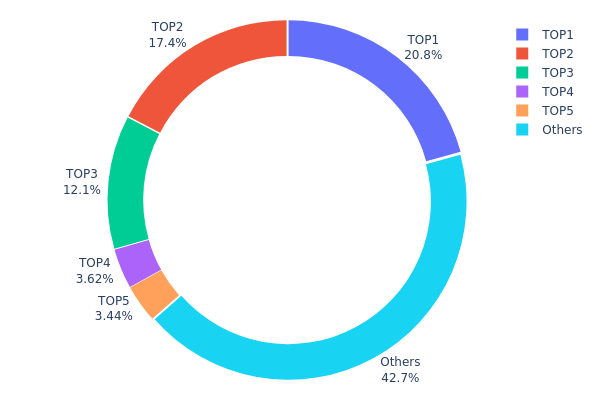
KNC Holding Distribution
The holding distribution chart illustrates the concentration of KNC tokens across different wallet addresses, providing insights into the decentralization level and potential market control dynamics. According to the latest data, the top five addresses collectively hold 138,942.74K KNC tokens, representing 57.24% of the total supply, while the remaining 42.76% is distributed among other addresses.
The current distribution reveals a moderate to high concentration pattern. The largest holder controls approximately 20.77% of the supply, followed by the second-largest with 17.36% and the third with 12.06%. This tri-polar concentration structure, where the top three addresses collectively hold over 50% of tokens, suggests significant centralization risks. Such concentration levels typically indicate that a relatively small group of entities—potentially including project treasury, early investors, or institutional participants—maintains substantial influence over the token's market dynamics.
From a market structure perspective, this concentration pattern presents both opportunities and vulnerabilities. The high holding percentage among top addresses could potentially lead to increased price volatility during large-scale liquidations or strategic repositioning. Additionally, concentrated holdings raise concerns about potential market manipulation risks, as coordinated actions by major holders could significantly impact price discovery mechanisms. However, the 42.76% distribution among other addresses indicates a reasonably active community base, which provides some degree of market stability and organic trading activity. This dual structure reflects a typical early-stage DeFi project distribution pattern, where maintaining balance between core stakeholder control and broader community participation remains crucial for long-term ecosystem health.
Click to view current KNC Holding Distribution
| Top |
Address |
Holding Qty |
Holding (%) |
| 1 |
0xeadb...72b3bd |
50044.62K |
20.77% |
| 2 |
0x80d2...3320d6 |
41822.93K |
17.36% |
| 3 |
0xf977...41acec |
29070.10K |
12.06% |
| 4 |
0x929a...1a5451 |
8726.07K |
3.62% |
| 5 |
0x941e...56a600 |
8279.02K |
3.43% |
| - |
Others |
102920.33K |
42.76% |
II. Core Factors Influencing KNC's Future Price
Due to the absence of sufficient data in the provided materials regarding KNC's supply mechanisms, institutional dynamics, macroeconomic environment, and technological developments, this section cannot be completed with accurate and verifiable information at this time.
III. 2026-2031 KNC Price Prediction
2026 Outlook
- Conservative prediction: $0.165-$0.223
- Neutral prediction: $0.223
- Optimistic prediction: $0.286 (requires favorable market conditions and increased adoption)
2027-2029 Mid-term Outlook
- Market stage expectation: The market may experience a gradual recovery phase with potential fluctuations as the ecosystem matures and DeFi adoption expands.
- Price range predictions:
- 2027: $0.160-$0.318
- 2028: $0.243-$0.404
- 2029: $0.255-$0.445
- Key catalysts: Protocol upgrades, strategic partnerships, broader DeFi market growth, and increasing liquidity provider participation could drive price appreciation during this period.
2030-2031 Long-term Outlook
- Baseline scenario: $0.237-$0.415 (assuming steady market development and maintained platform competitiveness)
- Optimistic scenario: $0.376-$0.502 (with enhanced protocol adoption and favorable regulatory environment)
- Transformational scenario: Potential to reach $0.502 (under conditions of significant DeFi sector expansion and dominant market positioning)
- 2026-01-20: KNC price predictions suggest a foundational range between $0.165 and $0.286, establishing a baseline for future growth trajectory.
| Year |
Predicted High Price |
Predicted Average Price |
Predicted Low Price |
Price Change |
| 2026 |
0.2857 |
0.2232 |
0.16517 |
0 |
| 2027 |
0.31806 |
0.25445 |
0.1603 |
14 |
| 2028 |
0.40362 |
0.28625 |
0.24332 |
28 |
| 2029 |
0.44497 |
0.34494 |
0.25525 |
54 |
| 2030 |
0.4147 |
0.39495 |
0.23697 |
76 |
| 2031 |
0.50198 |
0.40483 |
0.37649 |
81 |
IV. KNC Professional Investment Strategies and Risk Management
KNC Investment Methodology
(1) Long-term Holding Strategy
- Target Investors: Investors who believe in the long-term value of decentralized exchange infrastructure and DeFi ecosystem development
- Operational Recommendations:
- Consider accumulating positions during market corrections when KNC trades near support levels
- Monitor Kyber Network's protocol development progress and adoption metrics
- Utilize Gate Web3 Wallet for secure storage with multi-signature protection
(2) Active Trading Strategy
- Technical Analysis Tools:
- Moving Averages: Use 50-day and 200-day moving averages to identify trend directions and potential reversal points
- Volume Analysis: Monitor 24-hour trading volume ($14,553.89) relative to historical averages to gauge market interest
- Swing Trading Key Points:
- Pay attention to the 24-hour price range between $0.2226 and $0.2287 for short-term support and resistance levels
- Consider market correlation with broader DeFi sector performance
KNC Risk Management Framework
(1) Asset Allocation Principles
- Conservative Investors: 1-2% of crypto portfolio
- Aggressive Investors: 3-5% of crypto portfolio
- Professional Investors: 5-10% of crypto portfolio with active position management
(2) Risk Hedging Solutions
- Portfolio Diversification: Combine KNC holdings with other DeFi tokens and major cryptocurrencies to reduce concentration risk
- Position Sizing: Implement dollar-cost averaging to minimize timing risk given recent volatility
(3) Secure Storage Solutions
- Hot Wallet Recommendation: Gate Web3 Wallet for convenient trading and staking access
- Cold Storage Solution: Hardware wallet storage for long-term holdings exceeding short-term trading needs
- Security Considerations: Enable two-factor authentication, verify contract address (0xdeFA4e8a7bcBA345F687a2f1456F5Edd9CE97202) before transactions, and maintain secure backup of recovery phrases
V. KNC Potential Risks and Challenges
KNC Market Risks
- Price Volatility: KNC has declined 57.96% over the past year, demonstrating significant price sensitivity to market conditions
- Liquidity Concerns: With a market cap of approximately $37.94 million, KNC may experience higher volatility during periods of market stress
- Competition Risk: Increasing competition from other DEX aggregators and liquidity protocols may pressure market share
KNC Regulatory Risks
- DeFi Regulation Uncertainty: Evolving regulatory frameworks for decentralized exchanges and DeFi protocols could impact operations
- Compliance Requirements: Potential future requirements for decentralized protocols may affect protocol design and functionality
- Cross-border Regulatory Challenges: Operating across multiple jurisdictions may create complex compliance obligations
KNC Technical Risks
- Smart Contract Vulnerabilities: Despite audits, potential undiscovered vulnerabilities in protocol smart contracts could pose security risks
- Network Dependencies: As an ERC-20 token on Ethereum, KNC is subject to Ethereum network congestion and gas fee fluctuations
- Protocol Upgrade Risks: Technical upgrades to the Kyber Network protocol may introduce temporary instabilities or user adoption challenges
VI. Conclusion and Action Recommendations
KNC Investment Value Assessment
KNC represents exposure to the decentralized exchange infrastructure sector, with Kyber Network providing liquidity aggregation services across DeFi protocols. The token's 67.44% circulating supply ratio indicates a relatively mature distribution model. However, the significant year-over-year decline of 57.96% and current trading near historical lows ($0.223 vs. ATL of $0.211149) reflect challenging market conditions. Long-term value depends on continued protocol adoption, competitive positioning in the evolving DEX landscape, and successful execution of network upgrades. Short-term risks include ongoing market volatility and potential further corrections.
KNC Investment Recommendations
✅ Beginners: Start with small allocations (1-2% of crypto portfolio) and use dollar-cost averaging to build positions gradually while learning about DeFi protocols
✅ Experienced Investors: Consider tactical positions based on technical analysis and DeFi sector trends, maintaining 3-5% allocation with active risk management
✅ Institutional Investors: Conduct thorough due diligence on protocol fundamentals, evaluate competitive positioning, and implement structured entry strategies with 5-10% allocation range
KNC Trading Participation Methods
- Spot Trading: Purchase KNC directly on Gate.com for straightforward exposure to token price movements
- DeFi Integration: Participate in Kyber Network's liquidity provision programs to earn additional yields while holding KNC
- Portfolio Rebalancing: Use KNC as part of a diversified DeFi portfolio strategy, regularly adjusting allocations based on market conditions
Cryptocurrency investments carry extremely high risks. This article does not constitute investment advice. Investors should make prudent decisions based on their own risk tolerance and are advised to consult professional financial advisors. Never invest more than you can afford to lose.
FAQ
What is KNC? What are the uses of Kyber Network Crystal token?
KNC is the governance token of Kyber Network, a decentralized liquidity protocol. It enables holders to participate in protocol governance, earn fees from trading volume, and access platform incentives. KNC powers the ecosystem's core functions.
KNC has demonstrated strong volatility in the crypto market. Over the past year, KNC has experienced significant fluctuations, reflecting broader market dynamics. Historical data shows KNC trading across varying price ranges, with periods of notable gains and corrections. For precise historical performance metrics and year-over-year changes, detailed price charts and analytics provide comprehensive insights into KNC's trading trajectory.
What are the main factors affecting KNC price?
KNC price is primarily influenced by market demand and adoption of Kyber Network protocol, overall crypto market sentiment, trading volume and liquidity, network activity and transaction fees, competitive landscape of DEX solutions, and regulatory developments in the blockchain sector.
What is the KNC price prediction target for 2024-2025?
Based on market analysis, KNC is projected to reach $3.50-$5.00 range during 2024-2025, driven by increased platform adoption and ecosystem expansion. Long-term growth potential remains strong as DeFi continues maturing.
What advantages does KNC have compared to other DEX governance tokens like UNI and AAVE?
KNC powers Kyber Network's efficient liquidity protocol with lower slippage and faster trades. It offers unique fee-sharing mechanisms, direct governance participation in protocol improvements, and integration with multiple blockchain networks, providing superior capital efficiency and cross-chain functionality compared to competitors.
What are the risks to pay attention to when investing in KNC?
KNC investment risks include market volatility, regulatory changes, liquidity fluctuations, and smart contract vulnerabilities. Monitor token fundamentals, trading volume, and ecosystem developments carefully to make informed decisions.
* The information is not intended to be and does not constitute financial advice or any other recommendation of any sort offered or endorsed by Gate.