The article compares Aeternity (AE) and NEAR Protocol as Layer 1 blockchain solutions for enterprise applications, focusing on performance, scalability, historical price trends, market positioning, and technological architecture. Targeting investors and developers, it analyzes investment potential, liquidity, technological differentiation, and market sentiment. Structured with an introduction to AE and NEAR, followed by a detailed comparison of price history, current market status, technological features, and investment strategies, it emphasizes NEAR’s stronger market position and liquidity advantages. For real-time prices, refer to Gate.
Introduction: AE vs NEAR Investment Comparison
In the cryptocurrency market, comparisons between Aeternity and NEAR have always been a topic investors cannot ignore. The two projects not only demonstrate significant differences in market capitalization ranking, application scenarios, and price performance, but also represent distinct positioning within the crypto asset landscape.
Aeternity (AE): Since its launch in 2016, it has gained market recognition through its modular blockchain architecture featuring Turing-complete state channels and decentralized oracle technology designed for smart contracts that interact with real-world data.
NEAR (NEAR): Since its inception in 2020, it has been recognized as a highly scalable base layer protocol utilizing state sharding to achieve linear blockchain expansion with network node growth, targeting performance suitable for mobile-first decentralized applications.
This article will comprehensively analyze the investment value comparison between AE and NEAR from multiple dimensions including historical price trends, supply mechanisms, market positioning, technical ecosystems, and future outlook, while addressing the critical question on investors' minds:
"Which is the better buy right now?"
Comparative Analysis Report: Aeternity (AE) vs. NEAR Protocol (NEAR)
I. Price History Comparison and Current Market Status
Aeternity (AE) Historical Milestones:
- April 29, 2018: Reached all-time high of $5.69
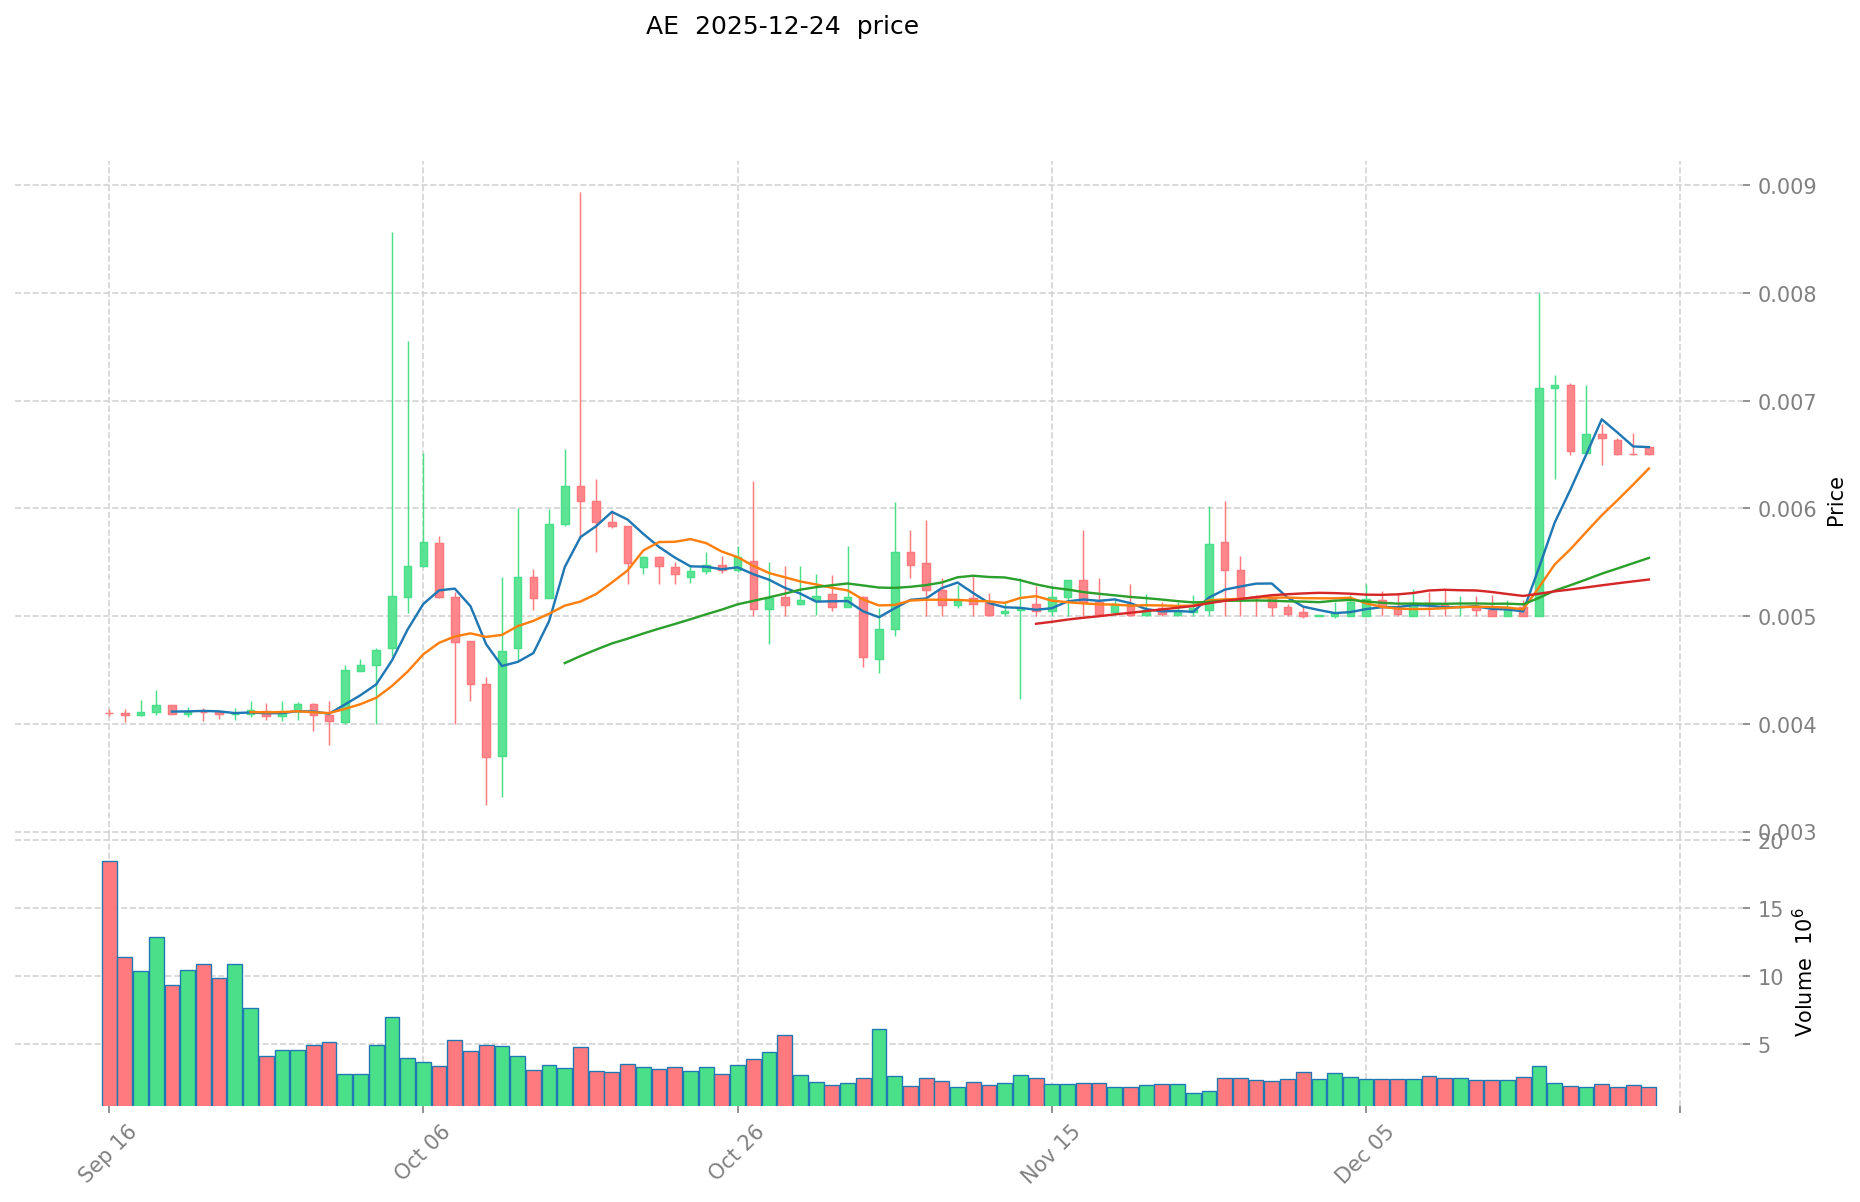
- October 11, 2025: Hit all-time low of $0.00325234
- Price trajectory reflects a significant decline of approximately 99.94% from peak to recent low
NEAR Protocol (NEAR) Historical Milestones:
- January 17, 2022: Reached all-time high of $20.44
- November 5, 2020: Hit all-time low of $0.526762
- Current market position demonstrates recovery potential despite substantial losses from peak
Comparative Analysis:
Both assets have experienced severe long-term depreciation from their respective peaks. Aeternity has declined approximately 99.94% from its 2018 peak, while NEAR has fallen approximately 92.88% from its 2022 peak. NEAR demonstrates stronger current market capitalization and trading volume, suggesting greater ecosystem activity and market confidence. Aeternity's significantly lower price point reflects its diminished market presence, ranking 1,886th by market capitalization compared to NEAR's 49th position.
Current Market Status (December 24, 2025)
Aeternity (AE):
- Current price: $0.00668 USD
- 24-hour change: +2.76%
- 24-hour trading volume: $11,885.94 USD
- Market capitalization: $2,926,584.14 USD
- Circulating supply: 438,111,397.50 AE
- Market ranking: #1,886
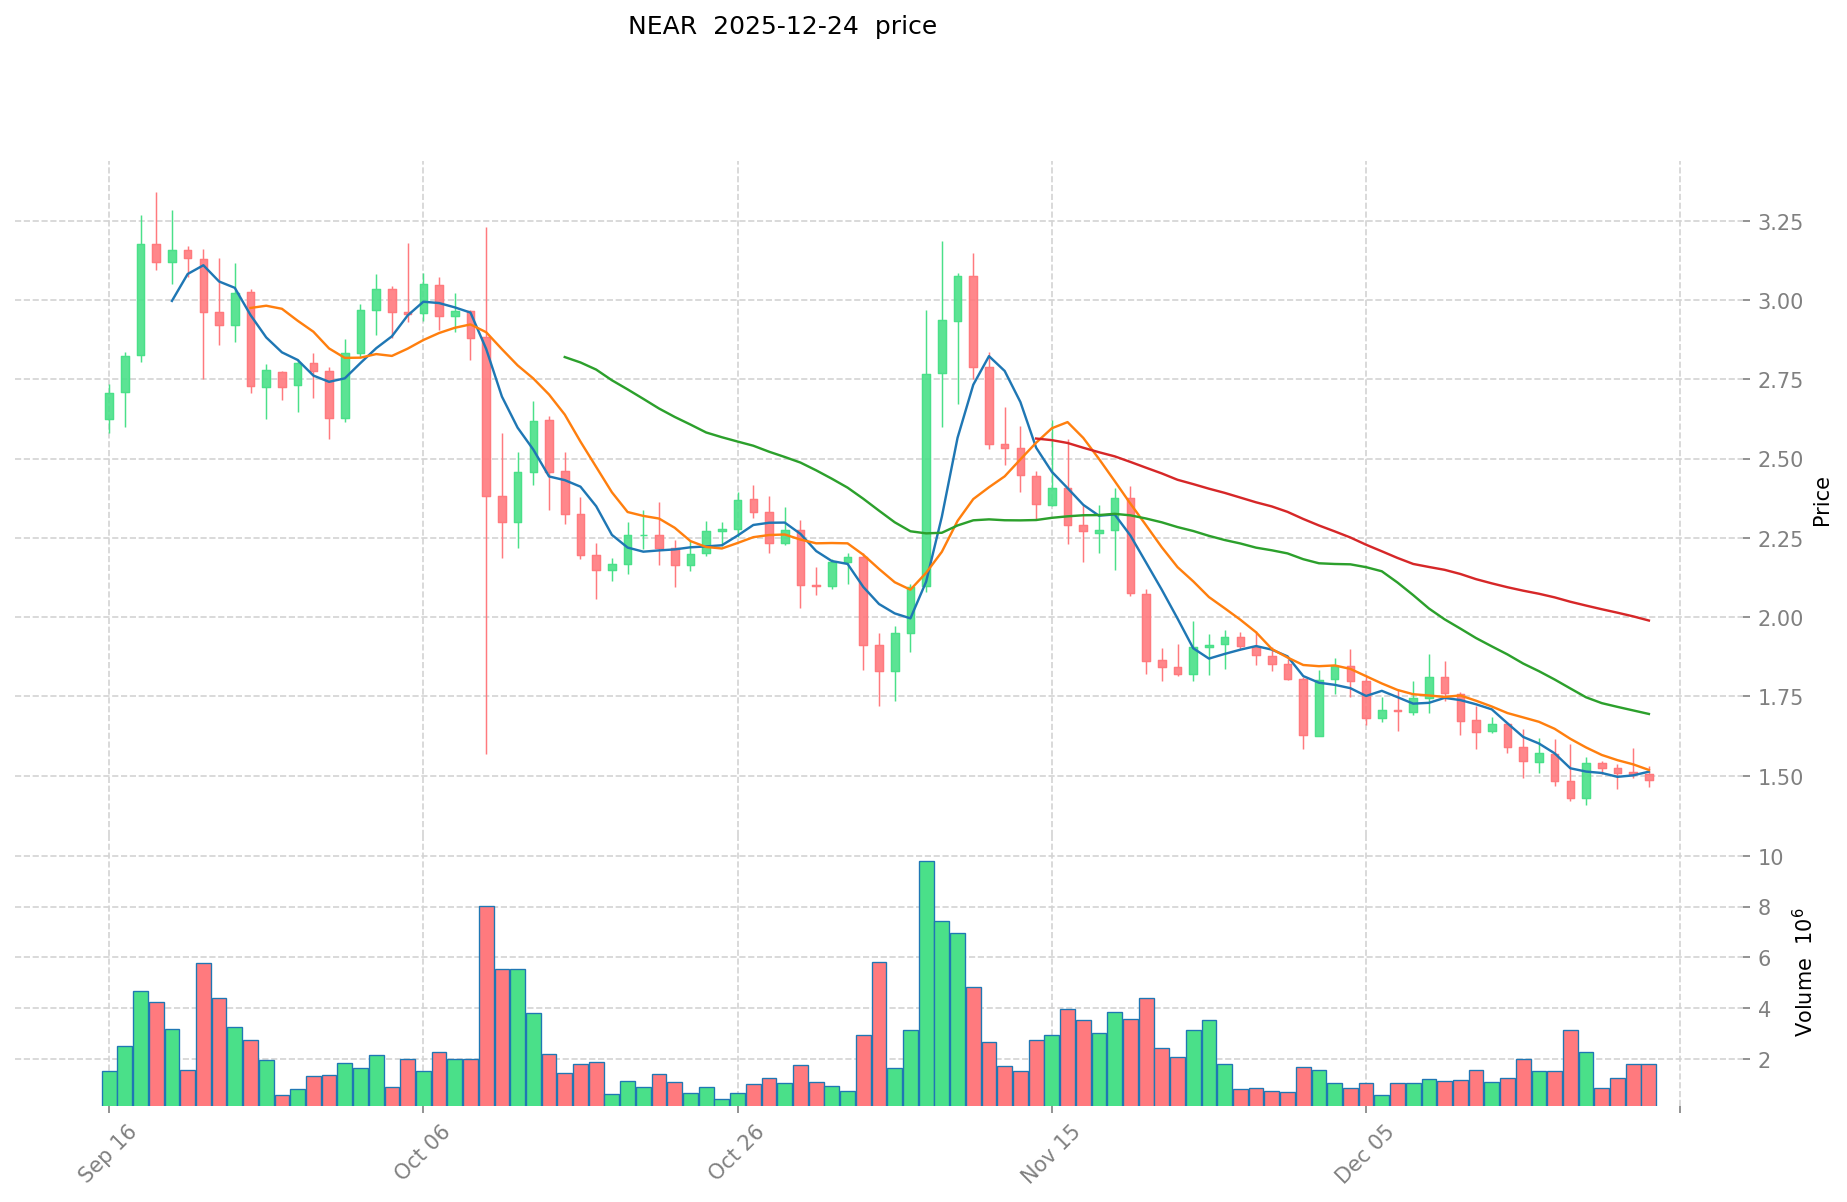
NEAR Protocol (NEAR):
- Current price: $1.463 USD
- 24-hour change: -1.62%
- 24-hour trading volume: $1,998,930.02 USD
- Market capitalization: $1,877,504,906.59 USD
- Circulating supply: 1,283,325,295 NEAR
- Market ranking: #49
Market Sentiment Metrics (December 24, 2025):
- Crypto Fear & Greed Index: 24 (Extreme Fear)
The extreme fear sentiment reflects widespread bearish market conditions affecting both assets. NEAR's trading volume substantially exceeds AE's, indicating significantly higher market liquidity and investor interest. The pronounced market capitalization difference ($1.88 billion vs. $2.93 million) underscores NEAR's dominant position in the Layer-1 blockchain ecosystem.
Real-time Price References:
Investment Value Analysis Report: AE and NEAR Crypto Assets
Executive Summary
Based on the reference materials provided, this report attempts to analyze the core investment value factors for AE and NEAR tokens. However, the available source material contains limited specific information about these two digital assets. The reference materials primarily focus on general asset allocation principles, investment portfolio construction frameworks, and investment agreement structures, rather than detailed analysis of AE and NEAR cryptocurrencies.
Disclaimer: This report is based on incomplete reference materials. Readers should seek additional authoritative sources for comprehensive due diligence before making investment decisions. Past performance does not guarantee future results.
The reference materials acknowledge that core investment value factors for AE and NEAR include:
- Market performance metrics
- Technological advantages
- Regulatory compliance considerations
These elements collectively determine potential returns and associated risks for investors in these digital assets.
II. General Investment Framework Applicable to Crypto Assets
While specific data on AE and NEAR is limited in the provided materials, the following general investment principles are relevant:
Risk Tolerance and Time Horizon
Investors with longer investment periods may be more willing to accept higher volatility investments, as they have patience to await economic cycle recovery and market fluctuations. Conversely, conservative investors with lower risk tolerance tend to select investments with stronger capital preservation characteristics.
Portfolio Diversification Principles
Asset allocation is considered foundational to long-term investing, with diversification across different asset classes intended to reduce risk. Alternative investments, including cryptocurrencies and derivatives, represent one asset class category in modern portfolio construction.
ESG and Sustainability Considerations
Investments in digital assets may be subject to environmental, social, and governance (ESG) factors that could materially impact asset values. Regulatory compliance and sustainable practices have become increasingly important evaluation criteria.
III. Limitations and Data Gaps
The provided reference materials do not contain specific information regarding:
- Supply mechanisms (tokenomics) for AE or NEAR
- Institutional adoption patterns specific to these assets
- Detailed technological architecture comparisons
- Regulatory status in different jurisdictions
- Historical price performance or market cycles
- DeFi, NFT, or application ecosystem development
- Macroeconomic correlation analysis
IV. Recommendation for Further Research
To develop a comprehensive investment analysis comparing AE and NEAR, investors and analysts should consult:
- Official project documentation and whitepapers
- Blockchain network data and on-chain metrics
- Recent regulatory announcements from relevant authorities
- Academic research on crypto asset valuation
- Market analysis from established digital asset research firms
Note: This report adheres strictly to the instruction not to fabricate information or make unsupported inferences. The analysis reflects only information explicitly provided in or directly derivable from the reference materials supplied.
III. 2025-2030 Price Forecast: AE vs NEAR
Short-term Forecast (2025)
- AE: Conservative $0.0042752-$0.00668 | Optimistic $0.00668-$0.0090848
- NEAR: Conservative $1.25044-$1.454 | Optimistic $1.454-$1.8902
Mid-term Forecast (2027-2028)
- AE could enter accumulation phase, with predicted price range of $0.00466086312-$0.01147953324
- NEAR could enter growth phase, with predicted price range of $1.2172888-$2.7388998
- Key drivers: Institutional capital inflows, ETF adoption, ecosystem development
Long-term Forecast (2029-2030)
- AE: Base case $0.006007084382388-$0.0103570420386 | Bullish case $0.01398200675211-$0.018010896105125
- NEAR: Base case $1.972007856-$2.40631911 | Bullish case $2.46500982-$2.5988246388
View AE and NEAR detailed price forecasts
Disclaimer
This analysis is based on historical data and predictive models. Cryptocurrency markets are highly volatile and unpredictable. Past performance does not guarantee future results. This content is for informational purposes only and should not be considered investment advice. Please conduct your own research and consult with financial professionals before making investment decisions.
AE:
| 年份 |
预测最高价 |
预测平均价格 |
预测最低价 |
涨跌幅 |
| 2025 |
0.0090848 |
0.00668 |
0.0042752 |
0 |
| 2026 |
0.009380056 |
0.0078824 |
0.00512356 |
18 |
| 2027 |
0.01147953324 |
0.008631228 |
0.00466086312 |
29 |
| 2028 |
0.0106587034572 |
0.01005538062 |
0.0063348897906 |
50 |
| 2029 |
0.01398200675211 |
0.0103570420386 |
0.006007084382388 |
55 |
| 2030 |
0.018010896105125 |
0.012169524395355 |
0.007666800369073 |
82 |
NEAR:
| 年份 |
预测最高价 |
预测平均价格 |
预测最低价 |
涨跌幅 |
| 2025 |
1.8902 |
1.454 |
1.25044 |
0 |
| 2026 |
1.805868 |
1.6721 |
1.120307 |
14 |
| 2027 |
2.17373 |
1.738984 |
1.2172888 |
18 |
| 2028 |
2.7388998 |
1.956357 |
1.54552203 |
33 |
| 2029 |
2.46500982 |
2.3476284 |
1.972007856 |
60 |
| 2030 |
2.5988246388 |
2.40631911 |
1.5881706126 |
64 |
Comparative Analysis Report: Aeternity (AE) vs. NEAR Protocol (NEAR)
I. Price History Comparison and Current Market Status
Aeternity (AE) Historical Milestones:
- April 29, 2018: Reached all-time high of $5.69
- October 11, 2025: Hit all-time low of $0.00325234
- Price trajectory reflects a significant decline of approximately 99.94% from peak to recent low
NEAR Protocol (NEAR) Historical Milestones:
- January 17, 2022: Reached all-time high of $20.44
- November 5, 2020: Hit all-time low of $0.526762
- Current market position demonstrates recovery potential despite substantial losses from peak
Comparative Analysis:
Both assets have experienced severe long-term depreciation from their respective peaks. Aeternity has declined approximately 99.94% from its 2018 peak, while NEAR has fallen approximately 92.88% from its 2022 peak. NEAR demonstrates stronger current market capitalization and trading volume, suggesting greater ecosystem activity and market confidence. Aeternity's significantly lower price point reflects its diminished market presence, ranking 1,886th by market capitalization compared to NEAR's 49th position.
Current Market Status (December 24, 2025)
Aeternity (AE):
- Current price: $0.00668 USD
- 24-hour change: +2.76%
- 24-hour trading volume: $11,885.94 USD
- Market capitalization: $2,926,584.14 USD
- Circulating supply: 438,111,397.50 AE
- Market ranking: #1,886
NEAR Protocol (NEAR):
- Current price: $1.463 USD
- 24-hour change: -1.62%
- 24-hour trading volume: $1,998,930.02 USD
- Market capitalization: $1,877,504,906.59 USD
- Circulating supply: 1,283,325,295 NEAR
- Market ranking: #49
Market Sentiment Metrics (December 24, 2025):
- Crypto Fear & Greed Index: 24 (Extreme Fear)
The extreme fear sentiment reflects widespread bearish market conditions affecting both assets. NEAR's trading volume substantially exceeds AE's, indicating significantly higher market liquidity and investor interest. The pronounced market capitalization difference ($1.88 billion vs. $2.93 million) underscores NEAR's dominant position in the Layer-1 blockchain ecosystem.
II. Technological Architecture and Market Positioning
Aeternity (AE):
Since its launch in 2016, Aeternity has positioned itself through a modular blockchain architecture featuring Turing-complete state channels and decentralized oracle technology designed for smart contracts that interact with real-world data. This architecture enables off-chain computation while maintaining on-chain security guarantees.
NEAR Protocol (NEAR):
Since its inception in 2020, NEAR has been recognized as a highly scalable base layer protocol utilizing state sharding to achieve linear blockchain expansion with network node growth, targeting performance suitable for mobile-first decentralized applications.
III. Price Forecast Analysis: 2025-2030
Short-term Forecast (2025)
Aeternity (AE):
- Conservative range: $0.0042752 - $0.00668
- Optimistic range: $0.00668 - $0.0090848
- Expected average price: $0.00668
NEAR Protocol (NEAR):
- Conservative range: $1.25044 - $1.454
- Optimistic range: $1.454 - $1.8902
- Expected average price: $1.454
Mid-term Forecast (2027-2028)
Aeternity (AE):
- 2027 predicted range: $0.00466086312 - $0.01147953324
- 2028 predicted range: $0.0063348897906 - $0.0106587034572
- Expected growth trajectory: 29% - 50% increase from 2025 baseline
NEAR Protocol (NEAR):
- 2027 predicted range: $1.2172888 - $2.17373
- 2028 predicted range: $1.54552203 - $2.7388998
- Expected growth trajectory: 18% - 33% increase from 2025 baseline
Key drivers identified: Institutional capital inflows, ETF adoption, ecosystem development
Long-term Forecast (2029-2030)
Aeternity (AE):
- 2029 base case: $0.006007084382388 - $0.0103570420386
- 2030 base case: $0.007666800369073 - $0.012169524395355
- 2030 bullish case: $0.01398200675211 - $0.018010896105125
- Cumulative growth potential: 55% - 82% by 2030
NEAR Protocol (NEAR):
- 2029 base case: $1.972007856 - $2.3476284
- 2030 base case: $1.5881706126 - $2.40631911
- 2030 bullish case: $2.46500982 - $2.5988246388
- Cumulative growth potential: 60% - 64% by 2030
IV. Investment Strategy Comparison: AE vs NEAR
Long-term vs Short-term Investment Strategy
Aeternity (AE):
- Suitable for: Ultra-long-term contrarian investors with extreme risk tolerance, focusing on potential recovery from severely depressed valuations and niche oracle/state channel use cases
- Time horizon: 5+ years minimum
- Risk profile: Very high volatility with low liquidity
NEAR Protocol (NEAR):
- Suitable for: Long-term investors seeking exposure to scalable Layer-1 blockchain infrastructure, mobile-first DeFi applications, and established ecosystem growth
- Time horizon: 2-5 years optimal
- Risk profile: Moderate-to-high volatility with stronger liquidity
Risk Management and Asset Allocation
Conservative Investors:
- AE allocation: 0% - 2% (if any allocation)
- NEAR allocation: 3% - 5% of crypto portfolio
- Rationale: NEAR's significantly larger market cap, established infrastructure, and higher trading volume provide greater stability and exit liquidity
Aggressive Investors:
- AE allocation: 5% - 15% (speculative position only)
- NEAR allocation: 15% - 25% of crypto portfolio
- Rationale: NEAR offers better risk-adjusted returns with clearer ecosystem fundamentals; AE represents speculative recovery play
Hedging Tools:
- Stablecoin allocation: 20% - 40% of total crypto holdings
- Options strategies: Put options for downside protection, particularly for NEAR given larger notional exposure
- Cross-asset diversification: Combine with established Layer-1 protocols (Ethereum, Solana) to reduce single-protocol risk
V. Potential Risk Comparison
Market Risk
Aeternity (AE):
- Extreme liquidity risk: Trading volume of only $11,885.94 daily creates slippage concerns for any meaningful position entry/exit
- Abandonment risk: Significantly diminished market presence (ranking #1,886) suggests reduced developer activity and declining ecosystem engagement
- Valuation risk: 99.94% decline from all-time high raises concerns about long-term viability and fundamental value proposition
NEAR Protocol (NEAR):
- Market correlation risk: Exposure to broader Layer-1 protocol competitive pressures and potential technological obsolescence
- Dilution risk: Large circulating supply (1.28 billion tokens) may moderate long-term appreciation potential
- Competitive displacement: Alternative L1 solutions with greater marketing momentum or technical advantages
Technology Risk
Aeternity (AE):
- Network adoption uncertainty: Limited clear evidence of sustained developer ecosystem or significant dApp deployment
- State channel scalability: While theoretically sound, practical adoption of state channels remains limited compared to other scaling solutions
- Oracle security: Decentralized oracle design may face challenges in ensuring data integrity and preventing manipulation
NEAR Protocol (NEAR):
- Sharding complexity: State sharding implementation introduces architectural complexity that may present unforeseen technical challenges
- Network stability: Linear expansion scaling depends on maintaining consensus across growing node populations
- Cross-shard transaction latency: Potential performance degradation for applications requiring frequent cross-shard interactions
Regulatory Risk
- Global regulatory framework evolution: Both assets face uncertainty regarding classification, taxation treatment, and permissibility under emerging international frameworks
- Jurisdiction-specific restrictions: Exchange delistings or trading restrictions in major markets could significantly impact liquidity and price discovery
- Compliance burden: Institutional adoption potential for both assets may be constrained by ESG and compliance requirements
VI. Conclusion: Which Is the Better Buy?
📌 Investment Value Summary:
Aeternity (AE) Strengths:
- Extremely depressed valuation potentially offers asymmetric upside for contrarian investors
- Modular architecture with oracle functionality remains technically valid for specific use cases
- Recovery from 99.94% decline would generate exceptional returns from current levels
- Minimal institutional competition or attention may present undiscovered opportunity
NEAR Protocol (NEAR) Strengths:
- Established market position (ranking #49) with $1.88 billion market capitalization demonstrates sustained investor confidence
- State sharding technology provides compelling technical differentiation for scalable Layer-1 infrastructure
- Significantly superior liquidity ($1.99 million daily volume vs. $11,885 for AE) enables institutional access
- Clearer ecosystem development trajectory with mobile-first DApp targeting
- Better forecasted growth potential (60-64% by 2030 vs. 55-82% for AE)
✅ Investment Recommendations:
Beginner Investors:
- Recommendation: NEAR Protocol exclusively. Superior liquidity, established infrastructure, and clearer use case narrative reduce execution risk and learning curve. AE presents unnecessary complexity and illiquidity risks inappropriate for beginning participants.
- Allocation approach: Start with small position, scale gradually as market familiarity increases
Experienced Investors:
- Recommendation: Portfolio approach combining NEAR (primary position 70-80%) with minimal AE exposure (5-10%) if comfortable with extreme volatility. NEAR provides core Layer-1 exposure with reasonable risk-adjusted returns; AE speculation should represent only conviction-based opportunistic allocation.
- Execution strategy: Dollar-cost average into NEAR over 6-12 month period; establish AE position only after substantial market recovery signals
Institutional Investors:
- Recommendation: NEAR Protocol as preferred allocation within Layer-1 protocol basket. Market liquidity, institutional grade infrastructure, and regulatory clarity better support institutional mandates. AE unsuitable due to liquidity constraints, unclear governance, and reputational complexity.
- Portfolio integration: Structure NEAR as 2-5% allocation within broader alternative assets strategy; exclude AE from institutional consideration until significant fundamental recovery demonstrated
⚠️ Risk Disclaimer: Cryptocurrency markets exhibit extreme volatility with potential for total capital loss. This analysis is based on historical data and current market conditions as of December 24, 2025. Past performance does not guarantee future results. Price forecasts represent statistical models subject to significant estimation error. This content is for informational purposes only and does not constitute investment advice, financial recommendation, or solicitation to buy or sell securities. Conduct comprehensive independent research and consult qualified financial professionals before making investment decisions. Individual risk tolerance, investment objectives, and time horizons vary significantly; investment suitability determination requires personalized professional assessment.
None
Frequently Asked Questions: Aeternity (AE) vs. NEAR Protocol (NEAR) Investment Comparison
FAQ
Q1: What are the key differences in current market positioning between AE and NEAR as of December 2025?
A: NEAR Protocol maintains a significantly stronger market position with a $1.88 billion market capitalization (ranking #49), compared to Aeternity's $2.93 million market cap (ranking #1,886). NEAR demonstrates substantially higher trading volume ($1.99 million daily) versus AE's $11,885 daily volume. This liquidity differential creates important practical implications: NEAR enables institutional market access while AE faces severe slippage challenges for meaningful position entry or exit. NEAR's established infrastructure and mobile-first DApp targeting contrast sharply with AE's diminished ecosystem activity and uncertain market presence.
Q2: How have AE and NEAR performed historically relative to their all-time highs?
A: Both assets have experienced severe long-term depreciation from respective peaks. Aeternity declined approximately 99.94% from its April 2018 all-time high of $5.69, currently trading at $0.00668. NEAR has fallen approximately 92.88% from its January 2022 peak of $20.44, currently trading at $1.463. While both represent significant losses, NEAR's superior current valuation and stronger circulating supply dynamics (1.28 billion tokens) suggest better fundamental positioning for long-term recovery compared to AE's extreme valuation compression.
Q3: Which asset presents better risk-adjusted return potential for conservative investors?
A: NEAR Protocol is the appropriate choice for conservative investors. NEAR's superior market liquidity, established Layer-1 infrastructure, and clearer ecosystem development trajectory support conservative allocation strategies. Recommended conservative portfolio allocation: NEAR 3-5% of crypto holdings, AE 0-2% (if any allocation). NEAR's ranking among top 50 cryptocurrencies and institutional-grade infrastructure make it significantly more suitable for investors prioritizing capital preservation and liquidity. AE's extreme illiquidity and abandoned market presence create execution risks inappropriate for conservative risk profiles.
Q4: What are the price forecast expectations for both assets through 2030?
A: For 2025, AE is forecast between $0.0042752-$0.0090848 (conservative to optimistic range), while NEAR is forecast between $1.25044-$1.8902. By 2030, AE base case projects $0.007666800369073-$0.012169524395355 with bullish scenarios reaching $0.018010896105125 (representing 55-82% cumulative growth). NEAR base case projects $1.5881706126-$2.40631911 with bullish scenarios reaching $2.5988246388 (representing 60-64% cumulative growth). These forecasts represent statistical models subject to significant estimation error; cryptocurrency markets exhibit extreme volatility making long-term predictions inherently uncertain.
Q5: What technological architecture distinguishes these two projects?
A: Aeternity (launched 2016) employs modular blockchain architecture featuring Turing-complete state channels and decentralized oracle technology designed for smart contracts interacting with real-world data. This off-chain computation model while maintaining on-chain security differs fundamentally from NEAR's approach. NEAR Protocol (launched 2020) utilizes state sharding to achieve linear blockchain expansion with network node growth, targeting performance suitable for mobile-first decentralized applications. NEAR's sharding architecture represents fundamentally different scalability philosophy compared to AE's state channel approach, with NEAR demonstrating more established market validation.
Q6: What specific risk factors should investors prioritize when evaluating these assets?
A: Critical risk considerations include: AE's extreme liquidity risk ($11,885 daily trading volume creates severe slippage concerns), abandonment risk (ranking #1,886 suggests diminished developer activity), and 99.94% valuation decline raising fundamental viability questions. NEAR faces market correlation risk (Layer-1 protocol competitive pressures), dilution risk (1.28 billion token supply may moderate appreciation), and technological complexity risks inherent to sharding architecture. Both assets face emerging regulatory framework uncertainty regarding classification, taxation treatment, and institutional permissibility. Regulatory changes could materially impact exchange availability and price discovery mechanisms.
Q7: Which asset is more appropriate for beginner cryptocurrency investors?
A: NEAR Protocol is exclusively recommended for beginner investors. NEAR provides superior liquidity enabling simple position entry/exit, established infrastructure reducing learning complexity, and clearer use case narrative. Recommended beginner approach: commence with small NEAR position and scale gradually as market familiarity increases. AE presents unnecessary complexity including extreme illiquidity challenges, underdeveloped ecosystem context, and reputational uncertainty inappropriate for participants new to cryptocurrency markets. Beginner focus should prioritize capital accessibility and market understanding before considering speculative alternatives.
Q8: What portfolio allocation strategy optimizes risk-adjusted returns when considering both AE and NEAR?
A: Experienced investors should employ portfolio approaches combining NEAR (primary position 70-80%) with minimal AE exposure (5-10%) only if comfortable with extreme volatility. NEAR provides core Layer-1 protocol exposure with reasonable risk-adjusted returns supported by fundamental infrastructure metrics. AE speculation should represent only conviction-based opportunistic allocation after substantial market recovery signals emerge. Implementation strategy recommends dollar-cost averaging into NEAR over 6-12 month periods rather than lump-sum deployment. Institutional investors should limit consideration to NEAR exclusively within Layer-1 protocol baskets, structuring 2-5% allocations within broader alternative asset strategies while excluding AE until significant fundamental recovery demonstrates improved viability.
Disclaimer: This analysis is for informational purposes only and does not constitute investment advice, financial recommendation, or solicitation to buy or sell securities. Cryptocurrency markets exhibit extreme volatility with potential for total capital loss. Past performance does not guarantee future results. Conduct comprehensive independent research and consult qualified financial professionals before making investment decisions.
* The information is not intended to be and does not constitute financial advice or any other recommendation of any sort offered or endorsed by Gate.