This article explores the investment comparison between AT and AAVE, focusing on price trends, supply mechanisms, institutional adoption, and technological ecosystems. It aims to determine which token offers better investment value by addressing key factors affecting their market position. The article is ideal for both new and experienced investors seeking insights into cryptocurrency choices, including risk management and asset allocation strategies. By providing a detailed analysis, readers can learn about the comparative advantages of AT's oracle capabilities and AAVE's established DeFi protocols, guiding investment decisions.
Introduction: Investment Comparison of AT vs AAVE
In the cryptocurrency market, the comparison between AT and AAVE has been an unavoidable topic for investors. The two not only show significant differences in market cap ranking, application scenarios, and price performance, but also represent different positions in crypto assets.
APRO Token (AT): Launched as an AI-enhanced oracle powering next-gen ecosystems across RWA, AI, Prediction Markets, and DeFi, it has gained market recognition for providing verified, real-time data for both standard and non-standard assets.
AAVE (AAVE): Introduced in 2020 through a token swap, it has been hailed as an open-source decentralized lending protocol, providing deposit and lending services to users.
This article will comprehensively analyze the investment value comparison between AT and AAVE, focusing on historical price trends, supply mechanisms, institutional adoption, technological ecosystems, and future predictions, attempting to answer the question investors care about most:
"Which is the better buy right now?"
I. Price History Comparison and Current Market Status
AT (Coin A) and AAVE (Coin B) Historical Price Trends
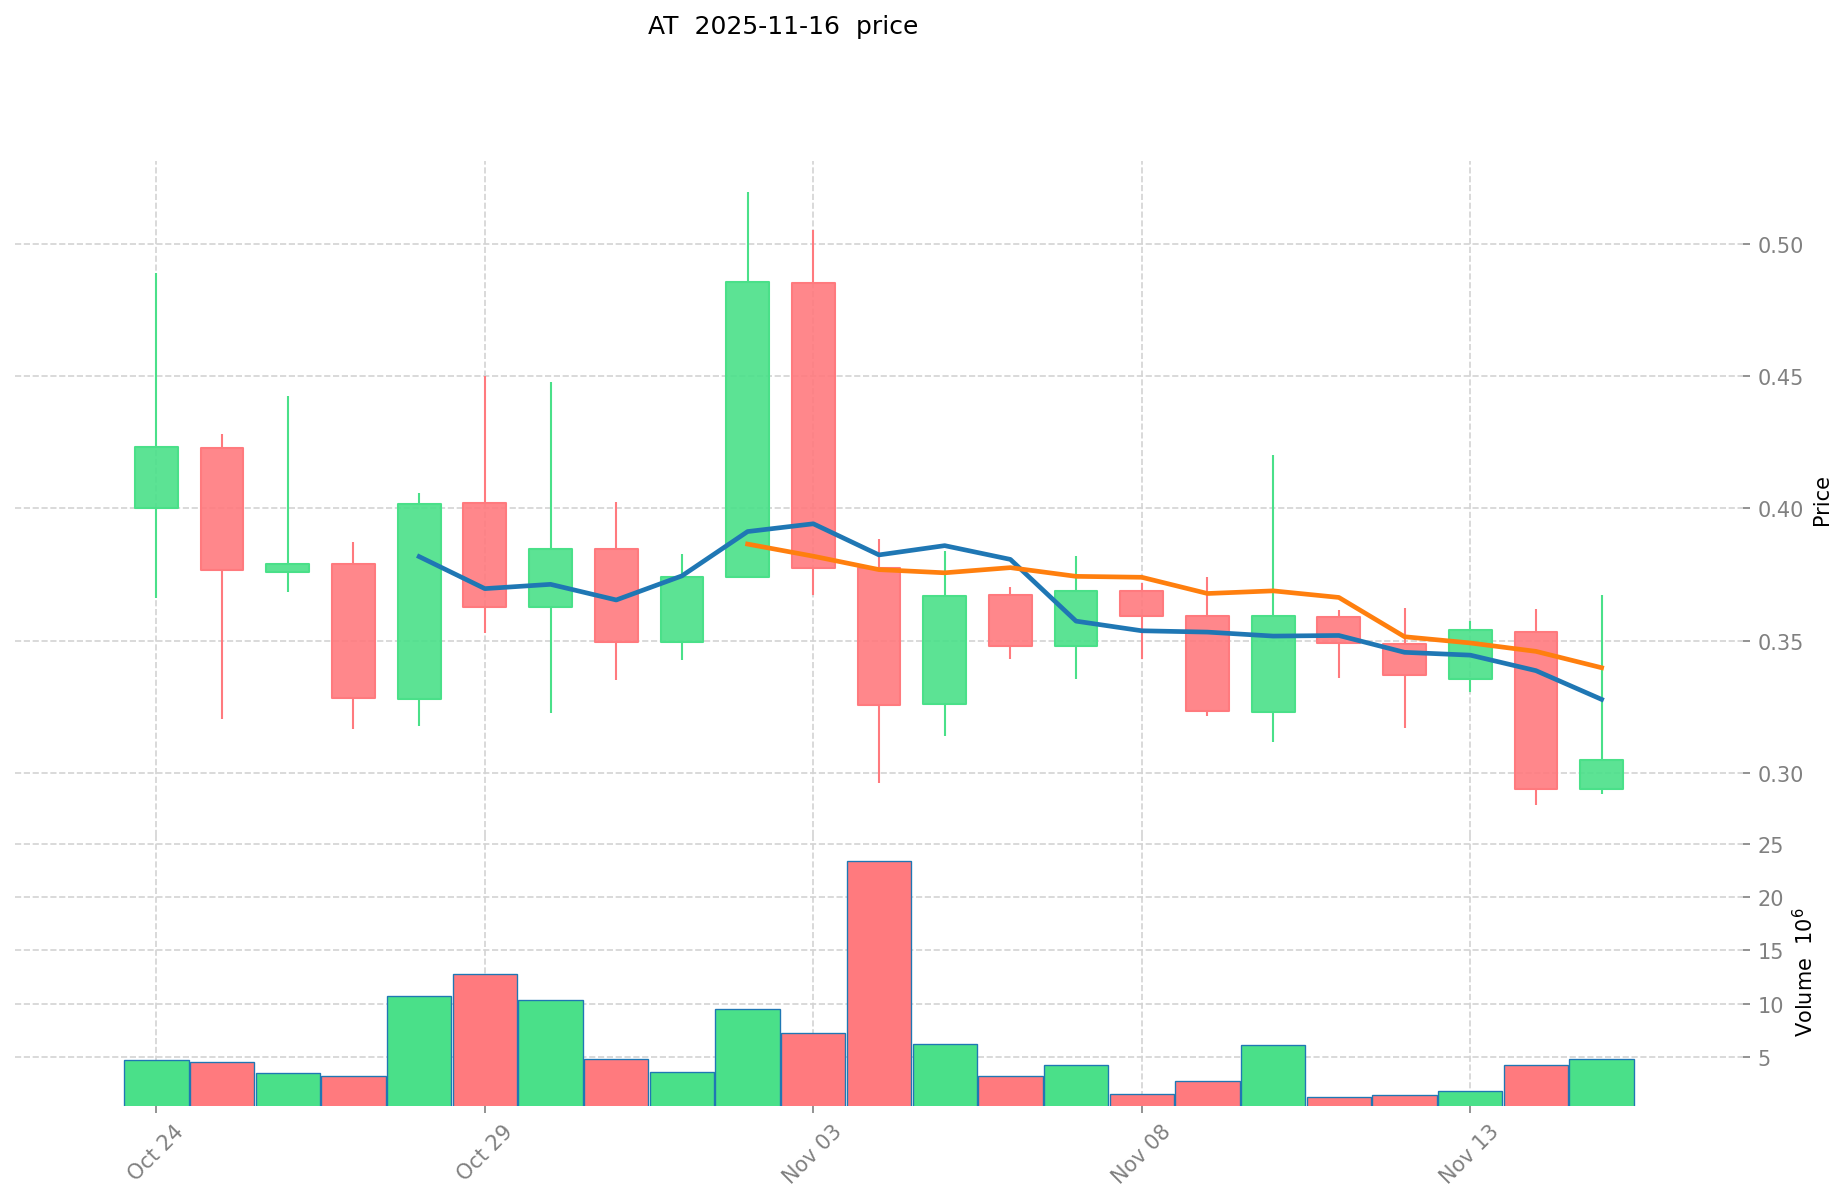
- 2025: AT reached its all-time high of $0.5196 on November 2, 2025, and its all-time low of $0.2878 on November 14, 2025.
- 2021: AAVE reached its all-time high of $661.69 on May 19, 2021.
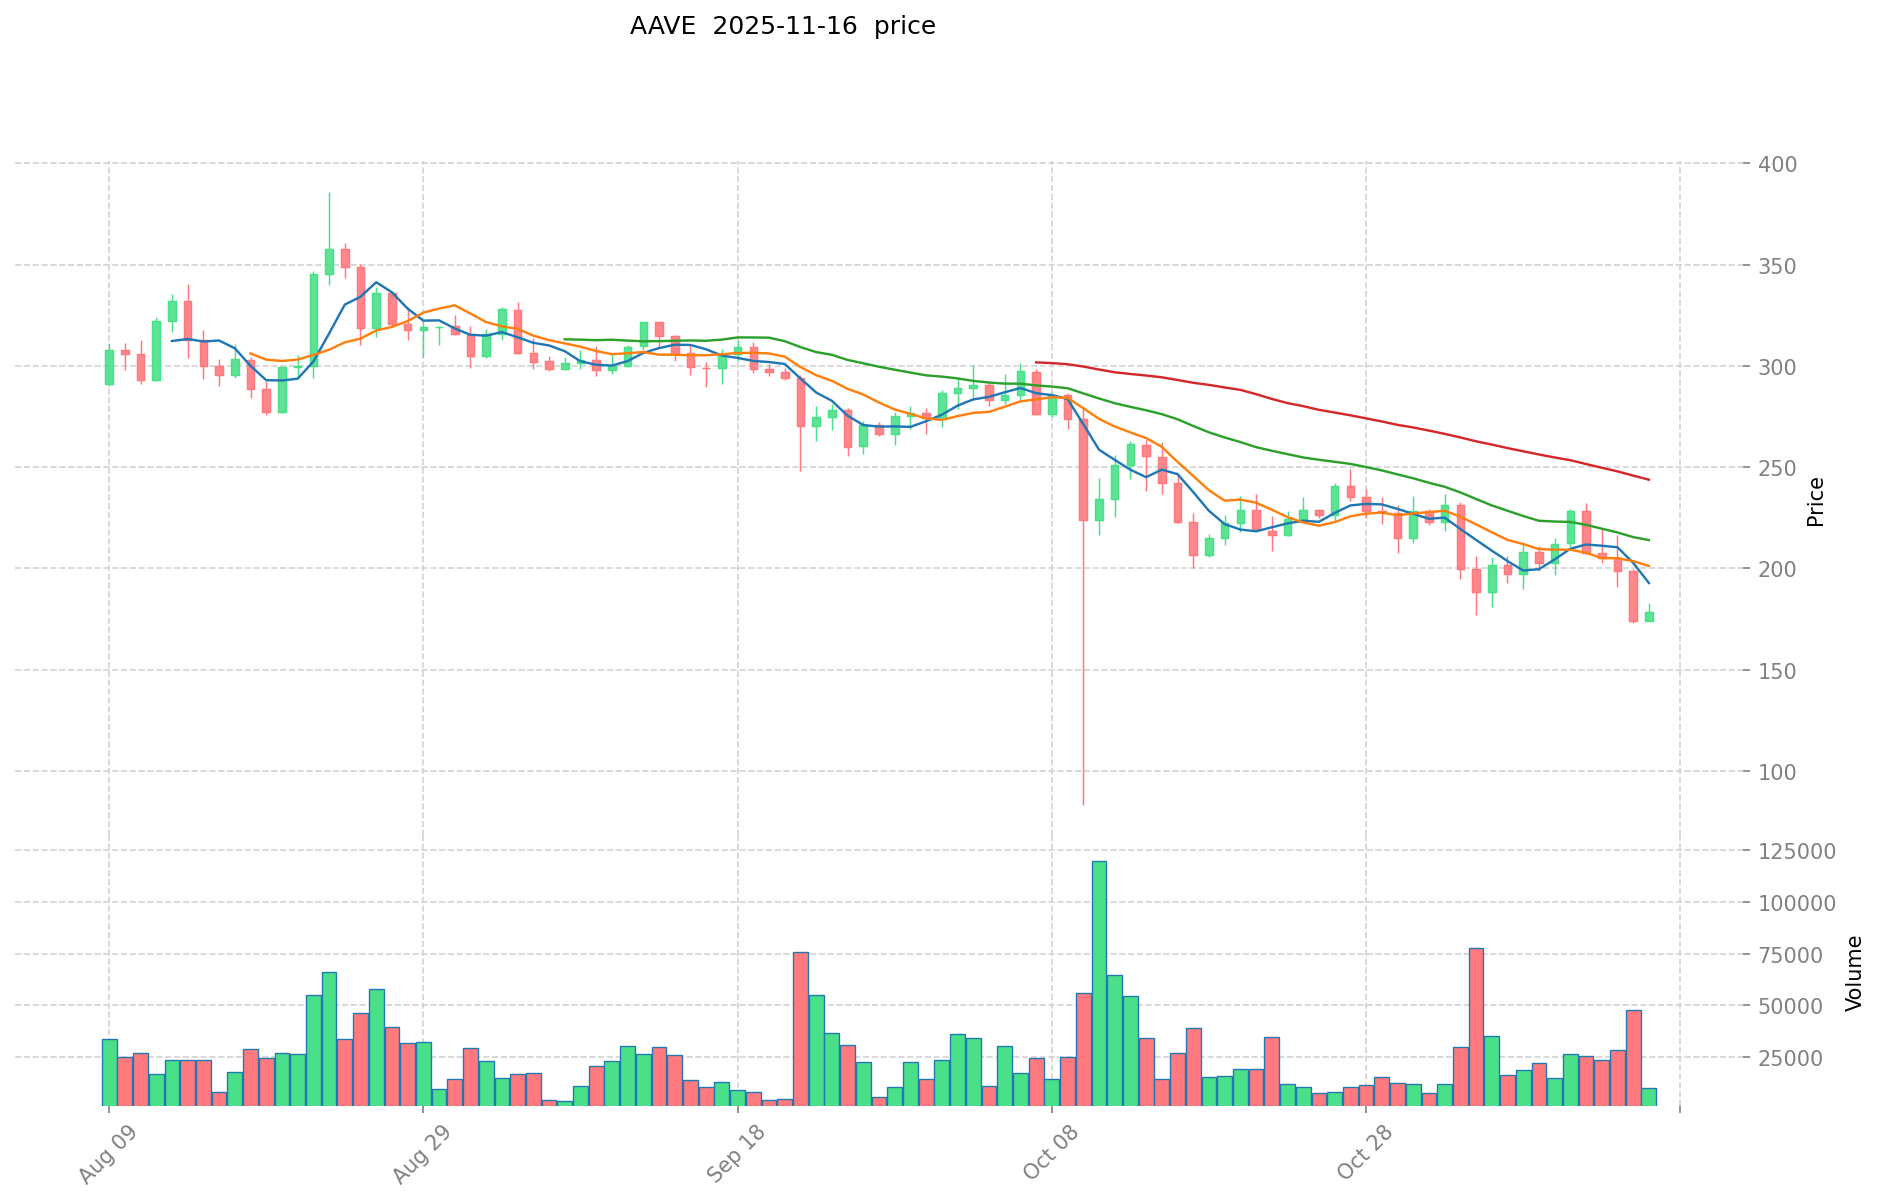
- Comparative analysis: In recent market cycles, AT has shown significant volatility, ranging from $0.5196 to $0.2878, while AAVE has demonstrated longer-term stability, maintaining a price above its all-time low of $26.02 set in November 2020.
Current Market Situation (2025-11-17)
- AT current price: $0.3157
- AAVE current price: $170.8
- 24-hour trading volume: AT $1,923,087.95 vs AAVE $2,452,853.34
- Market Sentiment Index (Fear & Greed Index): 10 (Extreme Fear)
Click to view real-time prices:
- Check AT current price Market Price
- Check AAVE current price Market Price
II. Core Factors Influencing AT vs AAVE Investment Value
Supply Mechanism Comparison (Tokenomics)
-
AT: Fixed supply of 10 billion tokens with no inflation mechanism
-
AAVE: Maximum supply cap of 16 million tokens with deflationary mechanisms through token burns from protocol fees
-
📌 Historical Pattern: Deflationary mechanisms like AAVE's burning model have historically supported price stability during market volatility, while AT's fixed supply model may create scarcity value long-term.
Institutional Adoption and Market Applications
- Institutional Holdings: AAVE has gained greater institutional adoption with major funds and VCs including Polychain Capital and Three Arrows Capital investing in the protocol
- Enterprise Adoption: AAVE leads in enterprise integration within decentralized finance infrastructure, particularly in lending and borrowing markets
- Regulatory Attitudes: Both tokens face varying regulatory scrutiny, with AAVE generally benefiting from greater regulatory clarity in major markets as an established DeFi protocol
Technical Development and Ecosystem Building
- AT Technical Upgrades: Integration with multiple chains including Ethereum and Solana, with cross-chain interoperability features
- AAVE Technical Development: V3 protocol upgrades with high-efficiency mode, isolated lending markets, and portal features enabling seamless cross-chain functionality
- Ecosystem Comparison: AAVE has a more mature DeFi ecosystem with established lending markets, liquidity pools, and cross-chain functionality, while AT focuses on specialized DeFi applications and multichain presence
Macroeconomic Factors and Market Cycles
- Performance in Inflationary Environments: AAVE has demonstrated stronger resilience during inflation periods due to its utility value and deflationary mechanisms
- Macroeconomic Monetary Policy: Both tokens show correlation with broader crypto market reactions to interest rate changes, with AAVE demonstrating slightly more stability during monetary tightening
- Geopolitical Factors: AAVE's decentralized lending infrastructure provides utility during banking uncertainty, potentially offering stronger value proposition during financial instability
III. 2025-2030 Price Prediction: AT vs AAVE
Short-term Prediction (2025)
- AT: Conservative $0.184 - $0.312 | Optimistic $0.312 - $0.428
- AAVE: Conservative $88.27 - $169.75 | Optimistic $169.75 - $225.77
Mid-term Prediction (2027)
- AT may enter a growth phase, with estimated prices ranging from $0.403 to $0.602
- AAVE may enter a consolidation phase, with estimated prices ranging from $106.38 to $222.80
- Key drivers: Institutional capital inflow, ETF, ecosystem development
Long-term Prediction (2030)
- AT: Base scenario $0.553 - $0.666 | Optimistic scenario $0.666 - $0.986
- AAVE: Base scenario $262.83 - $292.03 | Optimistic scenario $292.03 - $303.71
View detailed price predictions for AT and AAVE
Disclaimer
AT:
| 年份 |
预测最高价 |
预测平均价格 |
预测最低价 |
涨跌幅 |
| 2025 |
0.427988 |
0.3124 |
0.184316 |
-1 |
| 2026 |
0.51456966 |
0.370194 |
0.27024162 |
17 |
| 2027 |
0.6016392888 |
0.44238183 |
0.4025674653 |
40 |
| 2028 |
0.642072988062 |
0.5220105594 |
0.448929081084 |
65 |
| 2029 |
0.75083388811299 |
0.582041773731 |
0.56458052051907 |
84 |
| 2030 |
0.986327989764552 |
0.666437830921995 |
0.553143399665255 |
111 |
AAVE:
| 年份 |
预测最高价 |
预测平均价格 |
预测最低价 |
涨跌幅 |
| 2025 |
225.7675 |
169.75 |
88.27 |
0 |
| 2026 |
203.6915125 |
197.75875 |
108.7673125 |
15 |
| 2027 |
222.8048956875 |
200.72513125 |
106.3843195625 |
17 |
| 2028 |
302.8239692603125 |
211.76501346875 |
203.29441293 |
23 |
| 2029 |
326.764004032954687 |
257.29449136453125 |
198.116758350689062 |
50 |
| 2030 |
303.710417606692687 |
292.029247698742968 |
262.826322928868671 |
70 |
IV. Investment Strategy Comparison: AT vs AAVE
Long-term vs Short-term Investment Strategies
- AT: Suitable for investors focused on AI-enhanced oracles and multichain ecosystems
- AAVE: Suitable for investors seeking established DeFi protocols with strong institutional adoption
Risk Management and Asset Allocation
- Conservative investors: AT: 20% vs AAVE: 80%
- Aggressive investors: AT: 40% vs AAVE: 60%
- Hedging tools: Stablecoin allocation, options, cross-currency portfolios
V. Potential Risk Comparison
Market Risk
- AT: Higher volatility due to newer market position
- AAVE: Exposure to overall DeFi market fluctuations
Technical Risk
- AT: Scalability, network stability across multiple chains
- AAVE: Smart contract vulnerabilities, liquidity risks in lending markets
Regulatory Risk
- Global regulatory policies may impact both tokens differently, with AAVE potentially facing more scrutiny due to its established position in DeFi lending
VI. Conclusion: Which Is the Better Buy?
📌 Investment Value Summary:
- AT advantages: AI-enhanced oracle capabilities, fixed supply tokenomics
- AAVE advantages: Established DeFi protocol, institutional adoption, deflationary mechanism
✅ Investment Advice:
- New investors: Consider a balanced approach with higher allocation to AAVE for its established market position
- Experienced investors: Explore strategic allocation to both, leveraging AT's growth potential and AAVE's stability
- Institutional investors: Focus on AAVE for its regulatory clarity and established ecosystem, with potential small allocation to AT for diversification
⚠️ Risk Warning: The cryptocurrency market is highly volatile. This article does not constitute investment advice.
None
VII. FAQ
Q1: What are the main differences between AT and AAVE?
A: AT is an AI-enhanced oracle powering next-gen ecosystems, while AAVE is an established decentralized lending protocol. AT has a fixed supply of 10 billion tokens, while AAVE has a maximum supply of 16 million with deflationary mechanisms. AAVE has greater institutional adoption and a more mature DeFi ecosystem.
Q2: Which token has shown better price performance recently?
A: In recent market cycles, AT has shown significant volatility, ranging from $0.5196 to $0.2878, while AAVE has demonstrated longer-term stability, maintaining a price above its all-time low of $26.02 set in November 2020.
Q3: How do the supply mechanisms of AT and AAVE differ?
A: AT has a fixed supply of 10 billion tokens with no inflation mechanism. AAVE has a maximum supply cap of 16 million tokens with deflationary mechanisms through token burns from protocol fees.
Q4: What are the key factors influencing the investment value of AT and AAVE?
A: Key factors include supply mechanisms, institutional adoption, technical development, ecosystem building, macroeconomic factors, and market cycles. AAVE generally leads in institutional adoption and ecosystem maturity, while AT focuses on specialized DeFi applications and multichain presence.
Q5: What are the projected price ranges for AT and AAVE in 2030?
A: For AT, the base scenario projects $0.553 - $0.666, with an optimistic scenario of $0.666 - $0.986. For AAVE, the base scenario projects $262.83 - $292.03, with an optimistic scenario of $292.03 - $303.71.
Q6: How should investors allocate their portfolio between AT and AAVE?
A: Conservative investors might consider allocating 20% to AT and 80% to AAVE, while aggressive investors might allocate 40% to AT and 60% to AAVE. New investors may want to focus more on AAVE due to its established position, while experienced investors might explore a strategic allocation to both.
Q7: What are the main risks associated with investing in AT and AAVE?
A: AT faces higher volatility due to its newer market position and potential technical risks related to scalability and network stability. AAVE is exposed to overall DeFi market fluctuations, potential smart contract vulnerabilities, and may face more regulatory scrutiny due to its established position in DeFi lending.
* The information is not intended to be and does not constitute financial advice or any other recommendation of any sort offered or endorsed by Gate.


