This comprehensive analysis compares B3 and QNT, two distinct tokenized asset platforms in the digital economy. B3, launched in 2025 as a horizontally scaled gaming ecosystem on Base network, exhibits extreme volatility with a 95.69% decline from peak price, while QNT, established in 2018 as an enterprise blockchain interoperability solution, demonstrates greater price stability with an 81.35% decline. The article examines historical price trends, institutional adoption, technical ecosystems, and provides 2026-2031 price forecasts on Gate, helping investors understand that QNT suits conservative portfolios requiring proven enterprise fundamentals, whereas B3 appeals to aggressive investors seeking high-risk gaming sector exposure. Risk analysis reveals B3's nascent infrastructure and liquidity challenges contrast with QNT's protocol dependencies, offering different investment profiles for varying risk tolerances and investment horizons.
Introduction: B3 vs QNT Investment Comparison
In the crypto market, the comparison between B3 and QNT continues to be a topic investors cannot overlook. These two assets exhibit notable differences in market cap ranking, application scenarios, and price performance, representing distinct positioning within the crypto asset landscape.
B3 (B3): Launched in 2025, it has gained market attention as the first horizontally scaled gaming ecosystem built on Base, created by former Base team members.
QNT (QNT): Since its launch in 2018, it has been recognized for solving blockchain interoperability through the creation of Overledger, a global blockchain operating system, positioning itself as an enterprise-focused technology provider.
This article will comprehensively analyze the investment value comparison between B3 and QNT across historical price trends, supply mechanisms, institutional adoption, technical ecosystems, and future forecasts, attempting to address investors' most pressing question:
"Which is the better buy right now?"
I. Historical Price Comparison and Current Market Status
B3 (Coin A) and QNT (Coin B) Historical Price Trends
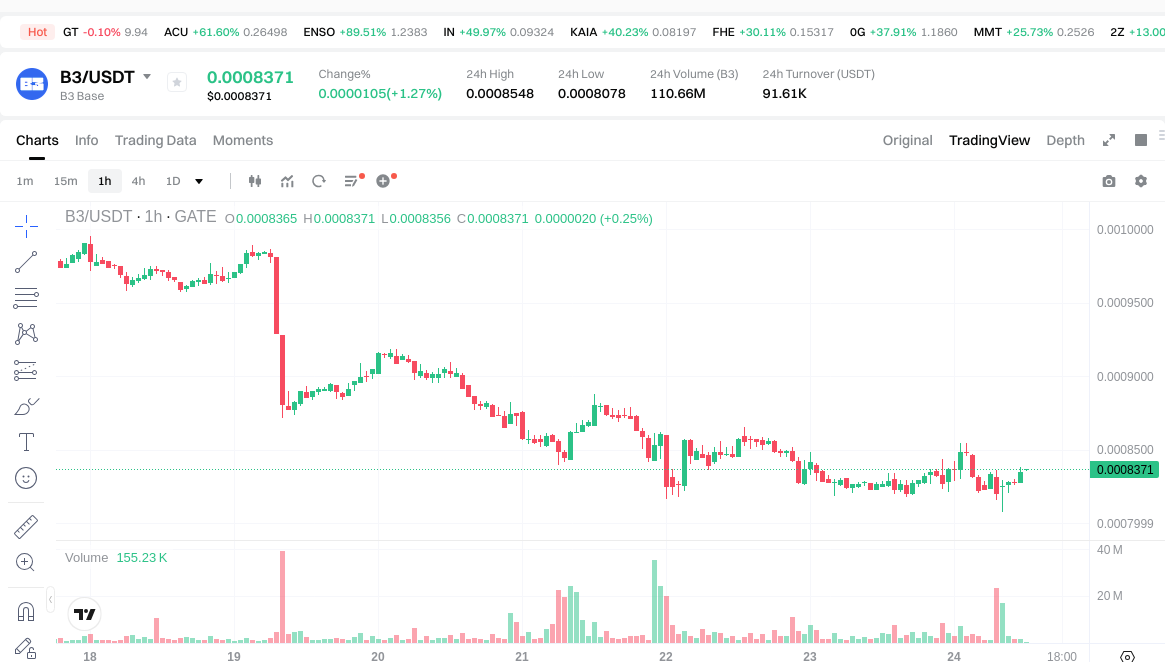
- 2025: B3 experienced significant volatility, with its all-time high reaching 0.019392 on February 12, 2025, followed by a sharp decline to its all-time low of 0.0005 on February 10, 2025.
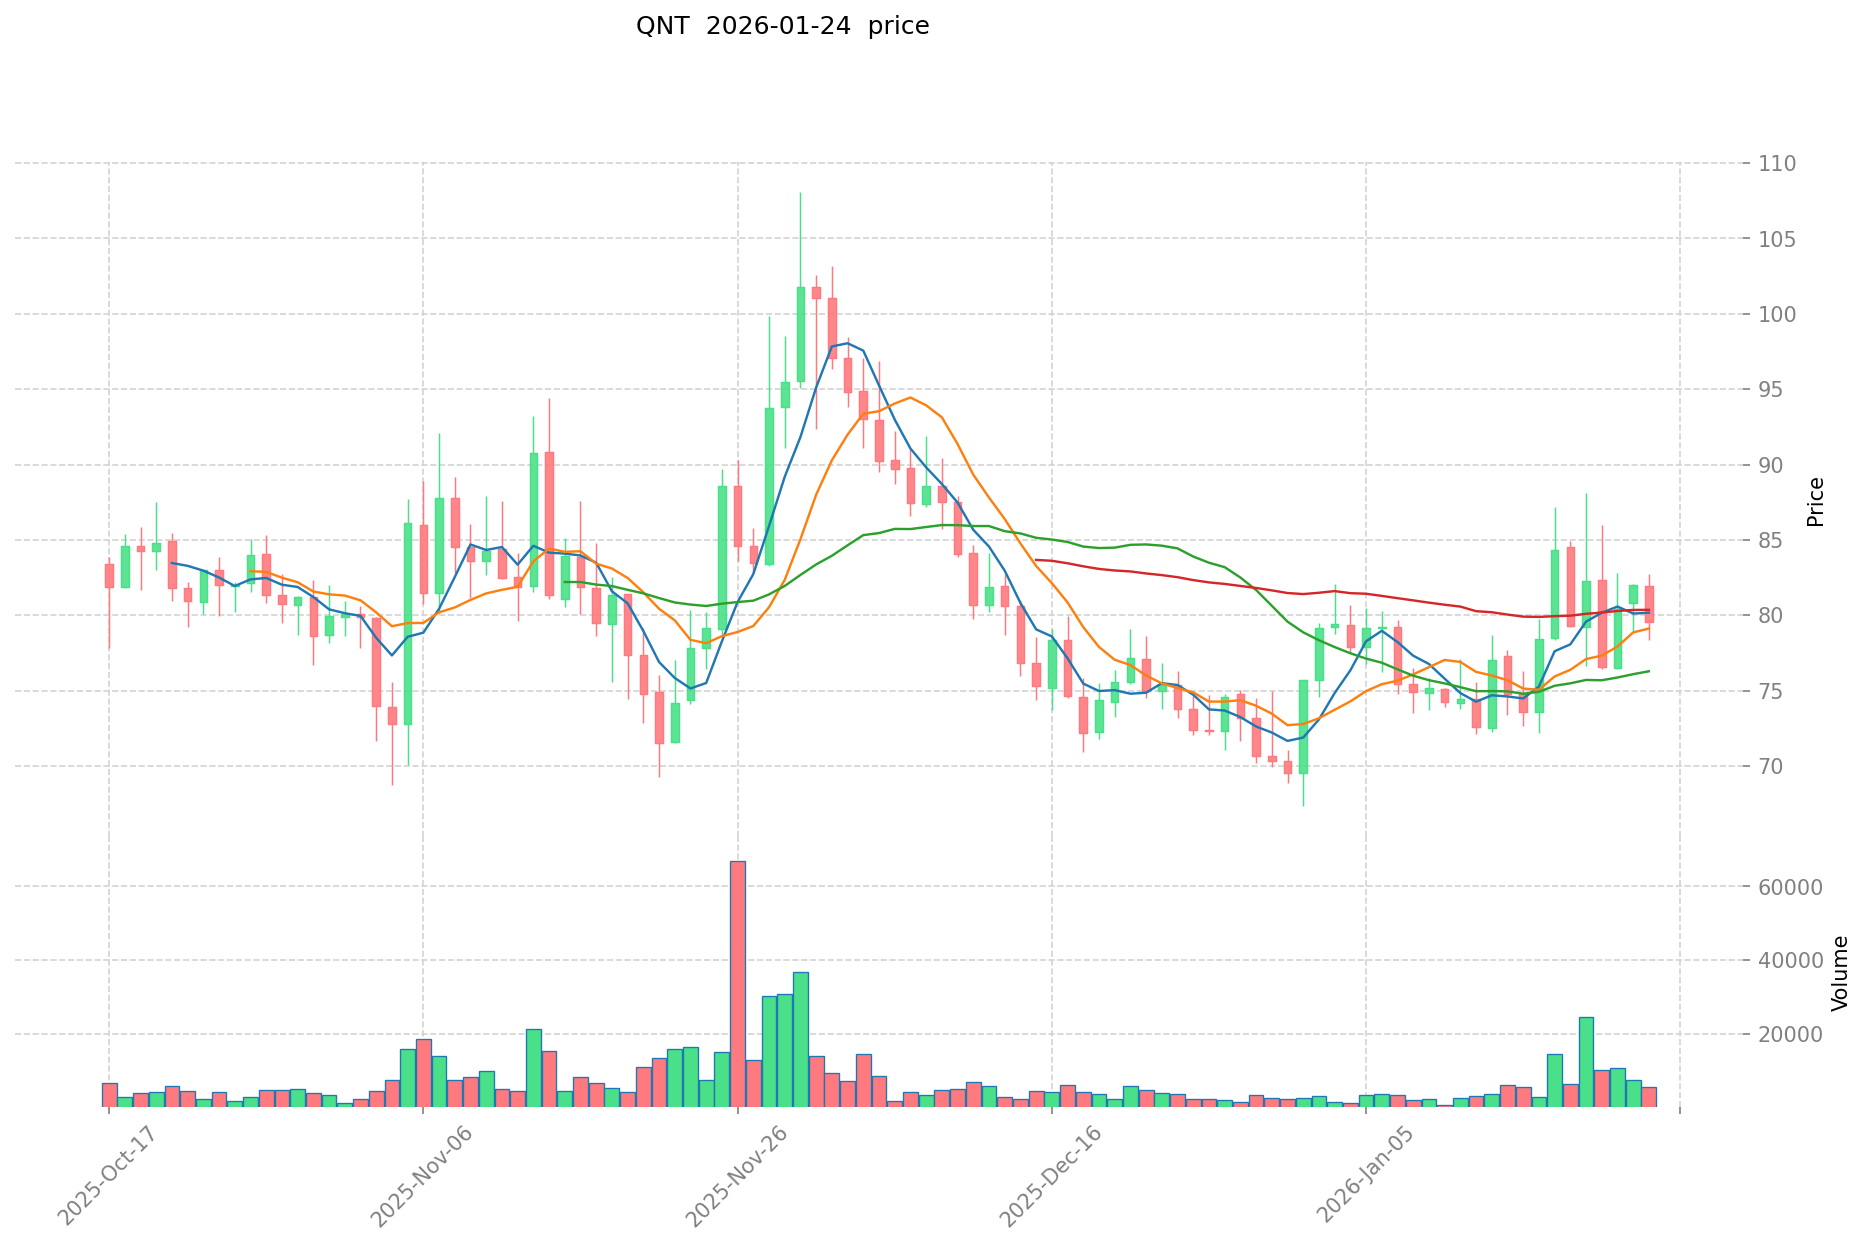
- 2021: QNT was influenced by market momentum during the crypto bull run, reaching its all-time high of 427.42 on September 11, 2021.
- 2018: QNT recorded its all-time low of 0.215773 on August 23, 2018, during the early stages of the project.
- Comparative Analysis: During recent market cycles, B3 has shown extreme price fluctuations, declining approximately 95.69% from its all-time high to its current price. In contrast, QNT has experienced a more moderate decline of approximately 81.35% from its historical peak, demonstrating relatively greater price stability over a longer time horizon.
Current Market Situation (January 24, 2026)
- B3 Current Price: 0.000835
- QNT Current Price: 79.75
- 24-Hour Trading Volume: B3 at 91,613.66 vs QNT at 415,113.18
- Market Sentiment Index (Fear & Greed Index): 25 (Extreme Fear)
View real-time prices:
- View B3 current price Market Price
- View QNT current price Market Price
II. Core Factors Affecting B3 vs QNT Investment Value
Supply Mechanism Comparison (Tokenomics)
Due to limited available data on the specific supply mechanisms of B3 and QNT, a comprehensive comparison cannot be provided at this time. Investors should independently research the tokenomics models of both assets, including total supply caps, emission schedules, and any deflationary or inflationary characteristics that may influence long-term value dynamics.
Institutional Adoption and Market Applications
Without sufficient reference material detailing institutional holdings, enterprise-level adoption cases, or regulatory positions across different jurisdictions for B3 and QNT, specific comparative analysis in this area is not feasible. Market participants are encouraged to monitor official announcements, partnership developments, and regulatory updates independently.
Technical Development and Ecosystem Building
Given the absence of detailed information regarding recent technical upgrades, development roadmaps, or ecosystem expansion initiatives for either B3 or QNT in the provided materials, a comparative assessment of their technological trajectories and ecosystem maturity cannot be conducted. Stakeholders should refer to official project documentation and development activity metrics for informed evaluation.
Macroeconomic Conditions and Market Cycles
The relationship between macroeconomic factors and the performance characteristics of B3 and QNT remains unclear based on the available data. Factors such as inflation dynamics, monetary policy shifts, interest rate movements, and geopolitical developments may influence digital asset valuations differently. Comprehensive analysis would require historical performance data under varying economic conditions, which is not accessible from the current reference materials.
III. 2026-2031 Price Forecast: B3 vs QNT
Short-term Forecast (2026)
- B3: Conservative $0.000552486 - $0.0008371 | Optimistic $0.0008371 - $0.001155198
- QNT: Conservative $55.874 - $79.82 | Optimistic $79.82 - $95.784
Mid-term Forecast (2028-2029)
- B3 may enter a consolidation phase, with estimated prices ranging from $0.00084797 to $0.0016054, showing gradual upward momentum through 2029 with potential to reach $0.001545
- QNT may enter an expansion phase, with estimated prices ranging from $83.078 to $139.921 in 2028, potentially extending to $179.449 by 2029
- Key drivers: institutional capital inflows, ETF developments, ecosystem growth
Long-term Forecast (2030-2031)
- B3: Baseline scenario $0.001165588 - $0.001456985 | Optimistic scenario $0.001456985 - $0.001573544 (2030), extending to $0.001515264 - $0.001848622 (2031)
- QNT: Baseline scenario $83.618 - $152.033 | Optimistic scenario $152.033 - $218.927 (2030), potentially reaching $185.480 - $209.592 (2031)
View detailed price predictions for B3 and QNT
Disclaimer
B3:
| Year |
Predicted High Price |
Predicted Average Price |
Predicted Low Price |
Price Change |
| 2026 |
0.001155198 |
0.0008371 |
0.000552486 |
0 |
| 2027 |
0.00126510923 |
0.000996149 |
0.00077699622 |
19 |
| 2028 |
0.0016054933433 |
0.001130629115 |
0.00084797183625 |
35 |
| 2029 |
0.001545909188939 |
0.00136806122915 |
0.001039726534154 |
63 |
| 2030 |
0.001573544025768 |
0.001456985209044 |
0.001165588167235 |
74 |
| 2031 |
0.001848622833236 |
0.001515264617406 |
0.00137889080184 |
81 |
QNT:
| Year |
Predicted High Price |
Predicted Average Price |
Predicted Low Price |
Price Change |
| 2026 |
95.784 |
79.82 |
55.874 |
0 |
| 2027 |
130.82498 |
87.802 |
58.82734 |
10 |
| 2028 |
139.9212672 |
109.31349 |
83.0782524 |
37 |
| 2029 |
179.449025184 |
124.6173786 |
83.493643662 |
56 |
| 2030 |
218.92781072448 |
152.033201892 |
83.6182610406 |
90 |
| 2031 |
209.5929721283112 |
185.48050630824 |
126.1267442896032 |
132 |
IV. Investment Strategy Comparison: B3 vs QNT
Long-term vs Short-term Investment Strategies
- B3: May appeal to investors focused on emerging gaming ecosystems and high-risk, high-volatility opportunities within the Base network infrastructure
- QNT: May appeal to investors seeking exposure to enterprise blockchain interoperability solutions with a longer operational track record
Risk Management and Asset Allocation
- Conservative Investors: B3: 10-15% vs QNT: 85-90%
- Aggressive Investors: B3: 30-40% vs QNT: 60-70%
- Hedging Tools: stablecoin allocation, options strategies, cross-asset diversification
V. Potential Risk Comparison
Market Risk
- B3: Exhibits significant price volatility, with historical evidence of approximately 95.69% decline from all-time high, indicating elevated susceptibility to market sentiment shifts and liquidity challenges
- QNT: Demonstrates relatively moderate volatility patterns, with approximately 81.35% decline from historical peak, suggesting comparatively greater price stability over extended timeframes
Technical Risk
- B3: Scalability considerations and network stability factors associated with newly launched gaming ecosystem infrastructure
- QNT: Interoperability protocol dependencies and potential security vulnerabilities inherent in multi-chain operating systems
Regulatory Risk
- Global regulatory frameworks may impact B3 and QNT differently based on their respective use cases, with gaming-focused projects potentially facing distinct compliance requirements compared to enterprise-oriented blockchain infrastructure solutions
VI. Conclusion: Which Is the Better Buy?
📌 Investment Value Summary:
- B3 Advantages: Early-stage exposure to gaming ecosystem development on Base network, potential for substantial price appreciation if adoption accelerates
- QNT Advantages: Established market presence since 2018, enterprise-focused blockchain interoperability positioning, relatively lower historical volatility
✅ Investment Recommendations:
- Novice Investors: Consider prioritizing assets with longer operational histories and lower volatility profiles, with minimal allocation to highly speculative positions
- Experienced Investors: Evaluate portfolio risk tolerance and consider diversified exposure across different market segments, balancing emerging opportunities with established projects
- Institutional Investors: Conduct comprehensive due diligence on regulatory compliance, liquidity characteristics, and alignment with institutional investment mandates
⚠️ Risk Disclaimer: Cryptocurrency markets exhibit extreme volatility. This content does not constitute investment advice.
VII. FAQ
Q1: What is the main difference between B3 and QNT in terms of market positioning?
B3 is a newly launched gaming ecosystem project on the Base network (2025), while QNT is an established enterprise blockchain interoperability solution provider (since 2018). B3 focuses on horizontal scaling for gaming applications within a specific blockchain ecosystem, whereas QNT positions itself as a global blockchain operating system (Overledger) designed to solve cross-chain communication challenges for enterprise clients. This fundamental difference reflects their distinct target markets: B3 targets the gaming and entertainment sector with higher growth potential but greater uncertainty, while QNT serves enterprise-level clients requiring stable, proven interoperability solutions.
Q2: How do the historical price volatilities of B3 and QNT compare?
B3 demonstrates significantly higher volatility, declining approximately 95.69% from its all-time high of $0.019392 (February 12, 2025) to its current price of $0.000835. In contrast, QNT has experienced a more moderate decline of approximately 81.35% from its historical peak of $427.42 (September 11, 2021) to its current price of $79.75. This substantial difference indicates that B3 carries considerably higher price risk, with extreme fluctuations occurring within a condensed timeframe, while QNT has demonstrated relatively greater price stability over its longer operational history spanning multiple market cycles.
Q3: What are the projected price ranges for B3 and QNT by 2030?
For 2030, B3's baseline scenario forecasts a price range of $0.001165588 to $0.001456985, with an optimistic scenario extending to $0.001573544, representing approximately 74-88% growth from current levels. QNT's baseline scenario projects a range of $83.618 to $152.033, with an optimistic scenario reaching $218.927, representing approximately 90-174% potential growth from current prices. These forecasts suggest that while both assets may experience appreciation, QNT's absolute dollar value increases would be substantially larger, though B3 shows higher percentage growth potential from its significantly lower price base.
Q4: How should conservative versus aggressive investors allocate between B3 and QNT?
Conservative investors should consider allocating 10-15% to B3 and 85-90% to QNT, prioritizing the more established asset with lower historical volatility and proven enterprise adoption. Aggressive investors might increase B3 exposure to 30-40% while maintaining 60-70% in QNT, accepting higher risk in exchange for greater growth potential from the emerging gaming ecosystem. This differentiated approach reflects B3's status as a high-risk, high-reward speculative position suitable primarily for portfolios with appropriate risk tolerance, while QNT serves as a relatively more stable core holding with enterprise-level fundamentals.
Q5: What are the primary risk factors distinguishing B3 from QNT?
B3's primary risks include extreme price volatility (95.69% decline from peak), limited operational history since its 2025 launch, scalability uncertainties in gaming ecosystem infrastructure, and potential regulatory challenges specific to gaming-focused blockchain projects. QNT's risks center on interoperability protocol dependencies, potential security vulnerabilities in multi-chain systems, and enterprise adoption pace affecting long-term value. Additionally, B3 faces significantly greater liquidity risk due to its lower 24-hour trading volume ($91,613.66) compared to QNT ($415,113.18), which may result in higher slippage and execution challenges during volatile market conditions.
Q6: Under what market conditions might B3 outperform QNT?
B3 may outperform QNT during periods of heightened risk appetite, gaming sector momentum, and Base network ecosystem expansion, particularly if adoption within its horizontal gaming infrastructure accelerates rapidly. Given B3's current extreme fear market sentiment (Fear & Greed Index: 25) and depressed price levels relative to its all-time high, any positive catalysts related to gaming partnerships, technological milestones, or broader cryptocurrency market recovery could trigger substantial percentage gains from its low base. However, this outperformance potential comes with corresponding downside risk, as B3's limited operational track record and high volatility profile make it vulnerable to adverse market sentiment shifts.
Q7: What due diligence steps are essential before investing in B3 or QNT?
Essential due diligence includes: (1) researching specific tokenomics models, total supply caps, and emission schedules for both assets; (2) monitoring official announcements regarding institutional partnerships and enterprise adoption cases; (3) reviewing development roadmaps, GitHub activity metrics, and technical upgrade schedules; (4) analyzing regulatory positions across different jurisdictions, particularly regarding gaming projects versus enterprise blockchain solutions; (5) assessing liquidity characteristics, including order book depth and historical trading patterns; (6) evaluating macroeconomic conditions and their potential differential impacts on gaming ecosystems versus enterprise infrastructure solutions. Given the limited publicly available information on certain aspects of both projects, investors should prioritize official project documentation and independently verify claims through multiple credible sources.
* The information is not intended to be and does not constitute financial advice or any other recommendation of any sort offered or endorsed by Gate.