This comprehensive guide compares BAL and ARB, two leading decentralized finance governance tokens with distinct market positioning. BAL, launched in 2020, provides automated market-making solutions for DeFi protocols, while ARB, introduced in 2023, serves as an Ethereum Layer 2 scaling solution. The article analyzes historical price performance, current market status, tokenomics, institutional adoption, and ecosystem development. ARB demonstrates superior trading liquidity with $2.02M daily volume versus BAL's $29K, though BAL trades at $0.4977 compared to ARB's $0.1853. Through detailed price forecasts extending to 2031, investment strategy recommendations for different investor profiles, and risk assessments, this guide addresses which asset offers better investment value. ARB emerges as the preferred entry point for novice investors seeking clearer use cases and enhanced market liquidity, while experienced investors may benefit from diversified exposure. The analysis emphasizes that both assets present op
Introduction: BAL vs ARB Investment Comparison
In the cryptocurrency market, the comparison between BAL and ARB has consistently been a topic of significant interest among investors. Both assets exhibit distinct differences in market cap ranking, application scenarios, and price performance, while representing different positioning within the crypto asset landscape.
Balancer (BAL): Since its launch in 2020, it has gained market recognition through its automated market-making protocol with self-balancing properties that generate weighted portfolios and price sensors.
Arbitrum (ARB): Launched in 2023, it has been recognized as a Layer 2 scaling solution for Ethereum, offering faster and cheaper transactions while maintaining Ethereum-level security.
This article will provide a comprehensive analysis of the BAL vs ARB investment value comparison, examining historical price trends, supply mechanisms, institutional adoption, technical ecosystems, and future projections, while attempting to address the question investors care about most:
"Which is the better buy right now?"
I. Historical Price Comparison and Current Market Status
BAL and ARB Historical Price Trends
- 2021: BAL reached its all-time high of 74.45 USD on May 4, 2021, driven by the broader DeFi market expansion during that period.
- 2024: ARB recorded its all-time high of 2.39 USD on January 12, 2024, following increased adoption of Layer 2 scaling solutions.
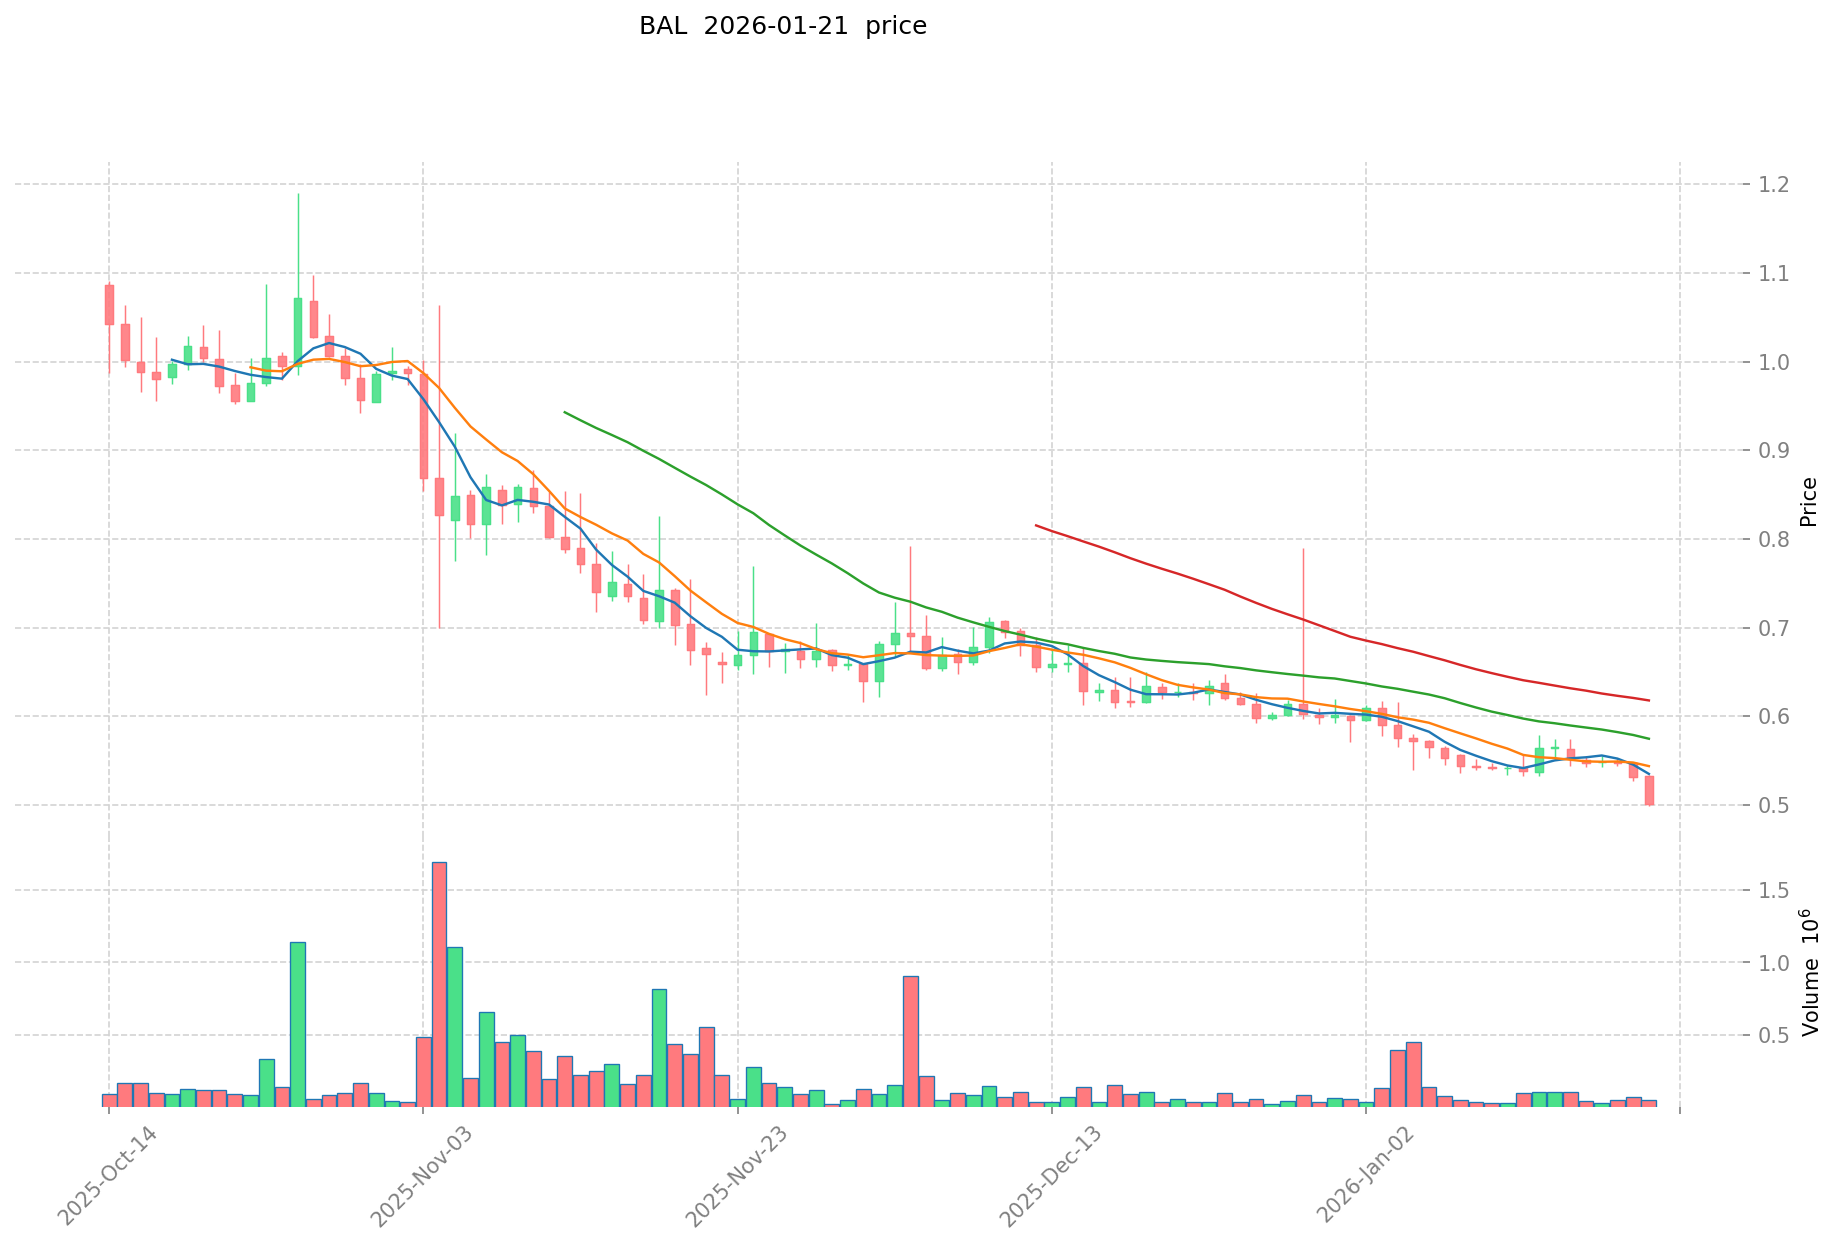
- 2026: BAL experienced significant volatility, reaching its all-time low of 0.49734 USD on January 21, 2026, representing a decline of approximately 99.33% from its peak.
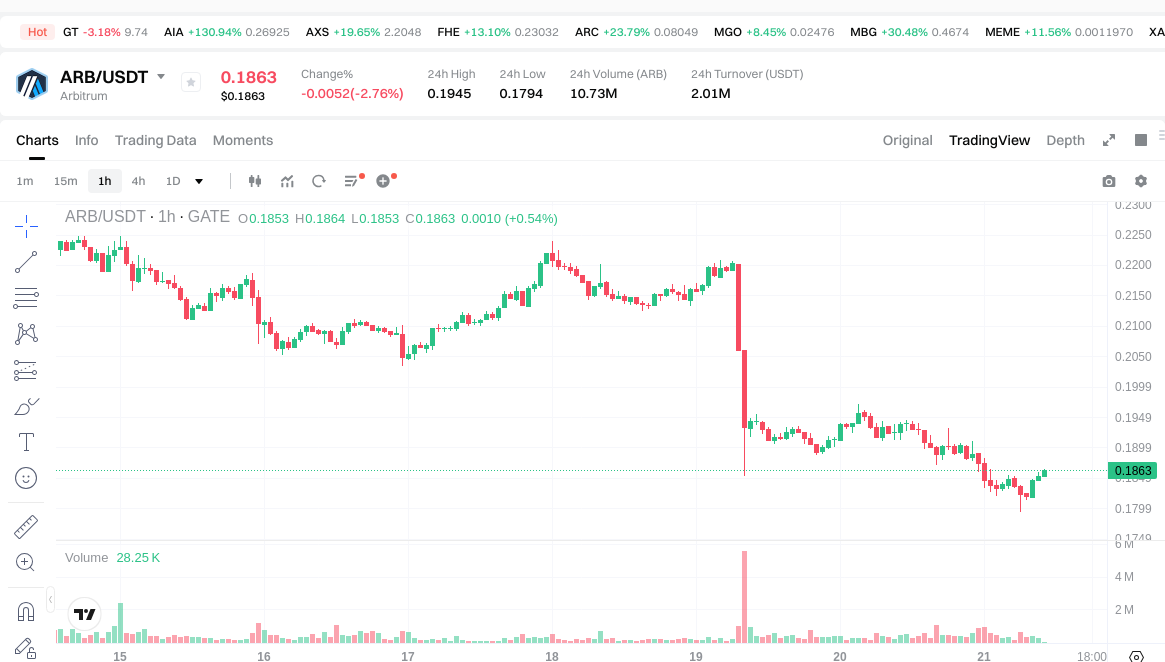
- 2025: ARB hit its all-time low of 0.172637 USD on December 19, 2025, marking a decrease of approximately 92.78% from its highest point.
- Comparative Analysis: Throughout the current market cycle, BAL declined from 74.45 USD to 0.49734 USD, while ARB decreased from 2.39 USD to 0.172637 USD, with both assets experiencing substantial corrections from their respective peaks.
Current Market Status (2026-01-21)
- BAL Current Price: 0.4977 USD
- ARB Current Price: 0.1853 USD
- 24-Hour Trading Volume: BAL recorded 29,312.69 USD compared to ARB's 2,020,350.15 USD
- Market Sentiment Index (Fear & Greed Index): 24 (Extreme Fear)
View real-time prices:
II. Core Factors Influencing BAL vs ARB Investment Value
Supply Mechanism Comparison (Tokenomics)
Due to insufficient reference materials regarding the specific supply mechanisms of BAL and ARB, a detailed comparative analysis cannot be provided at this time.
Institutional Adoption and Market Application
Institutional Holdings
Based on available information, specific data on institutional preference between BAL and ARB is not currently accessible.
Enterprise Adoption
Detailed information regarding the application of BAL and ARB in cross-border payments, settlements, and investment portfolios is not available in the reference materials.
National Policies
Comparative regulatory attitudes toward BAL and ARB across different jurisdictions cannot be established from the provided sources.
Technology Development and Ecosystem Building
BAL Technology Upgrades
Specific information regarding recent or planned technology upgrades for BAL and their potential impact is not available in the reference materials.
ARB Technology Development
Detailed information on ARB's technological advancement trajectory and potential implications is not provided in the source materials.
Ecosystem Comparison
A comprehensive comparison of DeFi, NFT, payment solutions, and smart contract implementations between BAL and ARB ecosystems cannot be conducted due to limited data availability.
Macroeconomic Environment and Market Cycles
Historical performance data comparing BAL and ARB under inflationary conditions is not available in the reference materials.
Macroeconomic Monetary Policy
The specific impact of interest rates and the US Dollar Index on BAL and ARB cannot be analyzed based on the provided information.
Geopolitical Factors
The influence of cross-border transaction demand and international developments on the relative positioning of BAL and ARB remains unclear from the available sources.
III. 2026-2031 Price Forecast: BAL vs ARB
Short-term Forecast (2026)
- BAL: Conservative $0.38-$0.50 | Optimistic $0.50-$0.60
- ARB: Conservative $0.17-$0.19 | Optimistic $0.19-$0.27
Mid-term Forecast (2028-2029)
- BAL may enter a growth phase, with estimated price range of $0.33-$0.87
- ARB may enter an expansion phase, with estimated price range of $0.15-$0.46
- Key drivers: institutional capital inflows, ETF developments, ecosystem expansion
Long-term Forecast (2030-2031)
- BAL: Baseline scenario $0.47-$0.92 | Optimistic scenario $0.92-$1.27
- ARB: Baseline scenario $0.21-$0.45 | Optimistic scenario $0.45-$0.62
View detailed price predictions for BAL and ARB
Disclaimer
BAL:
| Year |
Predicted High Price |
Predicted Average Price |
Predicted Low Price |
Price Change |
| 2026 |
0.60258 |
0.498 |
0.38346 |
0 |
| 2027 |
0.660348 |
0.55029 |
0.2861508 |
10 |
| 2028 |
0.80507427 |
0.605319 |
0.33292545 |
21 |
| 2029 |
0.8744438274 |
0.705196635 |
0.35965028385 |
41 |
| 2030 |
1.058359109808 |
0.7898202312 |
0.47389213872 |
58 |
| 2031 |
1.26600284859048 |
0.924089670504 |
0.48976752536712 |
85 |
ARB:
| Year |
Predicted High Price |
Predicted Average Price |
Predicted Low Price |
Price Change |
| 2026 |
0.2697 |
0.186 |
0.17298 |
0 |
| 2027 |
0.296205 |
0.22785 |
0.13671 |
22 |
| 2028 |
0.358977675 |
0.2620275 |
0.154596225 |
41 |
| 2029 |
0.4595438295 |
0.3105025875 |
0.294977458125 |
67 |
| 2030 |
0.52363156356 |
0.3850232085 |
0.211762764675 |
107 |
| 2031 |
0.6178852450008 |
0.45432738603 |
0.3725484565446 |
145 |
IV. Investment Strategy Comparison: BAL vs ARB
Long-term vs Short-term Investment Strategies
- BAL: Suitable for investors focused on DeFi protocol innovation and automated market-making mechanisms, particularly those seeking exposure to decentralized liquidity provision and portfolio management solutions
- ARB: Suitable for investors interested in Ethereum Layer 2 scaling infrastructure and transaction efficiency improvements, particularly those aligned with the growth trajectory of blockchain scalability solutions
Risk Management and Asset Allocation
- Conservative Investors: BAL 30% vs ARB 70%
- Aggressive Investors: BAL 45% vs ARB 55%
- Hedging Tools: stablecoin allocation, options strategies, cross-asset portfolio diversification
V. Potential Risk Comparison
Market Risk
- BAL: Exposure to DeFi market cycles and liquidity provider participation trends, with current trading volume at 29,312.69 USD indicating relatively lower market activity
- ARB: Susceptibility to Layer 2 adoption rates and Ethereum ecosystem developments, with 24-hour trading volume of 2,020,350.15 USD reflecting broader market engagement
Technical Risk
- BAL: Protocol scalability considerations and smart contract security dependencies related to automated market-making functions
- ARB: Network performance reliability and potential vulnerabilities associated with Layer 2 bridging mechanisms
Regulatory Risk
- Global regulatory frameworks may affect BAL and ARB differently, with DeFi protocols and Layer 2 solutions facing distinct compliance considerations across various jurisdictions
VI. Conclusion: Which Is the Better Buy?
📌 Investment Value Summary:
- BAL Advantages: Established presence in the DeFi sector since 2020, innovative automated market-making protocol with self-balancing weighted portfolios, potential recovery opportunity from current price level of 0.4977 USD
- ARB Advantages: Strategic positioning in Ethereum Layer 2 infrastructure, addressing critical scalability challenges, higher trading volume indicating greater market liquidity, price forecast suggests potential growth range of 0.17-0.62 USD through 2031
✅ Investment Recommendations:
- Novice Investors: Consider beginning with ARB due to higher trading liquidity and clearer use case in blockchain scalability, starting with conservative allocation and dollar-cost averaging approach
- Experienced Investors: Evaluate portfolio diversification between both assets, with potential emphasis on ARB for infrastructure exposure and selective BAL allocation for DeFi protocol participation
- Institutional Investors: Conduct comprehensive due diligence on both protocols, assessing ecosystem development trajectories, technological roadmaps, and alignment with broader portfolio strategies before establishing positions
⚠️ Risk Warning: The cryptocurrency market exhibits extreme volatility. This article does not constitute investment advice.
VII. FAQ
Q1: What is the current price difference between BAL and ARB, and which has shown better recent performance?
As of January 21, 2026, BAL is trading at $0.4977 while ARB is priced at $0.1853, with BAL approximately 2.68 times more expensive than ARB. However, both assets have experienced significant declines from their all-time highs—BAL has dropped approximately 99.33% from its May 2021 peak of $74.45, while ARB has declined roughly 92.78% from its January 2024 high of $2.39. Despite the severe corrections, ARB demonstrates considerably higher market liquidity with a 24-hour trading volume of $2,020,350.15 compared to BAL's $29,312.69, suggesting greater investor confidence and market participation in the Layer 2 scaling solution.
Q2: Which asset offers better long-term growth potential through 2031?
Based on conservative forecasts, ARB appears to offer stronger growth potential with a projected price range of $0.21-$0.45 by 2030-2031 (representing approximately 13-143% growth from current levels), while BAL is expected to reach $0.47-$0.92 (roughly -6% to 85% from current prices). In optimistic scenarios, ARB could potentially reach $0.62 by 2031, representing a 234% increase, whereas BAL might achieve $1.27, indicating a 155% gain. The key differentiator lies in ARB's strategic positioning within Ethereum's Layer 2 infrastructure, which addresses critical blockchain scalability challenges—a fundamental need likely to drive sustained demand as the ecosystem expands.
Q3: What are the primary use cases that differentiate BAL from ARB?
BAL and ARB serve fundamentally different functions within the crypto ecosystem. BAL operates as an automated market-making protocol focused on decentralized liquidity provision and portfolio management, utilizing self-balancing weighted portfolios and price sensors to facilitate efficient token swaps within the DeFi sector. In contrast, ARB functions as a Layer 2 scaling solution for Ethereum, specifically designed to enhance transaction throughput and reduce gas fees while maintaining Ethereum-level security. This architectural difference means BAL primarily appeals to liquidity providers and DeFi traders seeking sophisticated portfolio management tools, whereas ARB targets users and developers requiring fast, cost-effective blockchain transactions for various applications including DeFi, NFTs, and smart contracts.
Q4: How should conservative versus aggressive investors allocate between BAL and ARB?
For conservative investors seeking lower risk exposure, a recommended allocation would be 30% BAL and 70% ARB, prioritizing ARB's higher liquidity, stronger trading volume, and clearer use case in blockchain infrastructure. Aggressive investors comfortable with higher volatility might consider a 45% BAL and 55% ARB allocation to capture potential upside from both DeFi protocol innovation and Layer 2 scaling adoption. Regardless of risk profile, implementing dollar-cost averaging strategies, maintaining stablecoin reserves for hedging, and diversifying across multiple assets beyond just BAL and ARB is advisable. The current market sentiment index of 24 (Extreme Fear) suggests potential accumulation opportunities, though investors should remain cautious and avoid over-concentration in either asset.
Q5: What are the main risks investors should consider when choosing between BAL and ARB?
Both assets face distinct risk profiles that investors must evaluate carefully. BAL's primary risks include exposure to DeFi market cycles, relatively low trading volume (indicating potential liquidity challenges), smart contract vulnerabilities associated with automated market-making functions, and dependence on liquidity provider participation trends. ARB's risks center on Layer 2 adoption rates, potential technical vulnerabilities in bridging mechanisms between Layer 1 and Layer 2, competition from alternative Ethereum scaling solutions, and the overall health of the Ethereum ecosystem. Additionally, both assets are subject to evolving regulatory frameworks across different jurisdictions, with DeFi protocols and Layer 2 solutions potentially facing distinct compliance requirements. The current extreme market volatility, evidenced by both assets trading near all-time lows, amplifies these risks and underscores the importance of comprehensive due diligence before investment.
Q6: For novice cryptocurrency investors, which asset is more suitable as an entry point?
For beginners entering the cryptocurrency market, ARB represents a more suitable starting point due to several key factors. First, ARB's significantly higher 24-hour trading volume ($2,020,350.15 versus BAL's $29,312.69) provides better liquidity, enabling easier entry and exit positions with reduced slippage risk. Second, ARB's use case as a Layer 2 scaling solution is more straightforward to understand compared to BAL's complex automated market-making mechanisms and weighted portfolio concepts. Third, ARB's positioning within Ethereum's infrastructure addresses a clear and growing market need for transaction scalability, making its value proposition more tangible for newcomers. However, novice investors should begin with conservative allocation sizes, employ dollar-cost averaging to mitigate timing risk, and prioritize education about blockchain technology, wallet security, and risk management before committing significant capital to either asset.
* The information is not intended to be and does not constitute financial advice or any other recommendation of any sort offered or endorsed by Gate.