Master cryptocurrency trading by understanding SMA strategies and the Death Cross pattern, a critical technical indicator where the 50-day moving average crosses below the 200-day SMA. This comprehensive guide explores what Death Cross signals, Bitcoin's current technical formations, and historical significance across market cycles. Learn how moving averages function as dynamic support and resistance levels, and discover why this bearish crossover pattern matters for traders on Gate and other platforms. The article analyzes market implications, combines Death Cross with complementary indicators like RSI and MACD, and addresses whether this pattern reliably predicts price movements. Perfect for both beginner and experienced traders, this guide provides actionable insights on risk management, position sizing, and confirming trends through volume analysis. Enhance your technical analysis skills and make informed cryptocurrency trading decisions using proven SMA strategies.
What is the Death Cross?
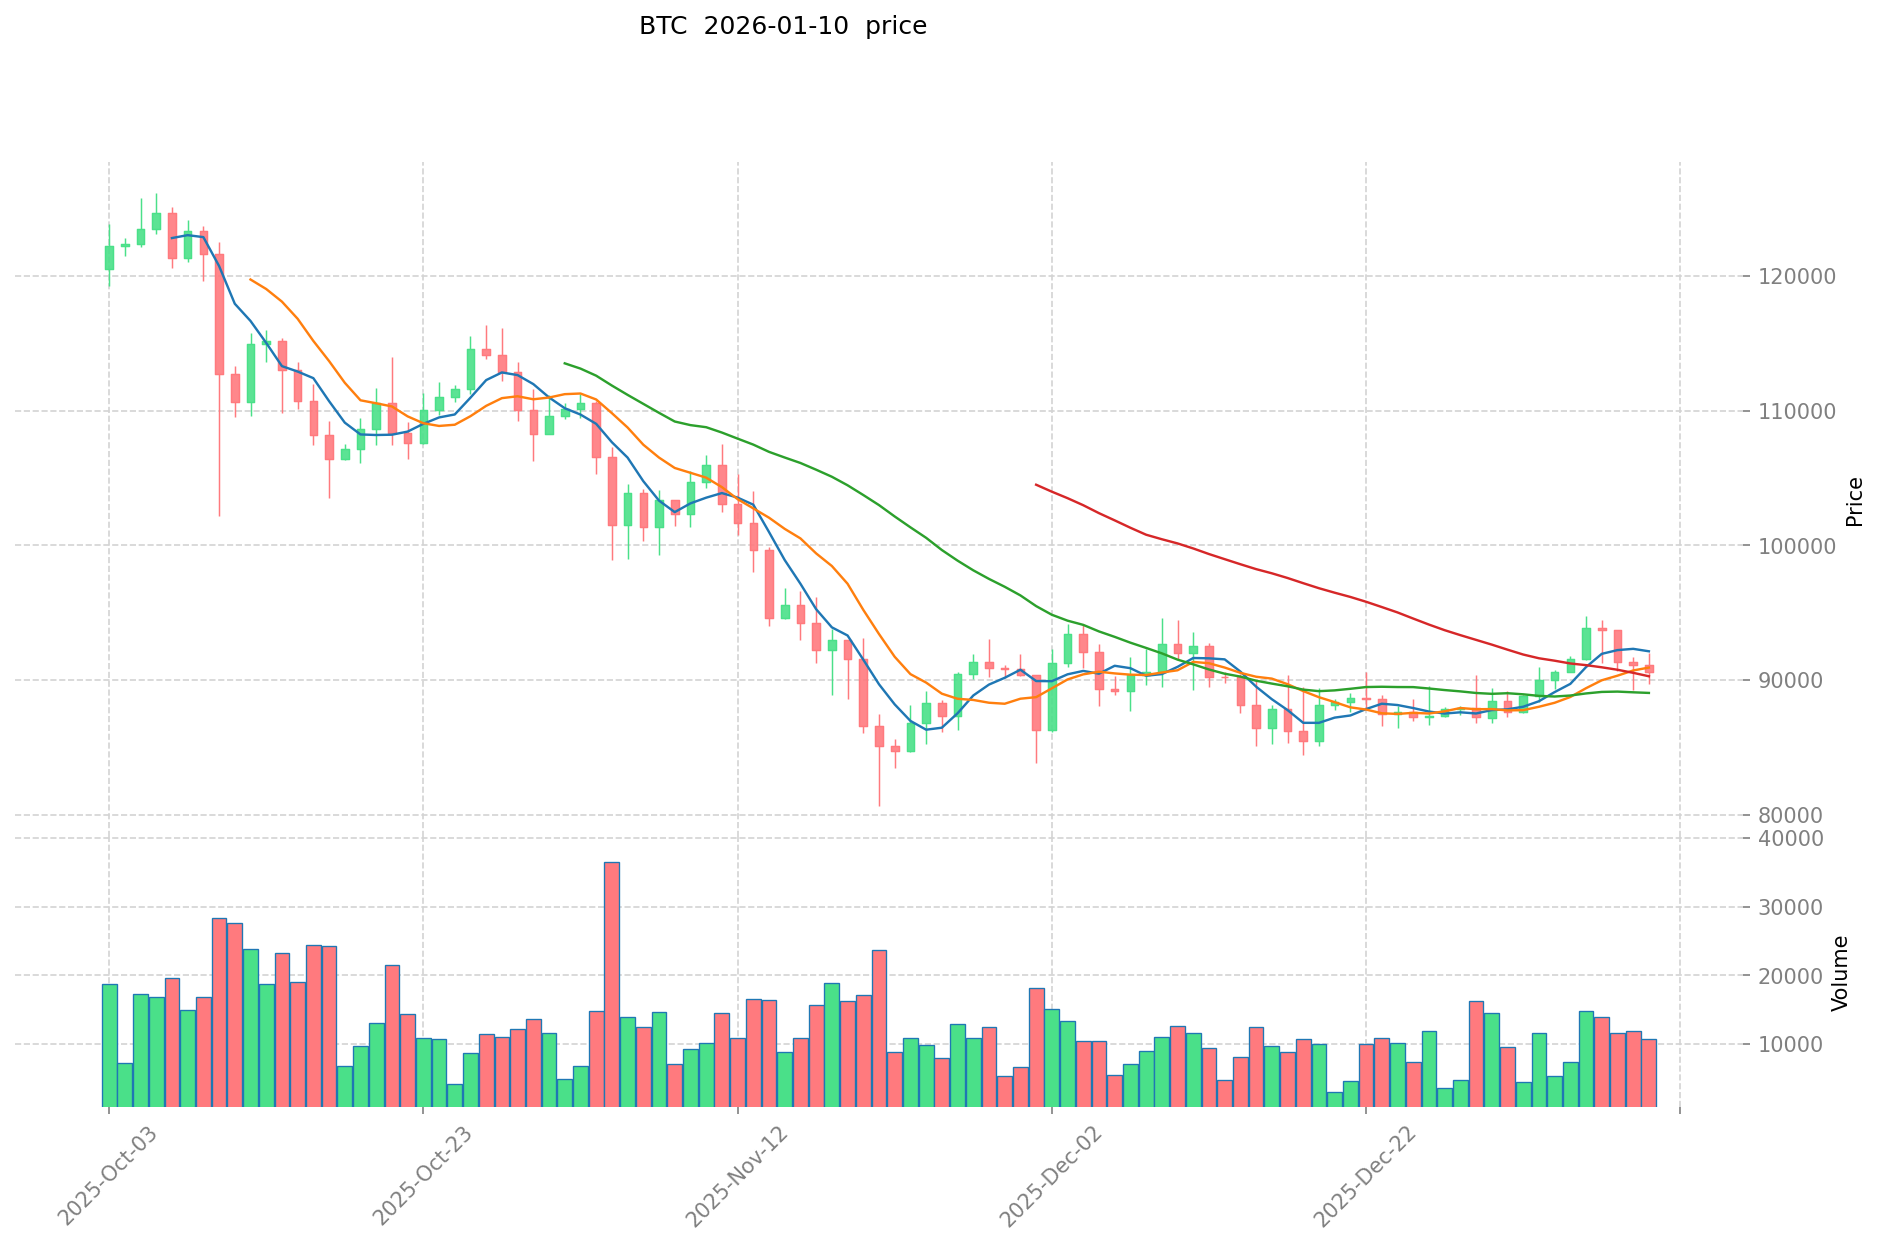
The Death Cross is a bearish technical indicator that occurs when a shorter-term moving average crosses below a longer-term moving average. In Bitcoin's case, this pattern has formed on the daily chart where the 50-day Simple Moving Average (SMA) has crossed below the 200-day SMA from above.
 This crossover is widely recognized in technical analysis as a signal of potential momentum shift from bullish to bearish sentiment.
Moving averages serve as dynamic support and resistance levels that smooth out price action over specific time periods. The 50-day SMA represents medium-term price trends, while the 200-day SMA reflects longer-term market direction. When these two key indicators intersect in a Death Cross formation, it suggests that recent price weakness has become significant enough to alter the broader trend structure.
Bitcoin's daily chart has recently displayed this bearish crossover pattern, marking a notable technical development for the cryptocurrency. The formation occurs after a period of price decline that has pushed the 50-day moving average downward through the 200-day level. This intersection represents a mathematical confirmation that Bitcoin's average price over the past 50 days has fallen below its average price over the past 200 days.
The Death Cross formation on Bitcoin's chart reflects sustained selling pressure that has persisted long enough to shift both short-term and long-term moving averages into bearish alignment. Technical analysts view this pattern as evidence that the cryptocurrency has transitioned from a period of strength to one of potential weakness, though the indicator alone does not guarantee future price direction.
Historical Significance of the Death Cross
Throughout Bitcoin's trading history, Death Cross formations have appeared during various market cycles with mixed outcomes. In some instances, the pattern preceded extended periods of price decline, confirming its bearish implications. However, there have also been cases where Bitcoin recovered shortly after the Death Cross formed, demonstrating that technical indicators should be considered alongside other market factors.
The reliability of the Death Cross as a predictive tool varies depending on broader market conditions, trading volume, and fundamental developments in the cryptocurrency space. While the pattern carries bearish connotations, experienced traders recognize that no single technical indicator provides absolute certainty about future price movements.
Market Implications and Trading Perspectives
The appearance of a Death Cross on Bitcoin's daily chart may influence market sentiment and trading decisions across the cryptocurrency ecosystem. Traders and analysts typically monitor such technical formations for signs of continued weakness or potential recovery signals. The pattern could lead some market participants to adopt more cautious positioning, while others may view it as an opportunity to assess risk-reward ratios at lower price levels.
Market dynamics following a Death Cross formation depend on multiple factors including trading volume, investor sentiment, regulatory developments, and macroeconomic conditions. The cryptocurrency market's inherent volatility means that technical patterns can be invalidated quickly if new catalysts emerge to shift market direction.
Technical Analysis Considerations
When evaluating the Death Cross on Bitcoin's chart, traders should incorporate additional technical indicators and fundamental analysis to form comprehensive market views. Moving average crossovers work best when confirmed by other signals such as trading volume patterns, momentum oscillators, and support-resistance levels.
The Death Cross represents one data point in a broader analytical framework rather than a standalone trading signal. Market participants may combine this pattern with analysis of on-chain metrics, market sentiment indicators, and macroeconomic trends to develop more nuanced perspectives on Bitcoin's potential price trajectory. Risk management remains essential regardless of technical formations, as cryptocurrency markets can exhibit rapid reversals that challenge conventional technical analysis patterns.
FAQ
What is a Death Cross? What does it mean when the 50-day moving average drops below the 200-day moving average?
A Death Cross occurs when the 50-day moving average falls below the 200-day moving average, typically signaling bearish sentiment. For Bitcoin, this historically suggests potential downward price pressure, though past patterns show mixed reliability in predicting sustained declines.
A death cross, where the 50-day moving average drops below the 200-day moving average, historically signals downward price pressure. Bitcoin typically experiences significant corrections lasting several months. Similar patterns in 2018 and 2021 preceded major pullbacks before eventual recoveries.
As an investor, how should you respond and make decisions when Bitcoin experiences a death cross?
When Bitcoin forms a death cross, consider reducing positions or selling as it signals potential price decline. Confirm the trend using volume analysis and other technical indicators like RSI or MACD. Monitor market sentiment closely and adjust your strategy accordingly to manage downside risk effectively.
What is the difference between Death Cross and Golden Cross? How accurate are their predictions for Bitcoin price?
Death Cross signals bearish trends when the 50-day MA falls below the 200-day MA, while Golden Cross signals bullish trends when the 50-day MA rises above the 200-day MA. Their prediction accuracy varies with market volatility, typically ranging from 60-75%, but both can generate false signals during sideways markets.
What other technical indicators can be used in combination with moving averages to confirm Bitcoin's downtrend?
Use RSI, MACD, and Bollinger Bands to confirm Bitcoin's downtrend. RSI measures momentum; MACD tracks trend reversals through signal line crossovers; Bollinger Bands identify overbought conditions and price squeeze breakouts for stronger confirmation signals.
* The information is not intended to be and does not constitute financial advice or any other recommendation of any sort offered or endorsed by Gate.