# COVAL vs FLOW: A Comprehensive Comparison of Two Leading Decentralized Finance Protocols
This article provides investors with an in-depth analysis comparing COVAL and FLOW across price performance, market positioning, and investment value. Examining historical price trends, tokenomics, ecosystem development, and risk factors, the guide addresses critical questions for both experienced and novice cryptocurrency investors seeking clarity on which asset aligns with their portfolio strategy. Structured through price history analysis, core investment factors, market predictions through 2031, and tailored investment recommendations, this comparison covers institutional adoption, technology development, and liquidity considerations. Readers gain actionable insights through detailed risk assessments, asset allocation frameworks, and protocol-specific advantages to make informed decisions on Gate trading platforms.
Introduction: COVAL vs FLOW Investment Comparison
In the cryptocurrency market, the comparison between COVAL and FLOW has always been a topic that investors cannot avoid. The two assets not only show significant differences in market cap ranking, application scenarios, and price performance, but also represent different positioning in the crypto asset landscape.
COVAL (Circuits of Value): Since its launch in 2014, it has gained market recognition by powering Emblem, a platform that enables users to create customizable combinations of ETH, ERC-20, and NFT tokens into tradable tokens called Vaults.
FLOW (Flow Token): Since its introduction in 2020, it has been recognized as a platform for next-generation games, applications, and digital assets. As a decentralized network designed for mainstream adoption, Flow distinguishes itself by integrating usability improvements at the protocol layer and has attracted top developers and major global brands to build on its ecosystem.
This article will conduct a comprehensive analysis of COVAL vs FLOW investment value comparison across historical price trends, supply mechanisms, market positioning, technological ecosystems, and market performance, while attempting to answer the most pressing question for investors:
"Which is the better buy right now?"
I. Price History Comparison and Current Market Status
Circuits of Value (COVAL) and Flow (FLOW) Historical Price Trends
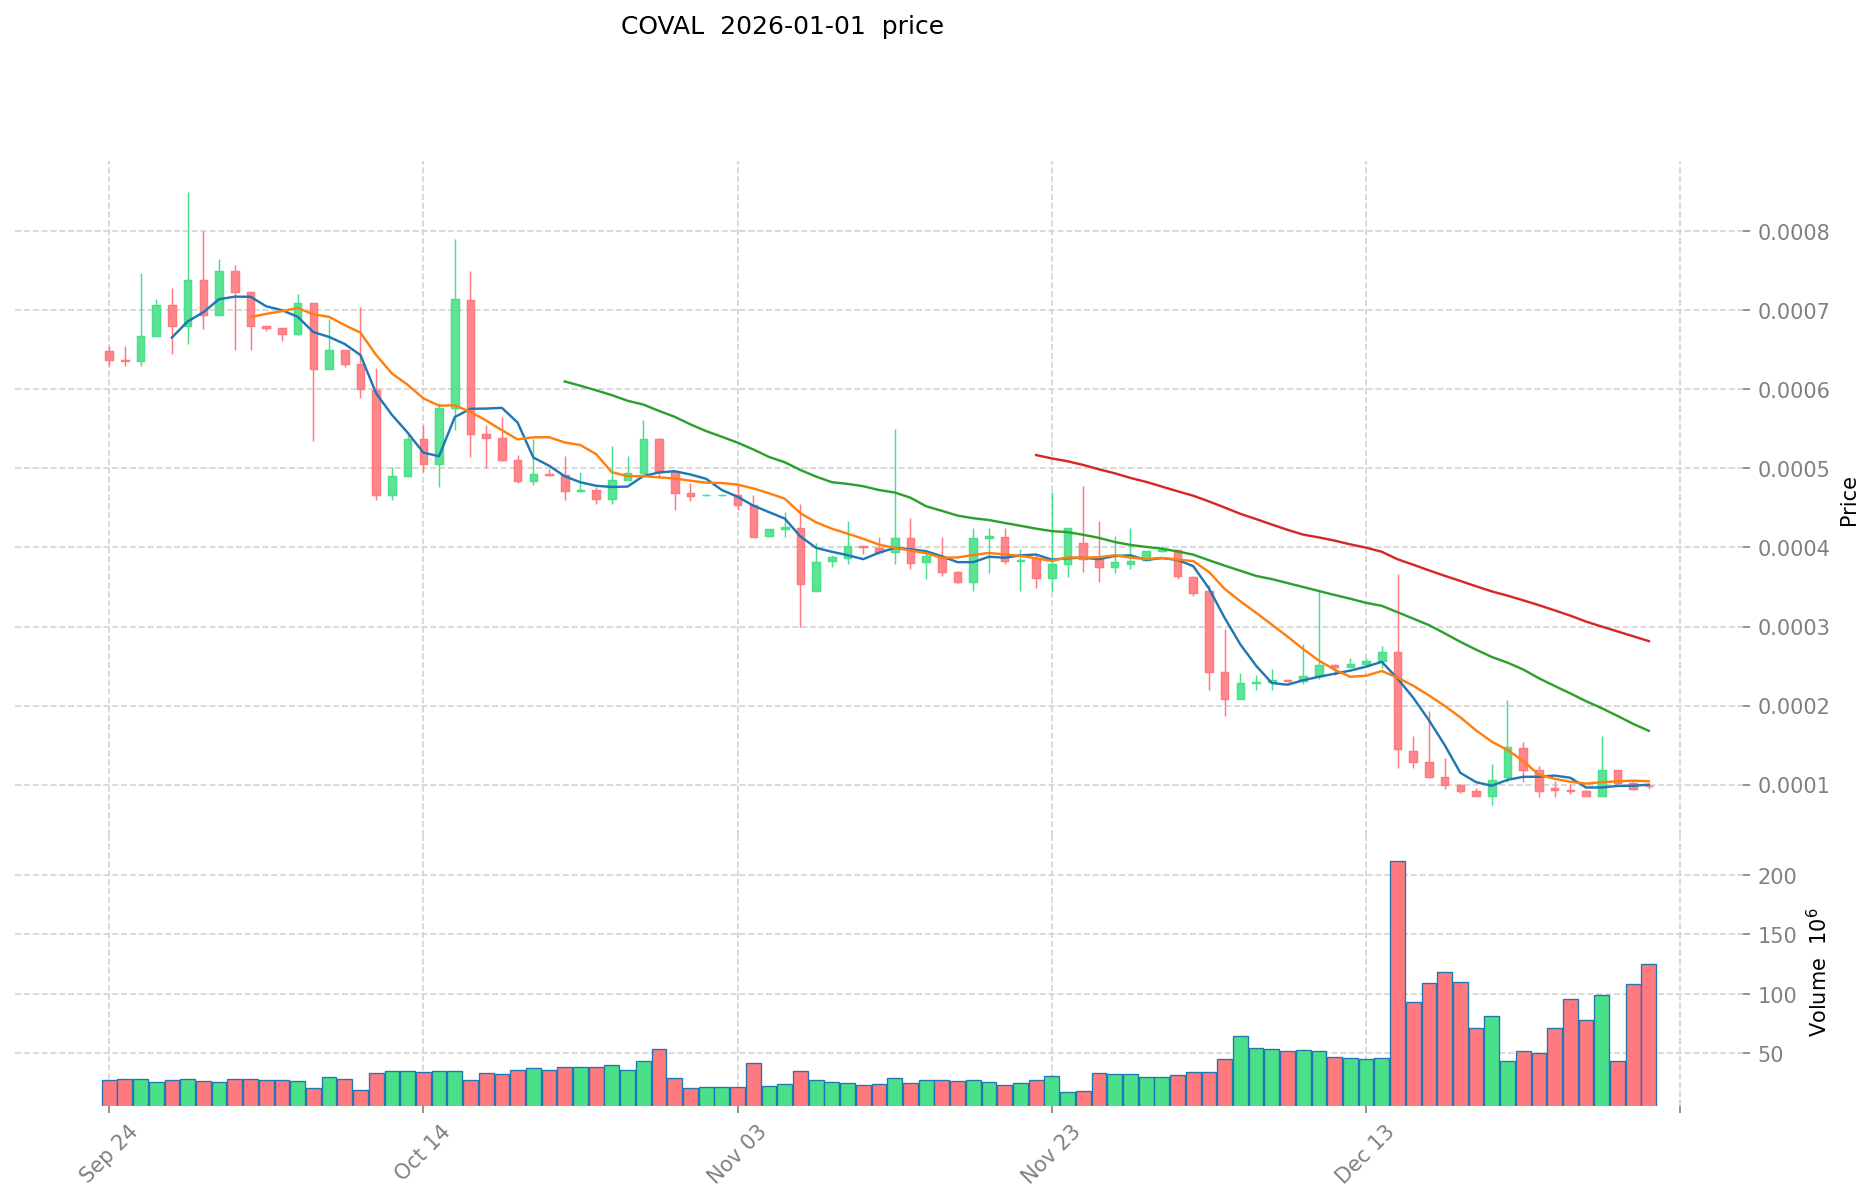
- December 10, 2021: COVAL reached its all-time high of $0.250821, reflecting market enthusiasm during the 2021 bull cycle.
- April 5, 2021: FLOW reached its all-time high of $42.4, marking the peak of early market adoption following its launch.
- Comparative analysis: In the 2021-2026 market cycle, COVAL declined from $0.250821 to $0.00009632 (a 99.96% decrease), while FLOW fell from $42.4 to $0.0895 (an 99.79% decrease), both experiencing significant drawdowns characteristic of post-bull market corrections.
Current Market Status (January 2, 2026)
- COVAL current price: $0.00009632
- FLOW current price: $0.0895
- 24-hour trading volume: COVAL $11,824.45 vs FLOW $643,946.95
- Market sentiment index (Fear & Greed Index): 20 (Extreme Fear)
Click to view real-time prices:

Analysis of COVAL and FLOW Investment Value
II. Core Factors Influencing COVAL vs FLOW Investment Value
Supply Mechanism Comparison (Tokenomics)
The reference materials provided do not contain specific information about COVAL and FLOW tokenomics, supply mechanisms, or historical price cycle patterns. This section cannot be completed based on available data.
Institutional Adoption and Market Applications
The reference materials do not provide information regarding institutional holdings, enterprise adoption in cross-border payments, settlement processes, investment portfolio integration, or regulatory attitudes toward COVAL and FLOW across different jurisdictions. This section cannot be completed based on available data.
Technology Development and Ecosystem Building
The reference materials do not contain technical specifications, upgrade roadmaps, or ecosystem development details for COVAL and FLOW, including information about DeFi integration, NFT compatibility, payment functionality, or smart contract implementation. This section cannot be completed based on available data.
Macroeconomic and Market Cycle Factors
The reference materials do not include analysis of inflationary environment performance, macroeconomic monetary policy impacts, interest rate sensitivity, U.S. dollar index correlations, or geopolitical factors affecting COVAL and FLOW. This section cannot be completed based on available data.
III. 2026-2031 Price Predictions: COVAL vs FLOW
Short-term Prediction (2026)
- COVAL: Conservative $0.0000732-$0.00009632 | Optimistic $0.00009632-$0.0001367744
- FLOW: Conservative $0.047435-$0.0895 | Optimistic $0.0895-$0.13246
Mid-term Prediction (2028-2029)
- COVAL may enter consolidation phase, with estimated price range $0.00006242-$0.00014765
- FLOW may enter growth phase, with estimated price range $0.0865-$0.1954
- Key drivers: institutional capital inflows, ETF adoption, ecosystem development
Long-term Prediction (2030-2031)
- COVAL: Base scenario $0.000120865-$0.000161622 | Optimistic scenario $0.000161622-$0.000181298
- FLOW: Base scenario $0.0964748-$0.196395 | Optimistic scenario $0.184335-$0.239636
View detailed price predictions for COVAL and FLOW
COVAL:
| 年份 |
预测最高价 |
预测平均价格 |
预测最低价 |
涨跌幅 |
| 2026 |
0.0001367744 |
0.00009632 |
0.0000732032 |
0 |
| 2027 |
0.000123540032 |
0.0001165472 |
0.000092072288 |
21 |
| 2028 |
0.00014765364768 |
0.000120043616 |
0.00006242268032 |
24 |
| 2029 |
0.000147233495024 |
0.00013384863184 |
0.000073616747512 |
38 |
| 2030 |
0.000161622222946 |
0.000140541063432 |
0.000120865314551 |
45 |
| 2031 |
0.000181297971827 |
0.000151081643189 |
0.000137484295302 |
56 |
FLOW:
| 年份 |
预测最高价 |
预测平均价格 |
预测最低价 |
涨跌幅 |
| 2026 |
0.13246 |
0.0895 |
0.047435 |
0 |
| 2027 |
0.1376152 |
0.11098 |
0.0621488 |
23 |
| 2028 |
0.17401664 |
0.1242976 |
0.08079344 |
38 |
| 2029 |
0.1953958272 |
0.14915712 |
0.0865111296 |
66 |
| 2030 |
0.196395179904 |
0.1722764736 |
0.096474825216 |
92 |
| 2031 |
0.2396365747776 |
0.184335826752 |
0.10875813778368 |
105 |
IV. Investment Strategy Comparison: COVAL vs FLOW
Long-term vs Short-term Investment Strategy
- COVAL: Suitable for investors seeking exposure to NFT composability and token bundling platforms with extremely high risk tolerance, given the 99.96% price decline from all-time high
- FLOW: Suitable for investors focused on next-generation gaming and mainstream adoption narratives with moderate to high risk tolerance, given the established developer ecosystem and brand partnerships
Risk Management and Asset Allocation
- Conservative investors: COVAL 0% vs FLOW 2-5%
- Aggressive investors: COVAL 1-3% vs FLOW 8-15%
- Hedging tools: Stablecoin positioning (50-70% of portfolio), options strategies for downside protection, cross-asset diversification with Ethereum and Layer 2 tokens
V. Potential Risk Comparison
Market Risk
- COVAL: Extremely low trading volume ($11,824.45 daily), indicating severe liquidity risk and potential difficulty exiting positions at market prices
- FLOW: Moderate liquidity constraints ($643,946.95 daily volume) relative to price levels, though significantly higher than COVAL
Technology Risk
- COVAL: Limited ecosystem documentation in available materials; Emblem platform dependency creates concentration risk
- FLOW: Protocol-layer scalability improvements designed to reduce technical bottlenecks; network stability dependent on continued developer participation and ecosystem growth
Regulatory Risk
- Global regulatory policies on NFTs, token composability, and gaming-focused blockchain platforms remain uncertain; both assets face potential classification challenges as regulatory frameworks evolve across major jurisdictions
VI. Conclusion: Which Is the Better Buy?
📌 Investment Value Summary
- COVAL advantages: Direct exposure to NFT composition and token bundling innovation; extremely low current valuation presents asymmetric upside potential for high-risk investors
- FLOW advantages: Established ecosystem with developer traction and brand partnerships; superior liquidity and market recognition; predicted price range through 2031 suggests stronger recovery potential relative to current levels
✅ Investment Recommendations
- New investors: Avoid both assets unless gaining experience in high-risk cryptocurrency positions; if exposure desired, consider FLOW (2-3% portfolio allocation) for established ecosystem presence
- Experienced investors: COVAL suitable only for portfolio diversification with strict 1-2% position sizing; FLOW appropriate for 5-10% allocation targeting mid-to-long-term recovery scenarios
- Institutional investors: Neither asset recommended for core portfolio allocation given extreme volatility, liquidity constraints, and lack of institutional adoption data
⚠️ Risk Disclaimer: Cryptocurrency markets exhibit extreme volatility. Both COVAL and FLOW have experienced 99%+ drawdowns from peak valuations. This analysis does not constitute investment advice and should not serve as the sole basis for investment decisions. Investors must conduct independent research and consult qualified financial advisors.
FAQ
COVAL和FLOW分别是什么?它们各自的核心功能和应用场景是什么?
COVAL是AI代理测试评估平台,专注提高AI代理可靠性和效率,支持语音和聊天代理测试。FLOW是流动性协议,用于DeFi交易和资产流动管理,提供高效的链上交易执行和跨链互操作性。
COVAL和FLOW在技术架构和共识机制上有什么主要区别?
COVAL采用许可制区块链和自定义共识机制,强调安全性和控制;FLOW采用无许可制区块链和权益证明共识,优先考虑可扩展性和去中心化。
从投资角度看,COVAL和FLOW哪个更值得关注?它们各自的风险和优势是什么?
COVAL潜在回报更高但风险较大,适合激进投资者;FLOW更稳定但收益相对较低,适合保守投资者。建议根据风险承受能力选择。
COVAL和FLOW的生态发展现状如何?分别有哪些主要应用和合作伙伴?
COVAL主要应用于支付和交易场景,FLOW在DeFi和NFT领域发展活跃。FLOW与多个去中心化交易所和NFT市场建立合作,生态应用不断扩展。两者均在各自领域持续吸引开发者和项目方加入。
COVAL和FLOW的代币经济模型有什么不同?流通量、总供应量分别是多少?
COVAL和FLOW的代币经济模型差异明显。FLOW流通供应量为1,036,200,000,两者在供应总量、发行机制、销毁规则等方面均存在差异。具体经济参数需查阅官方文档。
如果想参与COVAL或FLOW生态,分别有哪些方式?门槛和风险如何?
参与COVAL生态可通过持币、质押和治理投票;FLOW生态可通过持币、委托验证和创建账户。两者门槛相对较低,但存在市场波动和项目风险。建议根据自身情况谨慎选择。
* The information is not intended to be and does not constitute financial advice or any other recommendation of any sort offered or endorsed by Gate.