Death Cross in Cryptocurrency: A Bearish Technical Signal. Discover how this classic pattern develops on the 50- and 200-day moving averages, assess its reliability, explore trading strategies on Gate, and review risk management techniques for traders.
Introduction to Technical Analysis in Cryptocurrency
Success in the cryptocurrency market requires the ability to anticipate and correctly interpret market trends. There are two primary approaches to analyzing the market. The first is fundamental analysis, which focuses on market sentiment, news cycles, and macroeconomic factors that affect asset values. The second is technical analysis, which examines price charts, trading volumes, and mathematical indicators.
Technical analysis typically involves identifying chart patterns and formations that may signal future price movements. One of the most recognized and significant patterns is the death cross—a classic technical analysis formation that traditionally signals the onset of a bear market or a sustained downward trend.
What Is the Death Cross
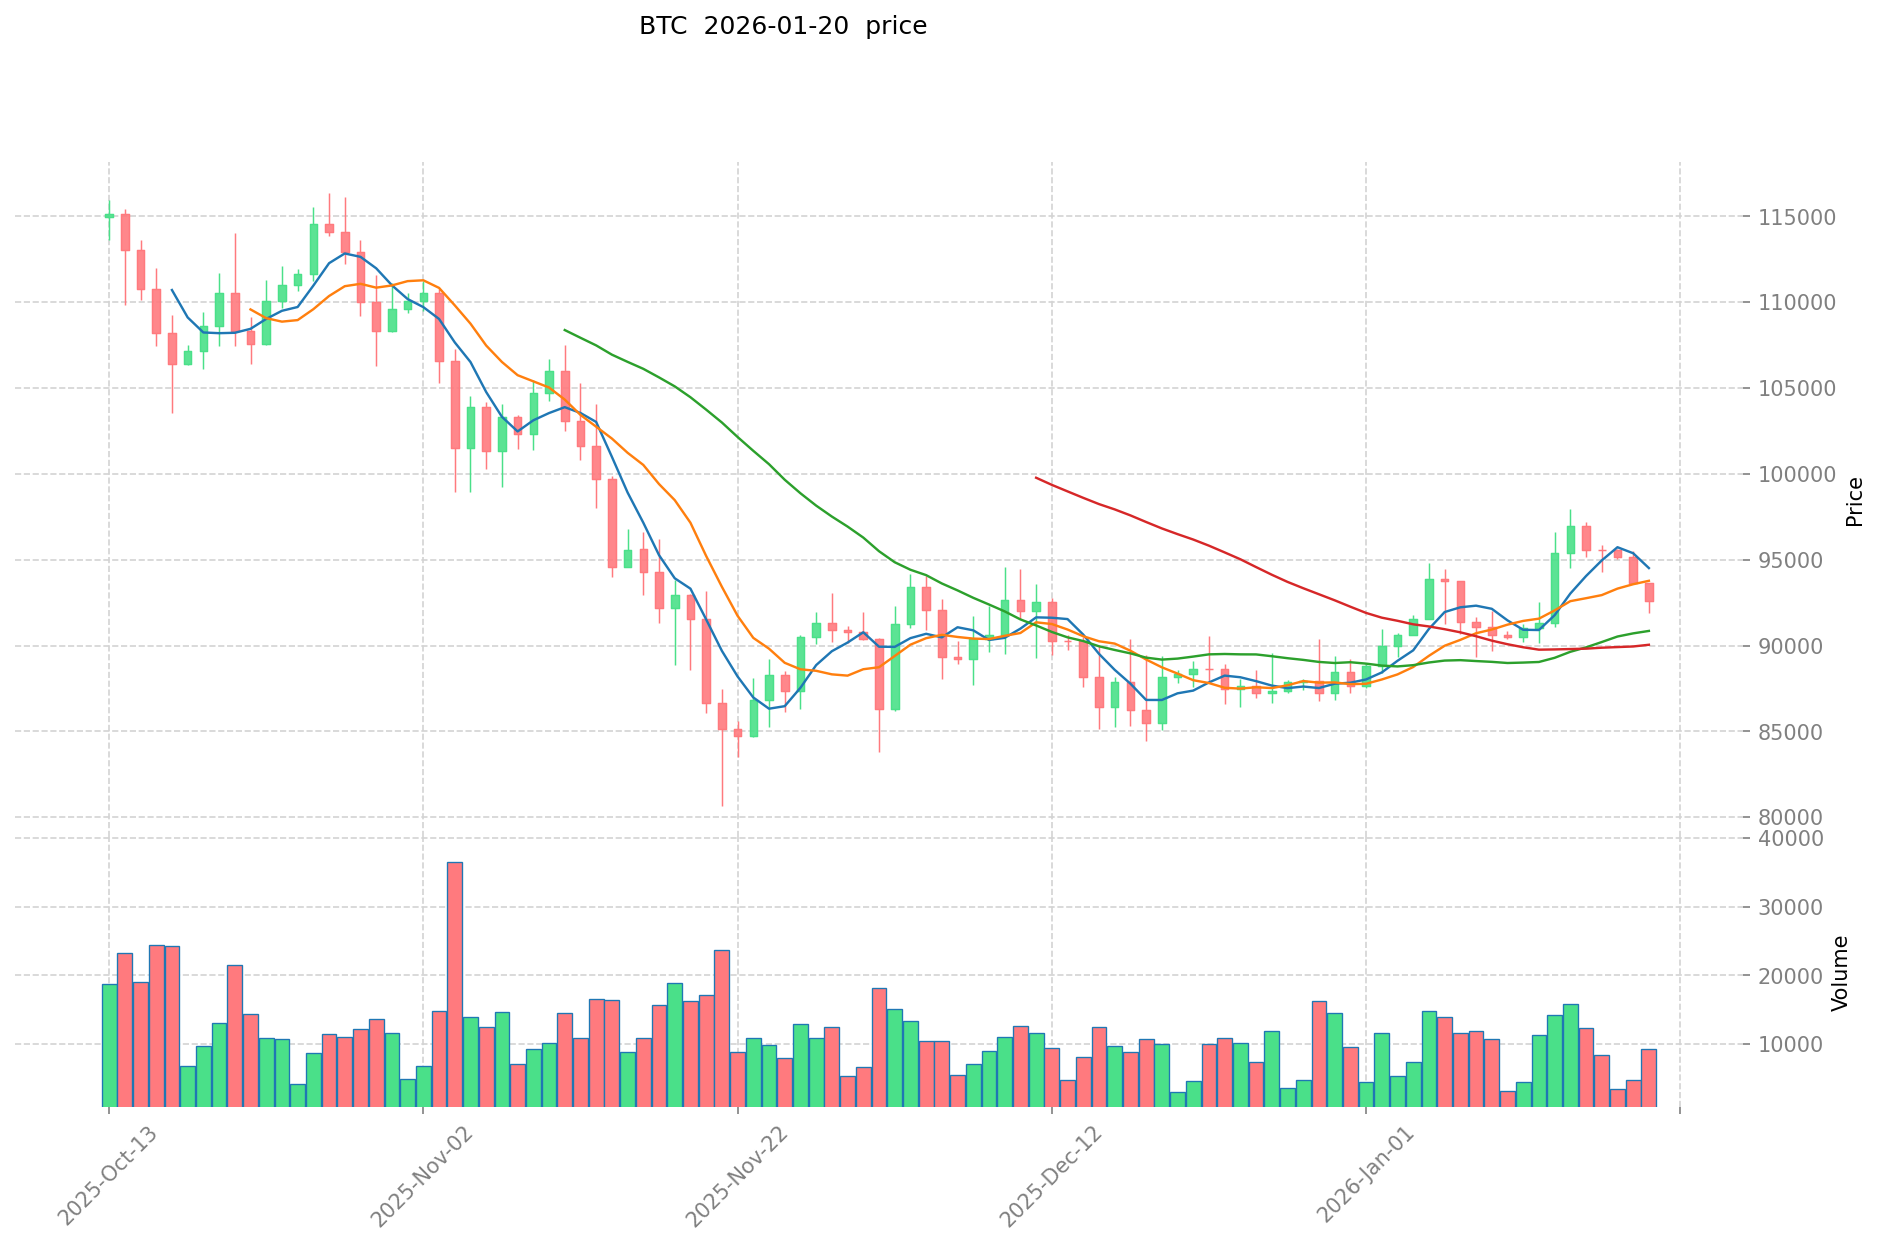
A moving average (MA) is a line plotted on a price chart, calculated by averaging an asset's price over a specified period. This indicator smooths out short-term price fluctuations and highlights the overall trend. For example, the 50-day moving average shows the average price of a cryptocurrency over the past 50 trading days, while the 200-day MA reflects the average price over the last 200 days.
The death cross occurs when the short-term moving average (usually the 50-day MA) crosses below the long-term moving average (typically the 200-day MA). This crossover forms a distinctive chart pattern resembling a cross and is traditionally interpreted as a signal for a potential significant price drop. The pattern’s name reflects its negative implications for asset holders, indicating the possible “death” of an upward trend.
What the Death Cross Indicates
The death cross is a major technical signal that suggests the bull market or upward trend is likely ending. This pattern is considered a bearish indicator, warning of a possible trend reversal. Historical analysis shows that this formation has appeared repeatedly before major economic downturns and significant corrections in financial markets.
Traders and long-term investors actively use the death cross to forecast market movements and make trading decisions. As a technical analysis tool, it is especially useful for identifying when a bullish market is losing momentum and a period of consolidation or decline is beginning. Timely recognition of this pattern allows traders to sell assets and capture profits before a steep price drop, or to open short positions to profit from downward price action.
How to Identify the Death Cross
The death cross typically develops in three sequential phases, each with distinct characteristics:
Phase 1: Preparation and Consolidation—During this period, the asset’s price consolidates or fluctuates slightly after a major upward move. The short-term 50-day MA remains above the long-term 200-day MA, but the gap between them begins to narrow. This signals a gradual weakening of bullish momentum and increasing selling pressure.
Phase 2: Formation of the Death Cross—This is the critical point when the short-term MA crosses below the long-term MA. The crossover creates the signature chart pattern and generates a bearish signal. At this stage, negative sentiment emerges, and traders grow concerned about future price direction, which can lead to increased selling volume.
Phase 3: Downward Movement and Confirmation—After the death cross forms, the price usually continues to fall, while the two moving averages diverge further. The short-term MA acts as dynamic resistance, blocking attempts for the price to reverse upward. This phase can last anywhere from several weeks to several months, depending on the strength of the bearish trend.
Are Death Crosses Reliable Indicators?
The death cross is a valuable technical tool, but it’s important to recognize its limitations. While historically effective, this pattern is not a perfect predictor and can produce false signals. For instance, in 2016 a death cross formed in the stock market, causing many investors to prepare for a major downturn. However, the expected reversal didn’t materialize and the market continued to rise.
Thus, the death cross is statistically reliable based on historical data, but it does not always perform as traders expect. Its effectiveness improves considerably when combined with other technical indicators and analysis methods, as well as with consideration of fundamental factors and the broader market context.
Pros and Cons of Death Cross Pattern Analysis
Advantages of Using the Pattern
- Provides a reliable indicator of long-term market trend changes and helps identify major reversals
- Enables effective risk management during high volatility and protects capital
- Easy to spot on charts—even for beginner traders—making it an accessible tool
- Based on objective mathematical calculations, eliminating subjective interpretation
Disadvantages and Limitations
- Can generate false signals, especially in highly volatile markets with frequent sharp moves
- Functions as a lagging indicator, since it forms after the trend reversal has already started
- For greater accuracy, should be used in combination with other technical indicators and analysis methods
- May be less effective in markets with low liquidity
It’s worth noting that the death cross is gaining popularity among crypto traders, as it has shown strong effectiveness on Bitcoin charts. Throughout the history of the crypto market, this pattern has appeared several times, and in nearly every case, its formation was followed by a significant price decline.
Trading Strategies When a Death Cross Appears
For maximum effectiveness, use the death cross in conjunction with other technical indicators and analysis methods. Here are several proven approaches:
Analyzing Sudden Spikes in Trading Volume
If a sharply increased trading volume is observed when the death cross forms, it strengthens the reliability of the bearish signal. High volume indicates broad trader participation in the move and signals an imminent major trend reversal. Look for volumes at least 1.5–2x above the average.
Using the Fear Index (VIX)
The volatility index (VIX), also called the fear index, measures the level of anxiety and uncertainty in the market. Fear is considered elevated when the index rises above 20. If VIX reaches 30 or higher simultaneously with the death cross, the likelihood of a substantial price correction increases significantly.
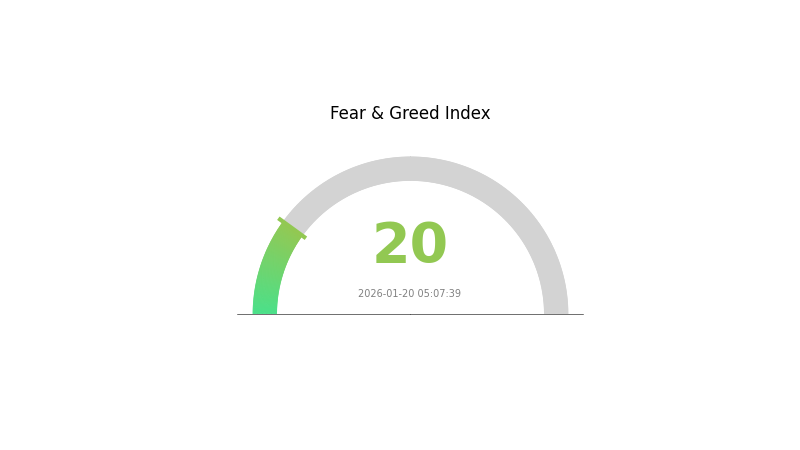 This combination produces a powerful bearish signal.
Applying the Relative Strength Index (RSI)
The Relative Strength Index (RSI) indicates whether an asset is overbought or oversold. If RSI shows the asset is overbought (above 70) and a death cross forms at the same time, the probability of a downward reversal increases significantly. This combination signals that bullish momentum is exhausted and a correction is underway.
Checking the MACD Indicator
MACD (Moving Average Convergence/Divergence) is an oscillator that shows whether the current trend is losing or gaining momentum. It also helps define whether the market is bearish or bullish. When a death cross appears, check whether the MACD confirms the bearish signal with a downward crossover of the signal line or the emergence of bearish divergence. Such confirmation greatly increases the reliability of the trading signal.
Death Cross in the Cryptocurrency Market: Conclusion
Technical analysis is a powerful tool that, when used correctly, can greatly enhance trading effectiveness. It enables informed forecasting and early anticipation of market trend changes. Given the high volatility in cryptocurrency markets, the ability to quickly recognize signs of trend reversal is a critical skill for every trader.
Death crosses often occur before major price drops, but it’s important to understand they are not absolute indicators. In some cases, the pattern forms after the decline has already begun, which limits its practical value for short entries. Nevertheless, any technical signal pointing to a potential start of a bearish trend provides value for risk management and capital protection. The key to successfully using the death cross lies in a comprehensive approach: combining this pattern with other indicators, considering market context, and factoring in fundamentals.
FAQ
What Is the Death Cross Pattern in Cryptocurrency, and How Is It Formed?
The death cross is a technical pattern that occurs when the fast moving average (50-day) crosses below the long-term (200-day) moving average. This bearish signal indicates a strengthening downtrend and the potential for a price decline in a crypto asset.
How Can You Identify and Confirm Death Cross Signals, and What Are the Key Indicators?
The death cross forms when the fast moving average (50-day) crosses downward beneath the slow moving average (200-day). Key indicators include: trading volume (should increase), Relative Strength Index (RSI drops below 30), and MACD (histogram turns negative). These signal a bearish trend.
How Accurate Is the Death Cross in Cryptocurrency Trading and What Is the Success Rate?
The death cross has an accuracy rate of about 60–70% based on historical data. Actual results depend on market volatility, timeframes, and supplementary indicators. Combining with other signals is recommended to increase trading reliability.
What Are the Main Risks to Consider When Trading with the Death Cross Pattern?
Primary risks include false signals in sideways markets, indicator lag, sharp price reversals, low trading activity, and the risk of losses if the trend fails.
Death Crosses vs. Golden Crosses: What’s the Difference and How Can They Be Used Together?
The death cross forms when the fast moving average crosses the slow from above, signaling a bearish trend. The golden cross is a crossover from below, signaling a bullish trend. Used together, they provide confirmation: the golden cross signals growth, the death cross signals a price drop. Use them for entry and exit decisions, along with trading volume analysis.
How Does the Death Cross Pattern Manifest in Major Cryptocurrencies Like Bitcoin and Ethereum?
On Bitcoin and Ethereum, the death cross signals a trend reversal. When the short-term moving average crosses below the long-term, a significant price decline often follows. This pattern is especially effective on higher timeframes and often precedes bear markets with drops of 20–40%.
How Should You Build a Trading Strategy and Risk Management Plan After a Death Cross Appears?
After a death cross forms, average entries at lower price levels, set stop-losses 5–8% below current price, reduce position size by 30–50%, monitor support levels, and wait for reversal confirmation before re-entering. Diversify trading capital across multiple assets.
What Historical Examples Show the Death Cross Has Had a Major Impact on Cryptocurrency Prices?
The 2018 death cross saw BTC drop from $6,500 to $3,600, and in 2022 ETH fell 40% in a month—both demonstrating strong bearish trends and a shift by investors into defensive strategies.
* The information is not intended to be and does not constitute financial advice or any other recommendation of any sort offered or endorsed by Gate.