The article "DEAI vs DYDX" provides a comprehensive comparison of two prominent decentralized trading platforms within the crypto market. It examines historical price trends, market status, supply mechanics, institutional adoption, and technical ecosystems for both. Readers will gain insights into which platform offers better investment value currently, exploring DEAI's AI integration potential and DYDX's established status with higher liquidity. Additionally, the article discusses strategic investment approaches and potential risks associated with each token, targeting investors keen on long-term and short-term strategies within decentralized exchanges.
Introduction: DEAI vs DYDX Investment Comparison
In the cryptocurrency market, the comparison between DEAI vs DYDX has been an unavoidable topic for investors. The two not only show significant differences in market cap ranking, application scenarios, and price performance but also represent different crypto asset positioning.
DEAI (DEAI): Since its launch, it has gained market recognition for its pioneering role in the Decentralized Artificial Intelligence (DeAI) ecosystem.
DYDX (DYDX): Since its inception in 2021, it has been hailed as a decentralized derivatives trading protocol, becoming one of the globally recognized cryptocurrencies in terms of trading volume and market capitalization.
This article will comprehensively analyze the investment value comparison between DEAI vs DYDX, focusing on historical price trends, supply mechanisms, institutional adoption, technological ecosystems, and future predictions, attempting to answer the question most concerning investors:
"Which is the better buy right now?"
I. Price History Comparison and Current Market Status
DEAI (Coin A) and DYDX (Coin B) Historical Price Trends
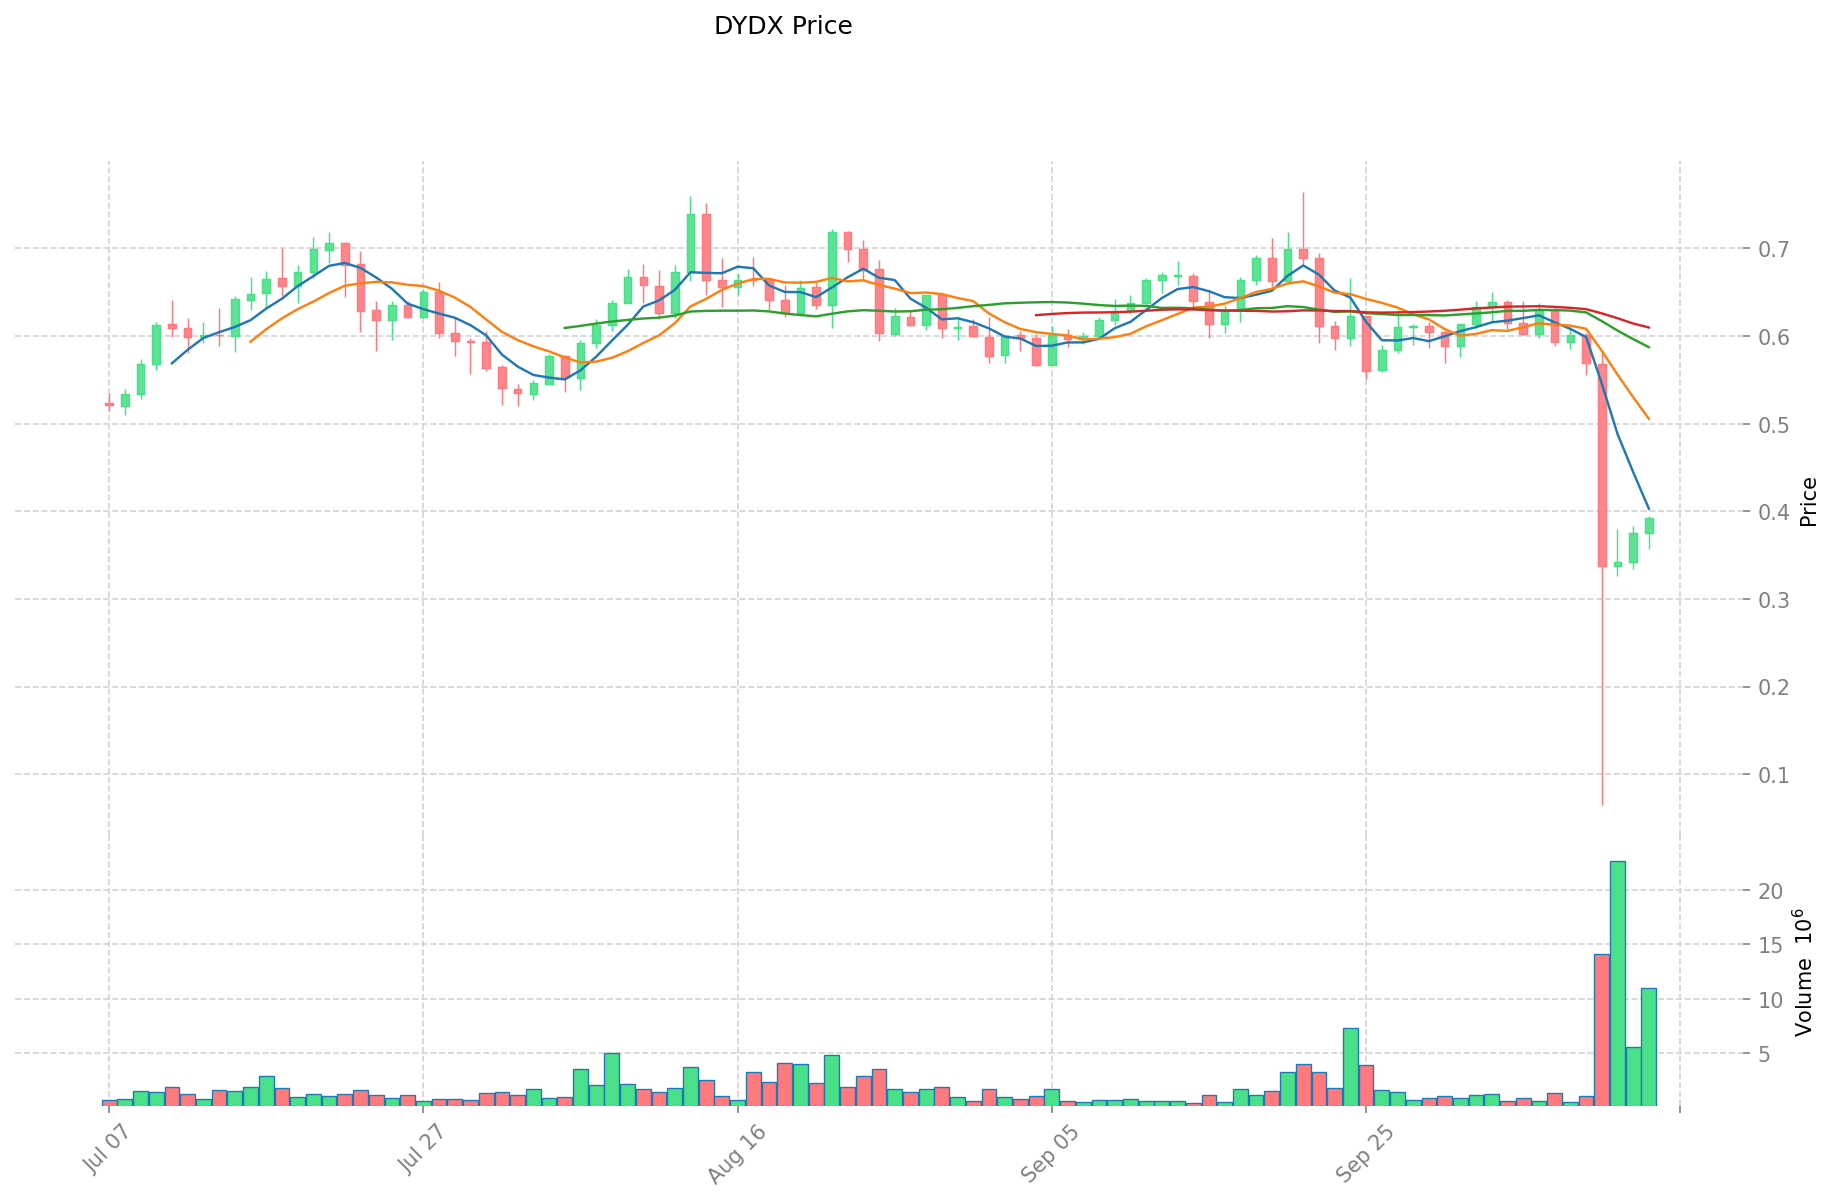
- 2024: DYDX reached its all-time high of $4.52 on March 8, 2024.
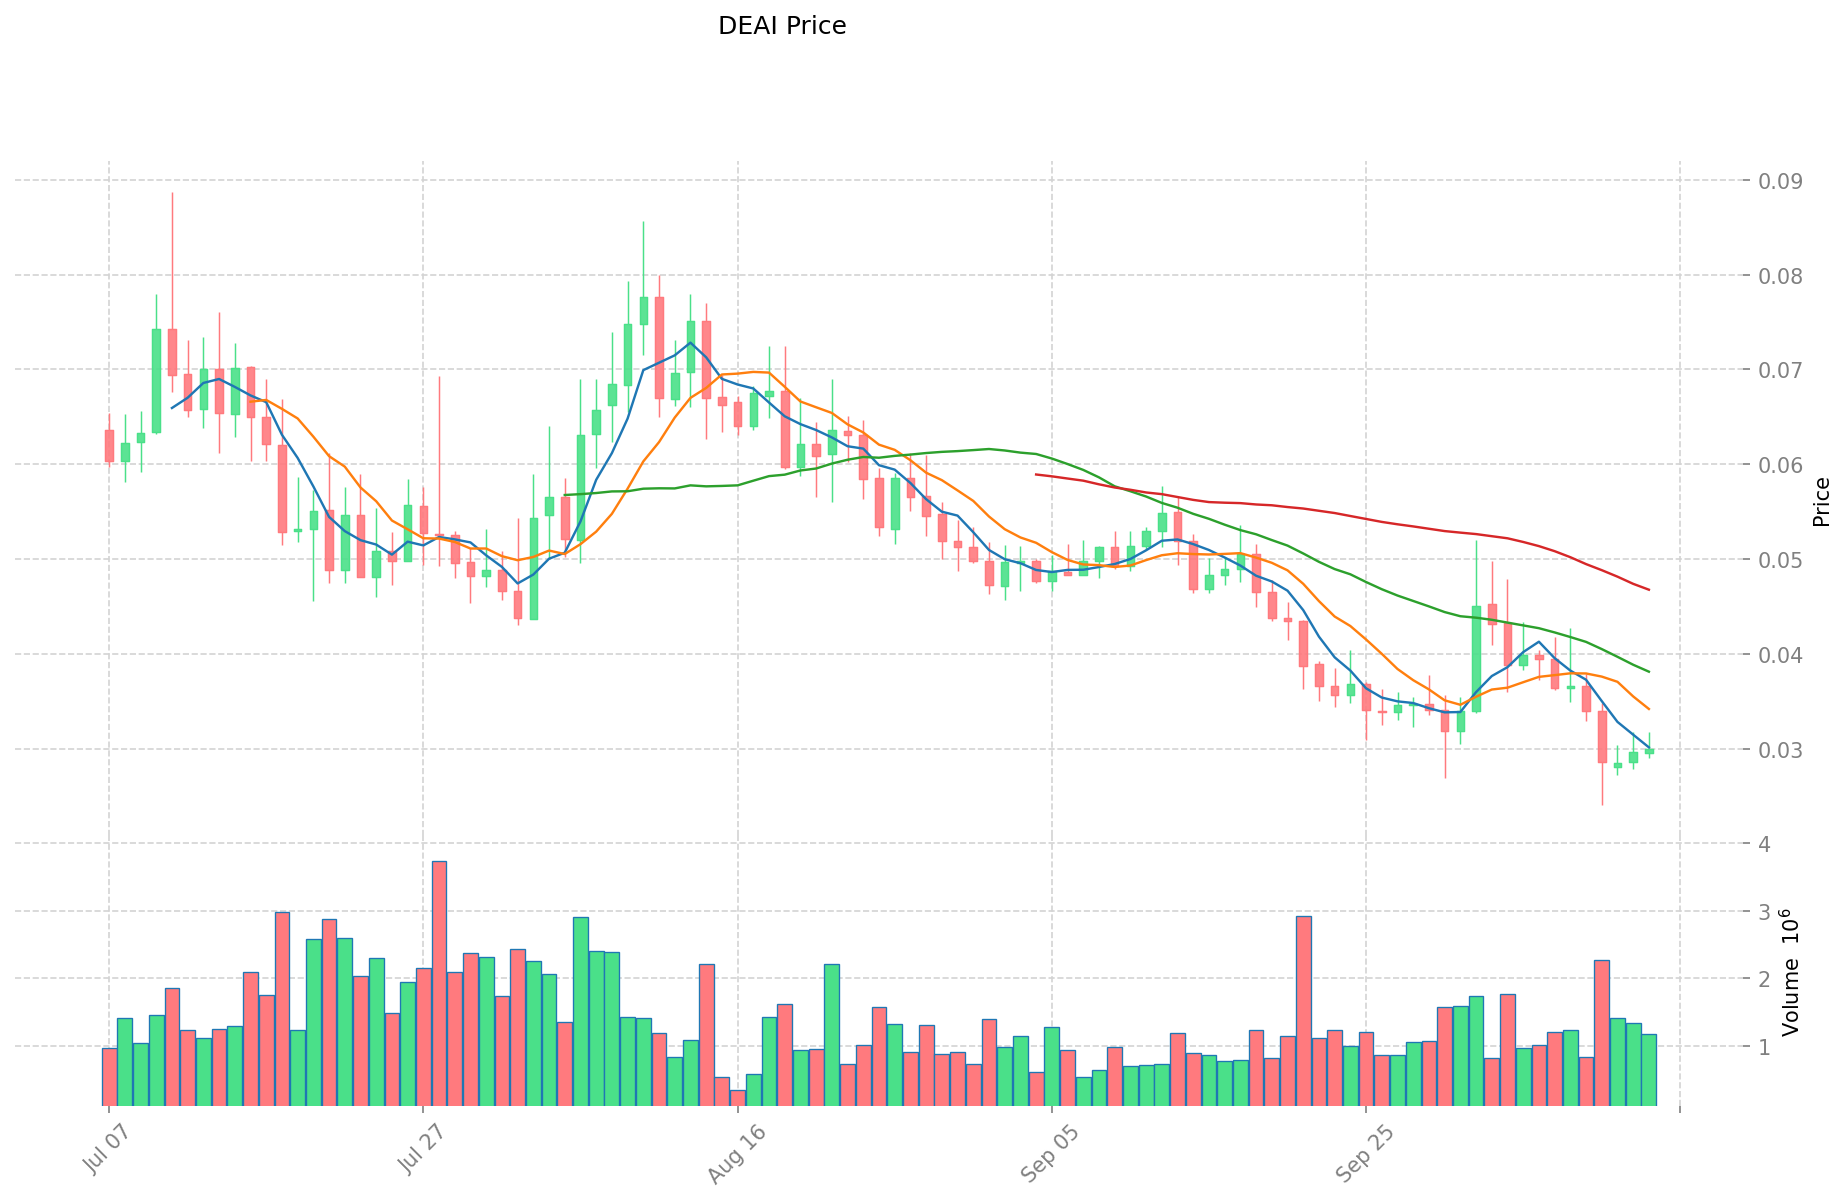
- 2025: DEAI hit its all-time low of $0.02408 on October 10, 2025.
- Comparative analysis: In the recent market cycle, DEAI dropped from its all-time high of $1.1 to its current price of $0.03, while DYDX declined from its peak of $4.52 to $0.392.
Current Market Situation (2025-10-14)
- DEAI current price: $0.03
- DYDX current price: $0.392
- 24-hour trading volume: DEAI $35,637.77 vs DYDX $4,102,967.08
- Market Sentiment Index (Fear & Greed Index): 38 (Fear)
Click to view real-time prices:
- Check DEAI current price Market Price
- Check DYDX current price Market Price
II. Key Factors Influencing DEAI vs DYDX Investment Value
Supply Mechanism Comparison (Tokenomics)
- DEAI: The token follows an inflationary model with 50% of the total 1 billion tokens allocated to mining rewards. Tokens are emitted over a 4-year period through trading competitions and other activities.
- DYDX: Features a multi-stage token distribution with 27.7% allocated to the community treasury, 7.5% to future employees, and remaining tokens distributed to investors, team members, and traders. Total supply is capped at 1 billion tokens.
- 📌 Historical Pattern: Controlled emission schedules tend to create supply constraints during peak demand periods, potentially driving price appreciation cycles.
Institutional Adoption and Market Applications
- Institutional Holdings: DYDX has gained more institutional traction, with backing from major venture capital firms like a16z, Paradigm, and Three Arrows Capital.
- Enterprise Adoption: DYDX has established itself as a leading decentralized perpetual trading platform with substantial trading volume, while DEAI is still in early adoption phases.
- Regulatory Attitudes: Both face regulatory challenges as decentralized trading platforms, though DYDX has a longer operational history navigating these waters.
Technical Development and Ecosystem Building
- DEAI Technical Development: Built on a high-performance matching engine with claims of processing up to 100,000 transactions per second, using AI for liquidity provision.
- DYDX Technical Development: Recently upgraded to v4, operating as an Ethereum L2 solution on the Cosmos ecosystem with StarkEx technology, offering reduced gas fees and improved scalability.
- Ecosystem Comparison: DYDX has a more mature ecosystem with established liquidity and trading volumes, while DEAI is building out AI-integrated trading features and a cross-chain infrastructure.
Macroeconomic and Market Cycles
- Performance in Inflationary Environments: Both protocols represent trading platforms rather than store-of-value assets, making them less directly correlated with inflation hedging.
- Macroeconomic Monetary Policy: Interest rate changes and market volatility tend to affect trading platforms through their impact on trading volumes rather than direct valuation.
- Geopolitical Factors: Decentralized exchanges potentially benefit from increased regulatory uncertainty in traditional finance, with both platforms positioned to capture cross-border trading demand.
III. 2025-2030 Price Prediction: DEAI vs DYDX
Short-term Prediction (2025)
- DEAI: Conservative $0.023556 - $0.0302 | Optimistic $0.0302 - $0.04077
- DYDX: Conservative $0.261558 - $0.3963 | Optimistic $0.3963 - $0.428004
Mid-term Prediction (2027)
- DEAI may enter a growth phase, with an estimated price range of $0.033625586 - $0.05116937
- DYDX may enter a steady growth phase, with an estimated price range of $0.333534006 - $0.6208863804
- Key drivers: Institutional capital inflow, ETFs, ecosystem development
Long-term Prediction (2030)
- DEAI: Base scenario $0.05280678984 - $0.076569845268 | Optimistic scenario $0.076569845268+
- DYDX: Base scenario $0.76608425236122 - $1.141465536018217 | Optimistic scenario $1.141465536018217+
View detailed price predictions for DEAI and DYDX
Disclaimer
DEAI:
| 年份 |
预测最高价 |
预测平均价格 |
预测最低价 |
涨跌幅 |
| 2025 |
0.04077 |
0.0302 |
0.023556 |
0 |
| 2026 |
0.0376141 |
0.035485 |
0.0312268 |
18 |
| 2027 |
0.05116937 |
0.03654955 |
0.033625586 |
21 |
| 2028 |
0.0543857304 |
0.04385946 |
0.0399121086 |
46 |
| 2029 |
0.05649098448 |
0.0491225952 |
0.032912138784 |
63 |
| 2030 |
0.076569845268 |
0.05280678984 |
0.042245431872 |
76 |
DYDX:
| 年份 |
预测最高价 |
预测平均价格 |
预测最低价 |
涨跌幅 |
| 2025 |
0.428004 |
0.3963 |
0.261558 |
1 |
| 2026 |
0.61410648 |
0.412152 |
0.33384312 |
5 |
| 2027 |
0.6208863804 |
0.51312924 |
0.333534006 |
30 |
| 2028 |
0.731440075158 |
0.5670078102 |
0.549997575894 |
44 |
| 2029 |
0.88294456204344 |
0.649223942679 |
0.34408868961987 |
65 |
| 2030 |
1.141465536018217 |
0.76608425236122 |
0.451989708893119 |
95 |
IV. Investment Strategy Comparison: DEAI vs DYDX
Long-term vs Short-term Investment Strategies
- DEAI: Suitable for investors focused on AI integration and emerging ecosystems
- DYDX: Suitable for investors seeking established decentralized trading platforms
Risk Management and Asset Allocation
- Conservative investors: DEAI: 10% vs DYDX: 90%
- Aggressive investors: DEAI: 30% vs DYDX: 70%
- Hedging tools: Stablecoin allocation, options, cross-token portfolio
V. Potential Risk Comparison
Market Risk
- DEAI: Higher volatility due to lower market cap and trading volume
- DYDX: Exposure to overall crypto market sentiment and trading volume fluctuations
Technical Risk
- DEAI: Scalability, network stability, AI integration challenges
- DYDX: Smart contract vulnerabilities, Layer 2 scaling issues
Regulatory Risk
- Global regulatory policies may impact both tokens differently, with DYDX potentially facing more scrutiny due to its established position in decentralized derivatives trading
VI. Conclusion: Which Is the Better Buy?
📌 Investment Value Summary:
- DEAI advantages: AI integration potential, early-stage growth opportunities
- DYDX advantages: Established platform, higher liquidity, institutional backing
✅ Investment Advice:
- New investors: Consider a smaller allocation to DYDX for exposure to decentralized trading
- Experienced investors: Balanced approach with higher DYDX allocation and some DEAI for potential growth
- Institutional investors: Focus on DYDX for its established market position and liquidity
⚠️ Risk Warning: Cryptocurrency markets are highly volatile. This article does not constitute investment advice.
None
VII. FAQ
Q1: What are the key differences between DEAI and DYDX?
A: DEAI is focused on the Decentralized Artificial Intelligence ecosystem, while DYDX is an established decentralized derivatives trading protocol. DEAI has a lower market cap and is in earlier stages of development, while DYDX has higher trading volumes and institutional backing.
Q2: Which token has shown better price performance recently?
A: Based on the provided data, DYDX has shown better price performance. It reached an all-time high of $4.52 in March 2024 and currently trades at $0.392, while DEAI hit an all-time low of $0.02408 in October 2025 and currently trades at $0.03.
Q3: How do the supply mechanisms of DEAI and DYDX differ?
A: DEAI follows an inflationary model with 50% of tokens allocated to mining rewards over 4 years. DYDX has a multi-stage distribution with allocations to community treasury, employees, investors, and traders, with a capped total supply of 1 billion tokens.
Q4: What are the main technical developments for each platform?
A: DEAI claims to have a high-performance matching engine processing up to 100,000 transactions per second and uses AI for liquidity provision. DYDX recently upgraded to v4, operating as an Ethereum L2 solution on the Cosmos ecosystem with StarkEx technology for reduced fees and improved scalability.
Q5: How do the long-term price predictions for 2030 compare?
A: For DEAI, the base scenario predicts a range of $0.05280678984 - $0.076569845268, with an optimistic scenario above $0.076569845268. For DYDX, the base scenario predicts a range of $0.76608425236122 - $1.141465536018217, with an optimistic scenario above $1.141465536018217.
Q6: What are the recommended investment strategies for these tokens?
A: For conservative investors, a suggested allocation is 10% DEAI and 90% DYDX. For aggressive investors, the suggestion is 30% DEAI and 70% DYDX. New investors might consider a smaller allocation to DYDX, while experienced investors could take a balanced approach with a higher DYDX allocation and some DEAI for potential growth.
Q7: What are the main risks associated with investing in DEAI and DYDX?
A: Both face market risks related to crypto volatility. DEAI has higher volatility due to its lower market cap and trading volume, while DYDX is more exposed to overall crypto market sentiment. Technical risks include scalability and network stability for DEAI, and smart contract vulnerabilities for DYDX. Both face regulatory risks, with DYDX potentially facing more scrutiny due to its established position in decentralized derivatives trading.
* The information is not intended to be and does not constitute financial advice or any other recommendation of any sort offered or endorsed by Gate.


