# Article Overview: DPY vs DOT Comprehensive Comparison
This article provides an in-depth investment analysis comparing DPY (Delphy) and DOT (Polkadot), two distinct blockchain tokens operating in different ecosystems. It examines historical price trends, market capitalization dynamics, tokenomics, institutional adoption, and ecosystem maturity to address the core question: which token offers better investment value? The guide evaluates DPY's decentralized prediction market platform against DOT's cross-chain infrastructure protocol, analyzing risk profiles and forecasting price trajectories through 2031. Designed for both beginner and experienced investors, this comparison on Gate helps readers make informed allocation decisions based on risk tolerance, with practical investment strategies and detailed risk assessments for each asset class.
Introduction: DPY vs DOT Investment Comparison
In the cryptocurrency market, comparing DPY vs DOT is an inevitable topic for investors. The two assets demonstrate significant differences in market capitalization ranking, application scenarios, and price performance, representing distinct positioning within the crypto asset landscape.
DPY (Delphy): Launched in 2017, it has gained market recognition through its decentralized prediction market platform built on Ethereum, enabling users to participate in customized prediction events and earn rewards based on forecast accuracy.
DOT (Polkadot): Since its inception in 2019, it has been recognized as a next-generation blockchain infrastructure protocol, designed to connect independent blockchains through its relay chain, facilitating trustless information and transaction exchange across a multi-chain ecosystem.
This article will comprehensively analyze the investment value comparison between DPY vs DOT across multiple dimensions including historical price trends, market capitalization dynamics, ecosystem maturity, and adoption metrics, while addressing the core question investors need answered:
"Which is the better buy right now?"
Delphy (DPY) vs Polkadot (DOT) Market Analysis
I. Price History Comparison and Current Market Status
Delphy (DPY) and Polkadot (DOT) Historical Price Trends
- January 4, 2018: DPY reached its all-time high of $4.88, driven by the early expansion of the prediction market ecosystem and heightened investor interest in blockchain-based forecasting platforms.
- November 4, 2021: DOT achieved its all-time high of $54.98, reflecting strong market sentiment around Polkadot's cross-chain interoperability capabilities and the expansion of its parachain ecosystem.
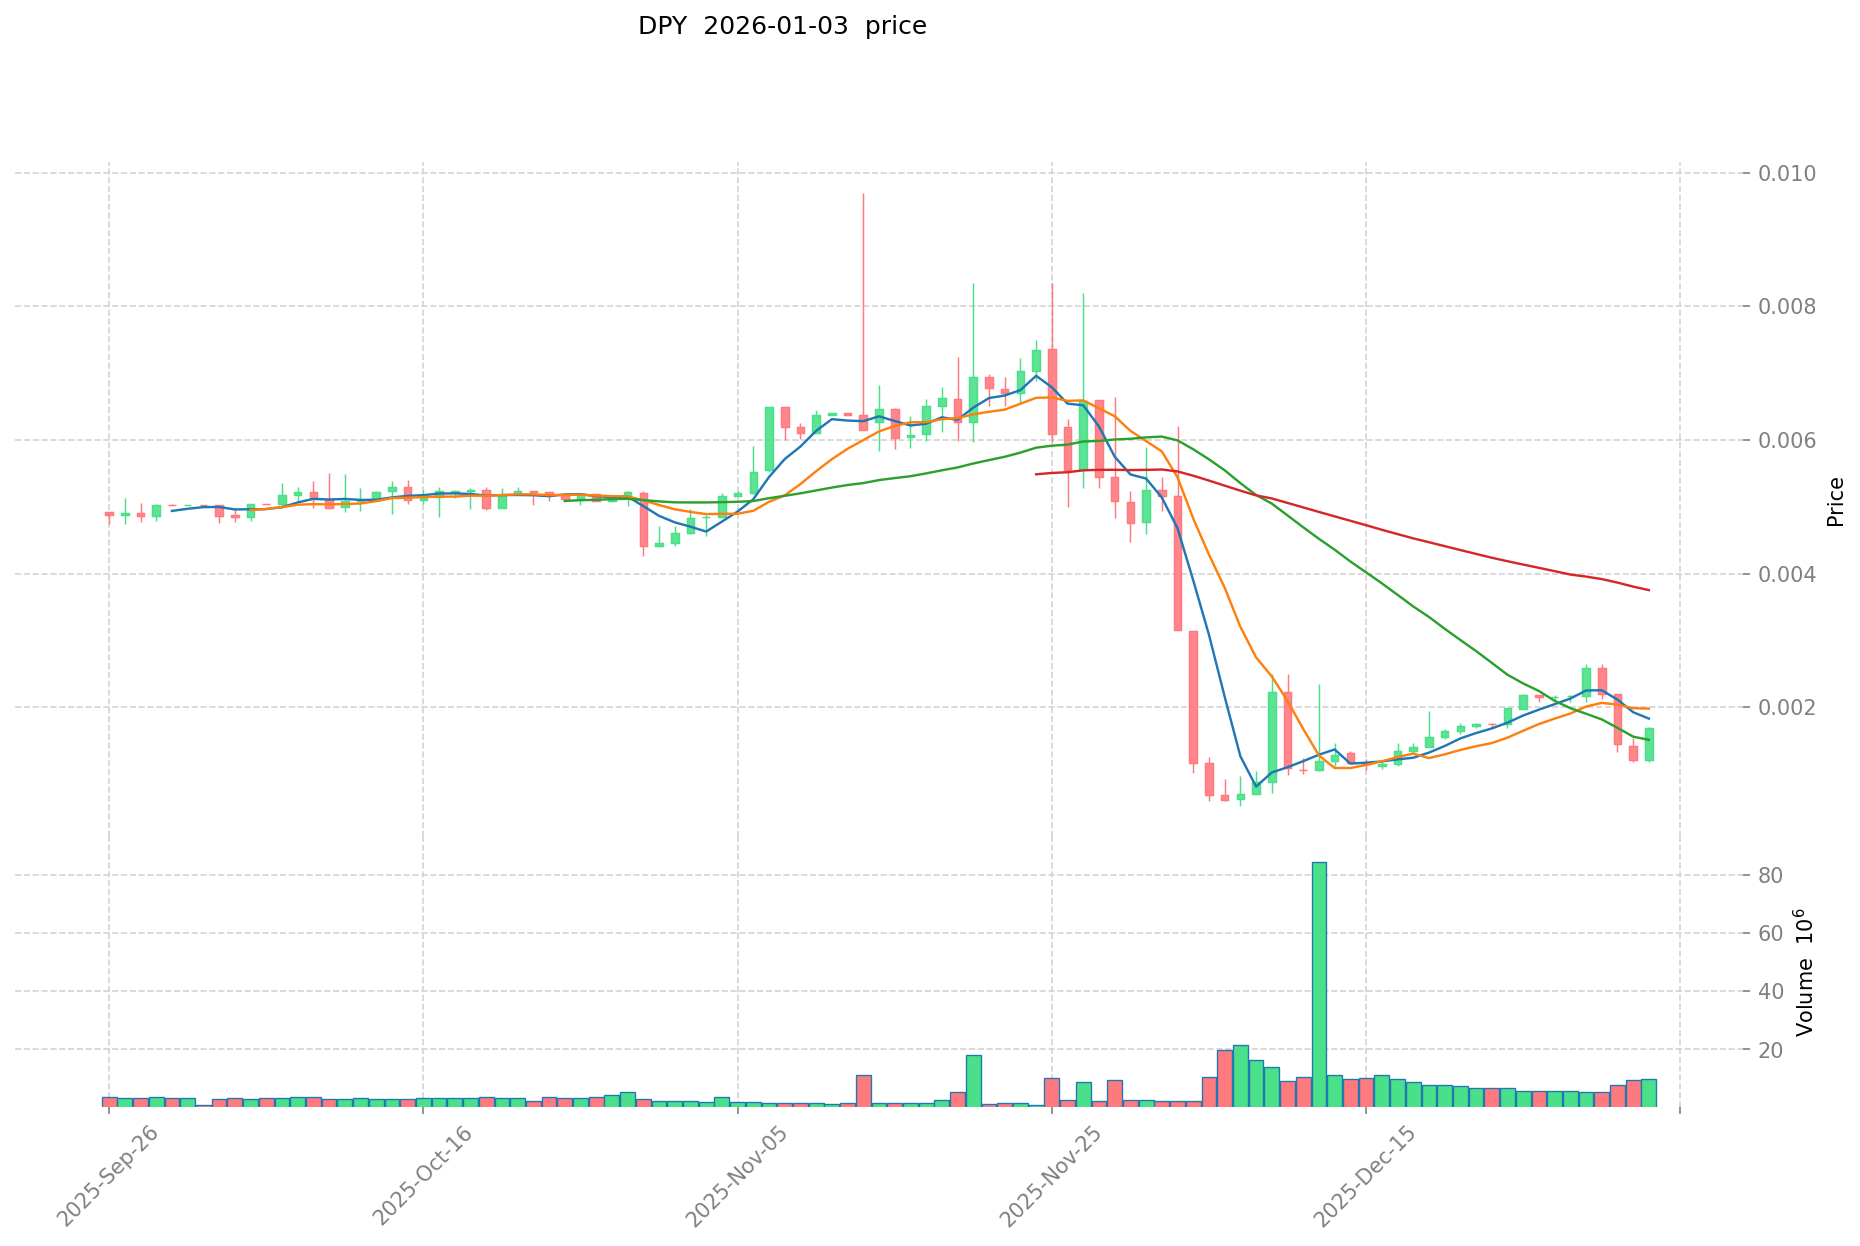
- December 7, 2025: DPY declined to its all-time low of $0.00052106, reflecting prolonged market contraction in smaller-cap prediction market tokens.
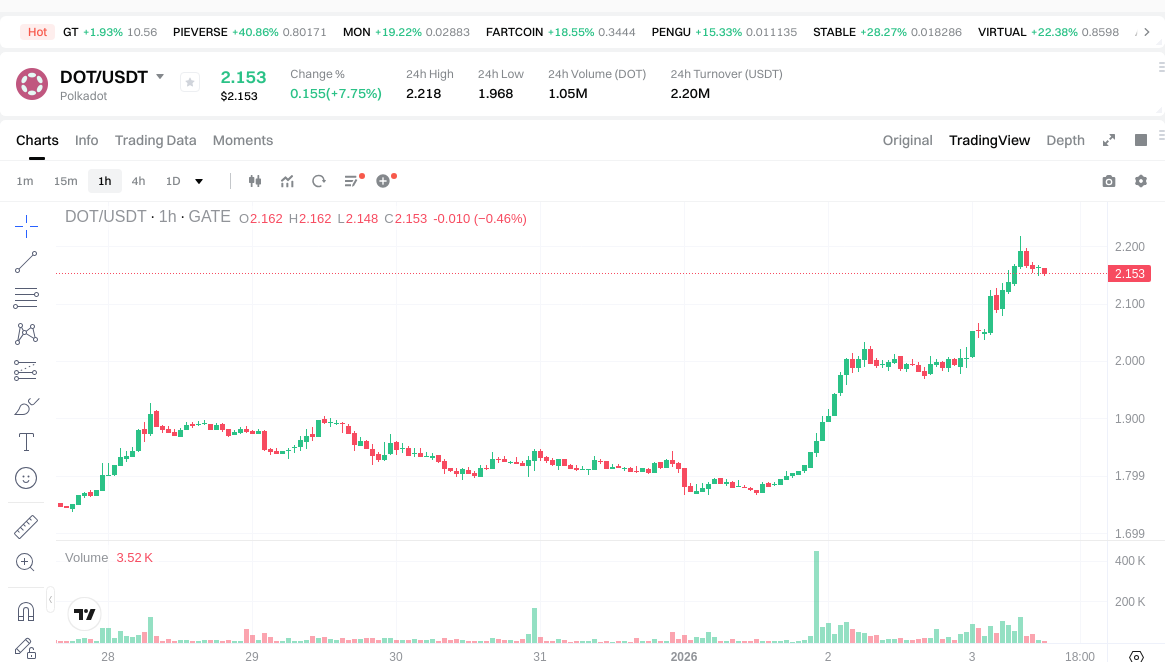
- December 26, 2025: DOT reached its recent low of $1.66, representing a 96.98% decline from its 2021 peak amid broader cryptocurrency market fluctuations.
- Comparative Analysis: Over the eight-year period from January 2018 to the present, DPY experienced a 99.97% decline from its historical high, while DOT has maintained stronger long-term market presence despite a 96.98% correction from its peak. DPY's volatility and market depth remain significantly lower compared to DOT's institutional adoption and ecosystem development.
Current Market Status (January 3, 2026)
- DPY Current Price: $0.0016616
- DOT Current Price: $2.166
- 24-hour Trading Volume: DPY $13,196.52 vs DOT $2,200,446.43
- Market Capitalization: DPY $166,160.00 (Rank #4894) vs DOT $3,576,998,022.66 (Rank #38)
- Circulating Supply: DPY 60,903,968.33 (60.90% of max supply) vs DOT 1,651,430,296.70 (100% of total supply)
- Cryptocurrency Fear & Greed Index: 29 (Fear).
Click to view real-time prices:
DPY vs DOT Investment Value Analysis
II. Core Factors Influencing DPY vs DOT Investment Value
Tokenomics Comparison
Based on available reference materials, specific tokenomics details for DPY are limited. However, DOT's supply structure is clearly documented:
- DOT: Underwent a token split in 2020, increasing total supply from 10 million to 100 billion DOT tokens. Current circulating supply stands at approximately 1,233,721,095 tokens with unlimited maximum supply.
- DPY: Limited detailed information available in reference materials regarding supply mechanisms.
📌 Historical Pattern: DOT's token split in 2020 initiated its first bull market cycle, with prices eventually peaking near $55. However, subsequent market cycles revealed that token supply adjustments alone cannot sustain long-term price momentum without ecosystem development and utility growth.
Institutional Adoption and Market Application
Institutional Holdings: DOT maintains a position in the top 14 cryptocurrencies by market capitalization, indicating institutional awareness, though reference materials suggest currently weaker performance compared to emerging alternatives.
Enterprise Adoption: DOT's primary functions center on staking and governance, with slot auctions representing a distinguishing feature within the Polkadot ecosystem. However, ecosystem utilization appears limited relative to competitors.
Regulatory Environment: DOT benefits from a relatively moderate regulatory stance. The SEC's published securities asset list does not include DOT, potentially allowing the project more operational latitude compared to higher-profile cryptocurrencies facing increased regulatory scrutiny.
Technical Development and Ecosystem Construction
DOT Technical Status: The Polkadot network was founded by Gavin Wood, former Ethereum CTO, with initial objectives addressing Ethereum's limitations. However, cross-chain technology has advanced significantly over the past two years, eroding DOT's early technological differentiation.
Ecosystem Comparison: The Polkadot ecosystem demonstrates weakness across critical metrics:
- DeFi applications: Major DEFi projects are rarely found on Polkadot according to mainstream tracking platforms like DefiLlama
- NFT development: Minimal presence in NFT and emerging blockchain applications
- User interface: Mainstream wallets like MetaMask significantly outperform Polkadot's native JS wallet in convenience and functionality
Adoption Challenges: In an environment where public blockchain projects and tokens proliferate while user growth remains stagnant, Polkadot faces difficulties attracting and retaining users compared to established competitors with more comprehensive ecosystems.
Macroeconomic Conditions and Market Cycles
Inflationary Environment Performance: Available reference materials do not provide sufficient comparative data on DPY and DOT's inflation-hedging properties.
Monetary Policy Impact: DOT's price trends historically aligned with major cryptocurrencies (BTC, ETH) during the early bull market phase. However, divergence emerged during subsequent bear markets, with DOT entering a prolonged downtrend over the past two years characterized by weak recovery attempts and continuous new lows as of late 2025.
Trend Analysis: Technical analysis indicates continuous downtrend formation since August 2023, with downtrend resistance positioned near $5.50. Market conditions suggest sustained bottom-testing will continue until the broader cryptocurrency market enters a new bull cycle, after which DOT is unlikely to outperform market averages.
III. 2026-2031 Price Forecast: DPY vs DOT
Short-term Forecast (2026)
- DPY: Conservative $0.001477-$0.002374 | Optimistic $0.001660-$0.002374
- DOT: Conservative $1.7264-$3.1723 | Optimistic $2.1581-$3.1723
Mid-term Forecast (2027-2029)
- DPY may enter consolidation phase, estimated price range $0.001432-$0.002969
- DOT may enter growth phase, estimated price range $2.1055-$4.5096
- Key drivers: institutional capital inflows, ETF adoption, ecosystem development
Long-term Forecast (2030-2031)
- DPY: Base scenario $0.001561-$0.003498 | Optimistic scenario $0.002645-$0.003498
- DOT: Base scenario $3.3546-$4.8507 | Optimistic scenario $3.9760-$4.6340
View detailed price predictions for DPY and DOT
DPY:
| 年份 |
预测最高价 |
预测平均价格 |
预测最低价 |
涨跌幅 |
| 2026 |
0.002373514 |
0.0016598 |
0.001477222 |
0 |
| 2027 |
0.00227882241 |
0.002016657 |
0.00143182647 |
21 |
| 2028 |
0.0029638807929 |
0.002147739705 |
0.00199739792565 |
29 |
| 2029 |
0.002734716966376 |
0.00255581024895 |
0.002274671121565 |
53 |
| 2030 |
0.002777526788046 |
0.002645263607663 |
0.001560705528521 |
59 |
| 2031 |
0.003497699805232 |
0.002711395197854 |
0.001789520830584 |
63 |
DOT:
| 年份 |
预测最高价 |
预测平均价格 |
预测最低价 |
涨跌幅 |
| 2026 |
3.17226 |
2.158 |
1.7264 |
0 |
| 2027 |
3.6512281 |
2.66513 |
2.1054527 |
23 |
| 2028 |
3.726651279 |
3.15817905 |
1.768580268 |
45 |
| 2029 |
4.509563865495 |
3.4424151645 |
3.063749496405 |
58 |
| 2030 |
4.85070720829695 |
3.9759895149975 |
3.379591087747875 |
83 |
| 2031 |
4.634015779729586 |
4.413348361647225 |
3.354144754851891 |
103 |
四、投资策略对比:DPY vs DOT
长期 vs 短期投资策略
- DPY:适合关注预测市场生态发展、寻求超高风险高回报机会的投资者,但需承受极高的流动性风险和市场深度不足的挑战
- DOT:适合寻求相对稳定、具有机构认可度的跨链生态投资者,同时期望参与生态治理和质押收益的中长期持有者
风险管理与资产配置
- 保守型投资者:DPY 0% vs DOT 5-10%(DOT 作为补充配置,不建议持有 DPY)
- 激进型投资者:DPY 5-15% vs DOT 15-25%(DPY 仅作为高风险仓位探索,DOT 可作为主要持仓)
- 对冲工具:稳定币配置占比 50-70%、通过 DOT 质押获得 8-12% 年化收益、跨币种组合降低单一资产风险
五、潜在风险对比
市场风险
- DPY:极低流动性(日交易量 $13,196.52)导致价格操纵风险高企,市值仅 $166,160,任何大额交易都可能引发极端价格波动;八年间下跌 99.97%,反映市场认可度严重不足
- DOT:虽然具有更强市场流动性(日交易量 $2,200,446.43),但自 2021 年高点跌幅达 96.98%,面临长期持续下行压力,技术分析显示下行通道仍未突破
技术风险
- DPY:预测市场平台的智能合约风险、预言机数据可靠性风险、用户参与度持续下降导致的生态衰退风险
- DOT:跨链桥接技术的安全风险、验证者节点的中心化风险、生态应用匮乏(DeFi 和 NFT 应用严重不足)导致的技术优势难以转化为用户价值
监管风险
- 全球监管环境:DOT 因未被 SEC 列入证券资产清单,面临的直接监管风险相对较低;DPY 作为预测市场代币,在博彩相关严格的司法管辖区可能面临更高的监管不确定性
六、结论:Which Is the Better Buy?
📌 投资价值总结:
- DPY 优势:预测市场作为新兴细分赛道的探索价值;极低的绝对价格可能吸引散户投机;若生态重振可能带来倍数级回报
- DOT 优势:由以太坊 CTO 创立、具有坚实技术背景;市值排名前 40、机构认可度相对较高;质押机制提供持有收益;相对 DPY 具有更强市场流动性和生态基础
✅ 投资建议:
- 新手投资者:建议优先选择 DOT,其市场认可度、流动性和生态基础相对健全,降低学习成本和风险暴露;DPY 暂不推荐涉及
- 有经验投资者:DOT 可作为核心持仓配置 15-25%,以获得生态参与和质押收益;DPY 仅可作为 5% 以内的高风险探索配置,需严格止损
- 机构投资者:DOT 符合机构风险偏好,可考虑通过质押、跨币种对冲等方式优化收益;DPY 流动性不足,不建议大额机构配置
⚠️ 风险提示:加密货币市场波动性极高,DPY 和 DOT 均存在显著下行风险。参考数据显示 DPY 已跌幅 99.97%、DOT 跌幅 96.98%,两者均处于高风险状态。本文不构成投资建议,投资者应根据自身风险承受能力、投资周期和资产配置需求谨慎决策。
FAQ
DPY和DOT分别是什么?各自的主要用途是什么?
DPY和DOT是Web3生态中的加密资产。DPY主要用于去中心化预测市场,提供价格预测和衍生品交易功能。DOT是Polkadot平行链生态的原生代币,用于治理、质押和跨链交互,推动多链互操作性发展。
DPY和DOT在技术架构上有什么区别?
DPY是静态只读模板,包含应用代码和配置,相当于蓝图;DOT是DPY的动态运行实例,启动后可读写。简言之,DPY是蓝图,DOT是运行中的实例。
DPY和DOT的生态应用场景分别是什么?哪个更成熟?
DPY主要应用于去中心化金融领域,提供金融基础设施服务。DOT作为Polkadot平台的原生代币,生态应用更加成熟,涵盖跨链互操作、平行链治理等多个场景,生态建设更加完善。
从投资角度看,DPY和DOT哪个更有潜力?风险分别是什么?
DOT潜力更大,拥有成熟生态与强社区支持,风险相对可控。DPY项目较新,上升空间大但波动风险较高。投资者应根据风险承受能力选择。
DPY和DOT的代币经济模型有什么不同?
DPY主要用于预测市场参与者的奖励激励,分配更加动态灵活;DOT用于Polkadot网络治理和交易,分配相对固定。两者经济模型和应用场景差异明显。
DPY和DOT在交易流动性、市值规模上的差异如何?
DOT拥有更大的市值规模和交易流动性,市场表现波动较大。DPY相对市值较小,交易流动性有限,但价格表现更为稳定。总体而言,DOT作为主流币种流动性明显优于DPY。
* The information is not intended to be and does not constitute financial advice or any other recommendation of any sort offered or endorsed by Gate.