# F3 vs UNI: A Comprehensive Comparison of Two Leading Decentralized Finance Protocols
## Article Overview
This comprehensive guide compares Friend3 (F3) and Uniswap (UNI) across critical investment dimensions including market capitalization, price performance, liquidity metrics, and ecosystem positioning. Designed for cryptocurrency investors ranging from beginners to institutions, the article analyzes two vastly different assets—an emerging Web3 social dApp versus a mature DeFi infrastructure leader. Through detailed price history analysis, tokenomics comparison, and risk assessment, readers gain actionable insights to determine which protocol aligns with their investment strategy. The article concludes with specific recommendations: UNI for conservative investors seeking stable infrastructure exposure, and F3 for experienced traders targeting high-risk growth opportunities in emerging social finance applications.
Introduction: F3 vs UNI Investment Comparison
In the cryptocurrency market, the comparison between Friend3 (F3) and Uniswap (UNI) represents an interesting case study for investors. Two assets operating at vastly different scales and market positions, they showcase distinct valuations, use cases, and performance trajectories within the Web3 ecosystem.
Friend3 (F3): Launched in November 2023, Friend3 has positioned itself as a leading social dApp where users can make friends and generate profits within the Web3 world. Operating on the BSC network, it reflects the emerging category of social-focused blockchain applications.
Uniswap (UNI): Since its launch in September 2020, Uniswap has established itself as the first automatic market maker (AMM) protocol on Ethereum, becoming one of the most critical infrastructure components in decentralized finance. With a market cap ranking of 34 and billions in trading volume, UNI represents the mature DeFi segment.
This article will comprehensively analyze the investment value comparison between F3 and UNI across multiple dimensions including market capitalization trajectories, price performance, liquidity metrics, market positioning, and ecosystem significance, while addressing the core question investors face:
"Which presents a more compelling investment opportunity given current market conditions?"
Friend3 (F3) vs Uniswap (UNI): Price History and Market Comparison
I. Historical Price Comparison and Current Market Status
Friend3 (F3) and Uniswap (UNI) Historical Price Trends
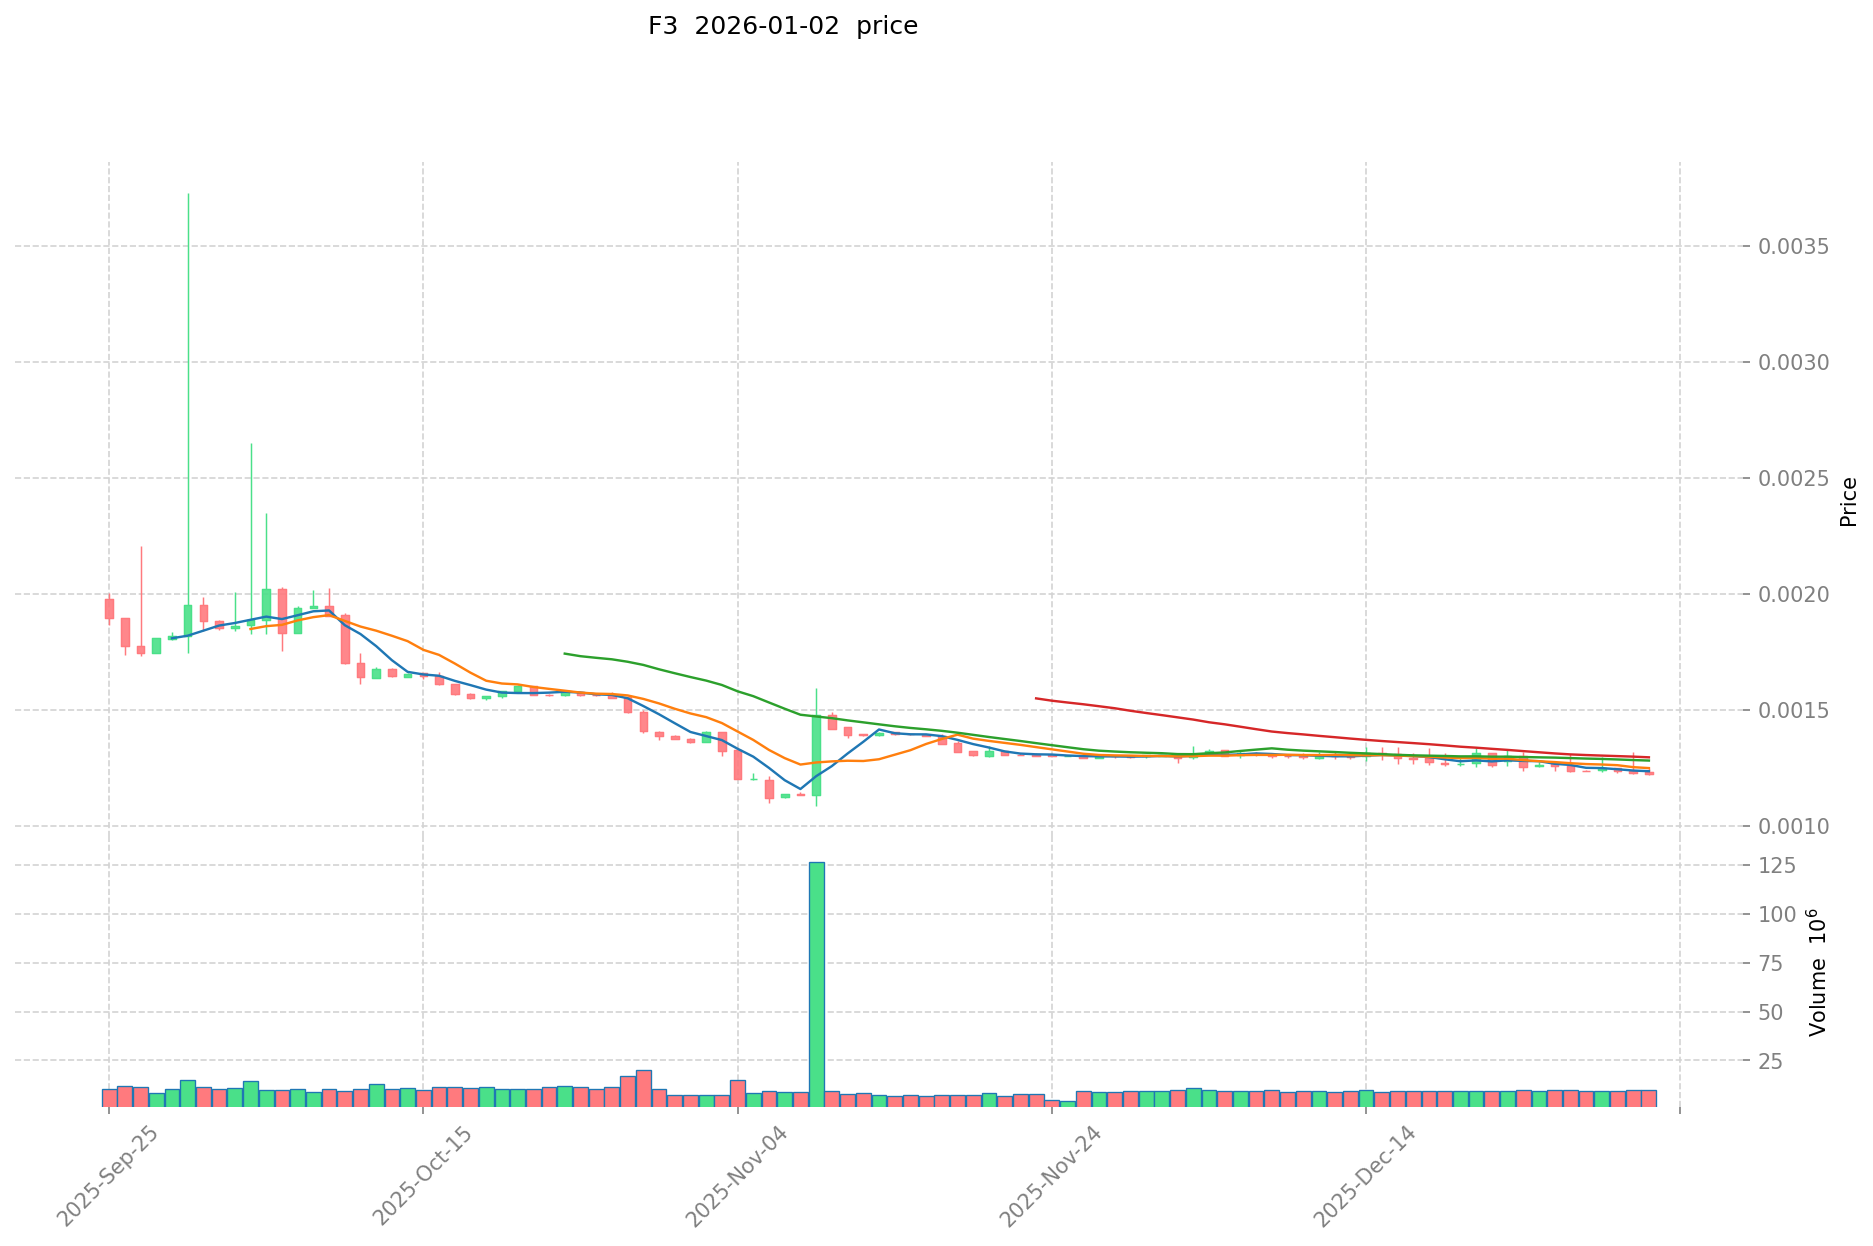
- November 2023: Friend3 reached its all-time high of $0.29 due to initial market enthusiasm for the Web3 social platform.
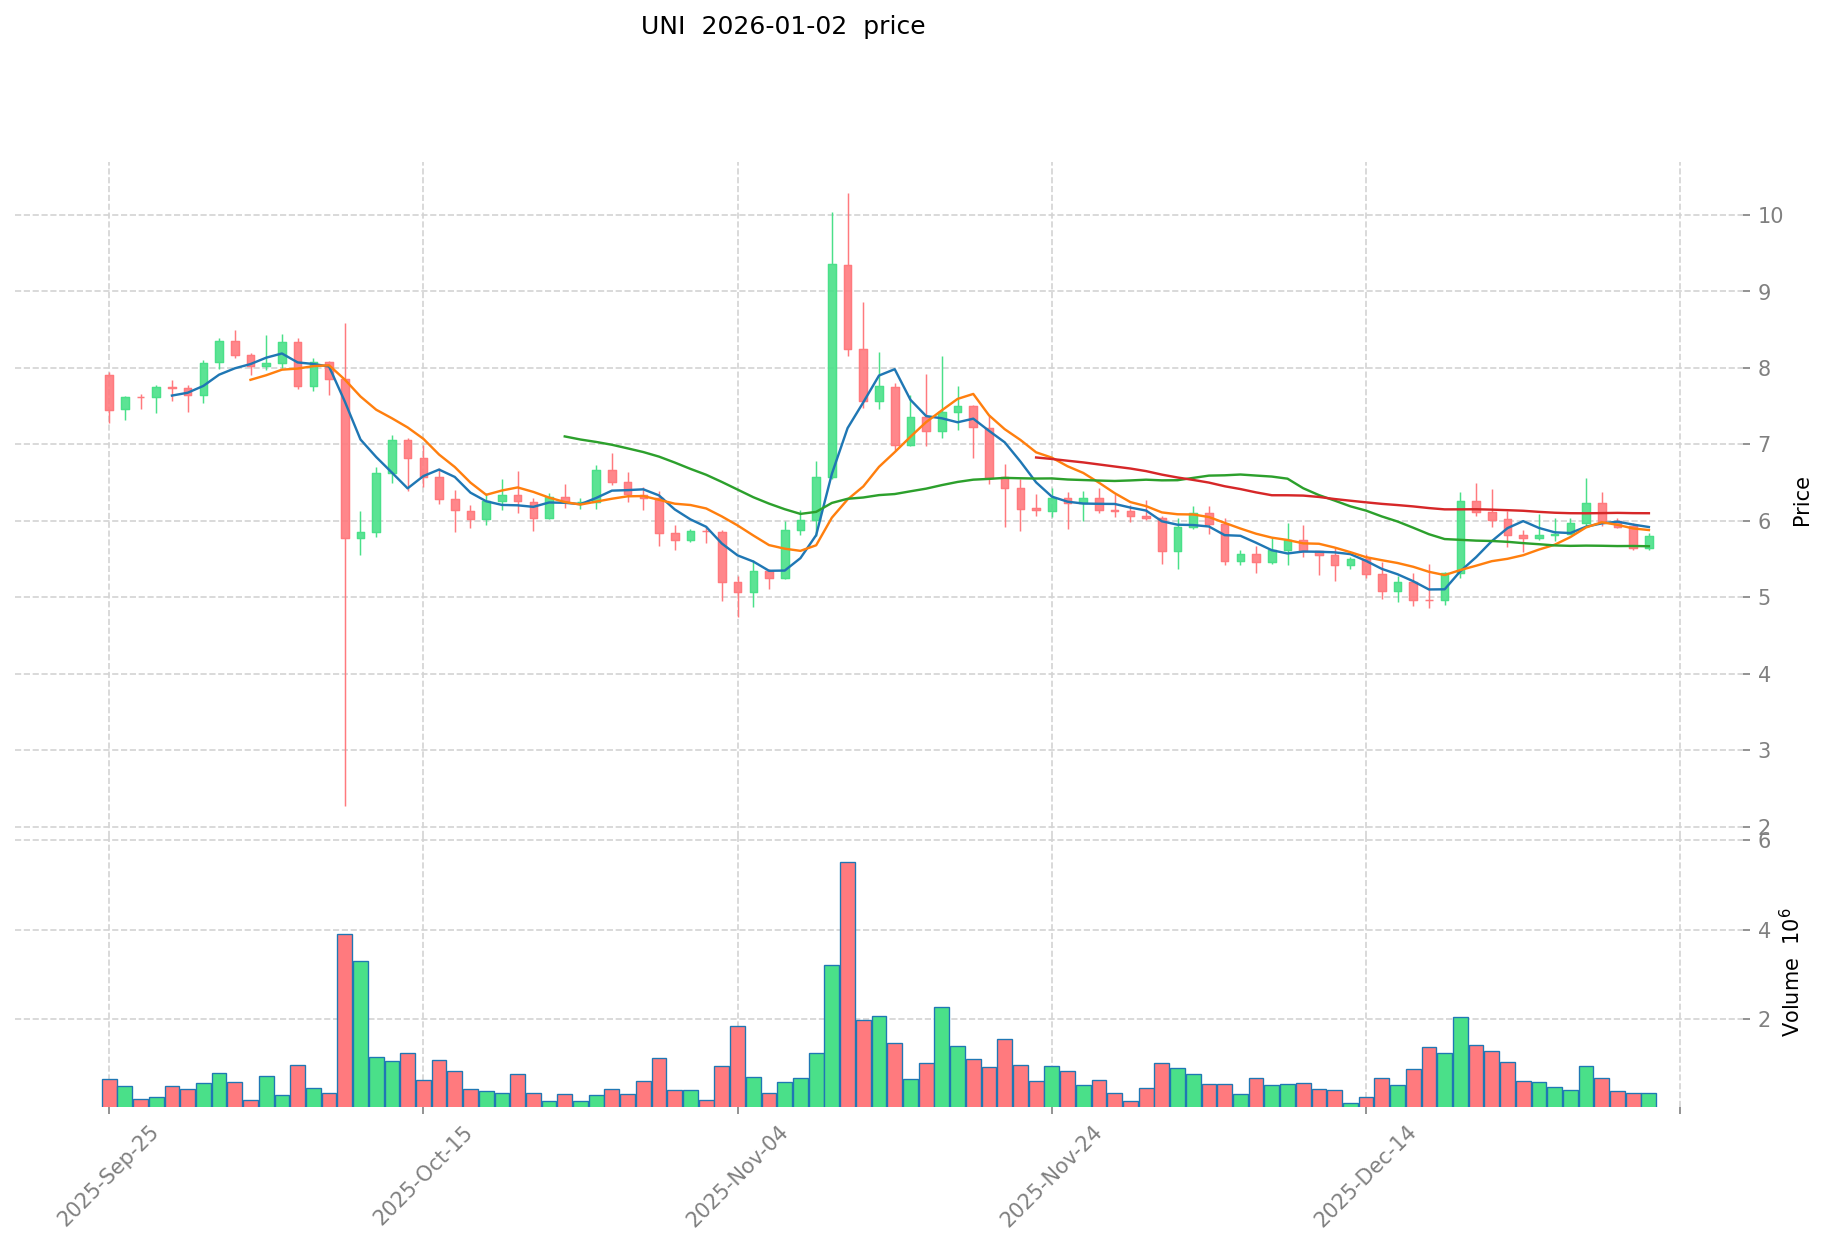
- September 2020: Uniswap achieved its all-time high of $44.92 following its launch and rapid adoption as the leading decentralized exchange protocol on Ethereum.
- Comparative Analysis: Friend3 has declined from its $0.29 peak in November 2023 to $0.001226 in January 2026, representing an 84.66% decline over one year. In comparison, Uniswap has fallen from $44.92 (May 2021) to $5.801 in January 2026, though it maintains significantly higher market valuations and liquidity.
Current Market Status (02 January 2026)
- Friend3 current price: $0.001226
- Uniswap current price: $5.801
- 24-hour trading volume: Friend3 $11,984.34 vs Uniswap $1,973,956.07
- Market Sentiment Index (Fear & Greed Index): 20 (Extreme Fear)
View real-time prices:
II. Market Capitalization and Supply Analysis
Fully Diluted Valuation (FDV) Comparison
- Friend3 FDV: $1,226,000.00 with 1 billion maximum supply.
- Uniswap FDV: $5,220,426,754.64 with 1 billion maximum supply.
- Market dominance: Friend3 holds 0.000038% of the total cryptocurrency market, while Uniswap commands 0.16%.
Circulating Supply Metrics
- Friend3 circulating supply: 135,250,000 tokens (13.525% of max supply).
- Uniswap circulating supply: 629,823,794 tokens (62.98% of max supply).
- Current holders: Friend3 has 16,480 token holders, while Uniswap has 386,805 holders.
Short-term Price Movement
| Time Period |
Friend3 Change |
Uniswap Change |
| 1 Hour |
+0.0010% |
-0.26% |
| 24 Hours |
-0.81% |
+2.88% |
| 7 Days |
-3.32% |
-0.15% |
| 30 Days |
-5.56% |
-1.89% |
| 1 Year |
-84.66% |
-57.38% |
24-Hour Price Range
- Friend3: $0.001219 (low) to $0.001247 (high).
- Uniswap: $5.62 (low) to $5.842 (high).
IV. Protocol and Blockchain Specifications
Friend3 Technical Details
- Blockchain: Binance Smart Chain (BEP-20).
- Contract Address: 0x9e57e83ad79ac5312ba82940ba037ed30600e167.
- Project Description: Friend3 is a leading social dApp where anyone can make friends and profits in the Web3 world.
- Launch Date: 28 November 2023.
Uniswap Technical Details
- Blockchain: Ethereum (ERC-20).
- Contract Address: 0x1f9840a85d5af5bf1d1762f925bdaddc4201f984.
- Project Description: Uniswap is the first automatic market making transaction protocol based on Ethereum blockchain.
- Launch Date: 17 September 2020.
V. Trading and Liquidity Analysis
Exchange Presence
- Friend3: Listed on 1 exchange with active trading.
- Uniswap: Listed on 63 exchanges with broad market access.
Market Cap and Trading Volumes
- Friend3 market cap: $165,816.50 (based on circulating supply).
- Uniswap market cap: $3,653,607,829.28 (based on circulating supply).
- Volume-to-market-cap ratio indicates significantly higher liquidity and trading activity for Uniswap.
Friend3 Official Channels
Uniswap Official Channels
VII. Risk Factors and Market Context
Volatility Assessment
- Friend3 exhibits extreme volatility with an 84.66% annual decline, indicating significant market risk and reduced investor confidence.
- Uniswap shows more moderate volatility with a 57.38% annual decline, reflecting established protocol status with broader adoption and ecosystem integration.
Market Sentiment Implications
The current Crypto Fear & Greed Index reading of 20 (Extreme Fear) suggests heightened market risk aversion across the cryptocurrency sector. Both assets are affected by broader market pessimism, though established protocols like Uniswap typically demonstrate greater resilience during fear-driven market cycles.
二、影响 F3 vs UNI 投资价值的核心因素
供应机制对比(Tokenomics)
根据参考资料提供的信息,相关文档中未提供 F3 和 UNI 具体的供应机制、通缩模型或减半机制的详细说明。该段落内容无法基于可用资料进行填充。
机构采用与市场应用
参考资料中涉及的 F3 和 UNI 的机构持仓情况、企业采用案例、跨境支付应用及不同国家监管态度的具体信息缺失。相关数据和分析无法从提供的文献中获取。
技术发展与生态建设
参考资料未包含 F3 和 UNI 在技术升级、DeFi、NFT、支付、智能合约等生态应用方面的具体信息。该部分内容无法基于当前资料进行补充。
宏观经济与市场周期
参考资料未提供关于 F3 和 UNI 在通胀环境下的表现、抗通胀属性、对利率变化和美元指数的敏感性,以及地缘政治因素影响的相关分析。相应信息不在提供的文献范围内。
III. 2026-2031 Price Forecast: F3 vs UNI
Short-term Forecast (2026)
- F3: Conservative $0.001165–$0.001226 | Optimistic $0.001398–$0.001226
- UNI: Conservative $4.861–$5.787 | Optimistic $7.812–$5.787
Medium-term Forecast (2028-2029)
- F3 may enter growth consolidation phase, expected price range $0.001450–$0.001913
- UNI may enter strong rally phase, expected price range $3.802–$11.182
- Key drivers: institutional capital inflows, ETF adoption, ecosystem development
Long-term Forecast (2030-2031)
- F3: Base case $0.001715–$0.002149 | Optimistic case $0.001472–$0.002178
- UNI: Base case $4.912–$14.080 | Optimistic case $8.468–$14.080
View detailed price forecast for F3 and UNI
F3:
| 年份 |
预测最高价 |
预测平均价格 |
预测最低价 |
涨跌幅 |
| 2026 |
0.00139764 |
0.001226 |
0.0011647 |
0 |
| 2027 |
0.0018759026 |
0.00131182 |
0.0012331108 |
7 |
| 2028 |
0.00191263356 |
0.0015938613 |
0.001450413783 |
30 |
| 2029 |
0.0020162345445 |
0.00175324743 |
0.0015428577384 |
43 |
| 2030 |
0.002148604725465 |
0.00188474098725 |
0.001715114298397 |
53 |
| 2031 |
0.002178006684866 |
0.002016672856357 |
0.00147217118514 |
64 |
UNI:
| 年份 |
预测最高价 |
预测平均价格 |
预测最低价 |
涨跌幅 |
| 2026 |
7.81245 |
5.787 |
4.86108 |
0 |
| 2027 |
7.54769475 |
6.799725 |
4.4878185 |
17 |
| 2028 |
8.24976635625 |
7.173709875 |
3.80206623375 |
23 |
| 2029 |
11.18202026765625 |
7.711738115625 |
4.39569072590625 |
32 |
| 2030 |
10.958379862303125 |
9.446879191640625 |
4.912377179653125 |
62 |
| 2031 |
14.079628747221187 |
10.202629526971875 |
8.468182507386656 |
75 |
四、投资策略对比:F3 vs UNI
长期 vs 短期投资策略
- F3:适合关注Web3社交应用前景、能承受极高波动的风险偏好投资者,短期交易风险极高,长期需等待生态发展验证
- UNI:适合寻求成熟DeFi基础设施敞口、追求相对稳定且流动性充足的投资者,可作为长期战略配置资产
风险管理与资产配置
- 保守型投资者:F3 0% vs UNI 3-5%
- 激进型投资者:F3 5-10% vs UNI 15-20%
- 对冲工具:稳定币配置、多链资产分散、期权风险管理
五、潜在风险对比
市场风险
- F3:极端波动性(年度跌幅84.66%)、流动性极度匮乏(24小时交易量仅11,984.34美元)、单一交易所风险、市场认可度低
- UNI:中等波动性(年度跌幅57.38%)、市场恐惧情绪蔓延(恐惧指数20)、DeFi生态系统性风险
技术风险
- F3:BSC网络依赖、社交dApp模式未经充分验证、用户留存率不确定、智能合约审计记录缺失
- UNI:Ethereum网络拥塞、Gas费用变动、MEV风险、跨链扩展方案复杂度
监管风险
- 全球监管政策对两者的不同影响:F3作为社交应用面临内容合规风险,UNI作为交易基础设施面临更严格的金融监管,两者均受加密资产监管不确定性影响
六、结论:Which Is the Better Buy?
📌 投资价值总结:
- F3优势:极低入场成本、长期价格预测显示64%增长潜力(2026-2031)、新兴Web3社交赛道
- UNI优势:成熟DeFi基础设施、全球62个交易所流动性、38.6万持有者生态基础、长期预测75%增长潜力、年化交易量数十亿美元规模
✅ 投资建议:
- 新手投资者:优先选择UNI,流动性充足、信息透明度高、风险相对可控
- 有经验投资者:可在投资组合中配置少量F3进行高风险博弈,主仓位保持UNI获取稳定收益
- 机构投资者:UNI为唯一合适选择,具备充足的交易深度、规范的治理结构、成熟的生态地位
⚠️ 风险提示:加密货币市场波动性极高,当前恐惧指数处于极度恐惧水平(20),F3面临流动性枯竭风险,UNI虽相对稳健但年度跌幅仍达57.38%,本文不构成投资建议。
FAQ
F3和UNI分别是什么?有什么区别?
F3是新兴的去中心化平台,专注于社区治理和生态发展。UNI是成熟的自动做市商(AMM)协议,拥有庞大的交易额和用户基础。两者主要区别在于定位不同,UNI更成熟稳定,F3增长潜力更大。
F3和UNI在交易费用和滑点方面有什么差异?
F3通常提供更低的交易费用和更小的滑点,适合频繁交易者。UNI作为老牌DEX,交易费用相对较高,滑点取决于流动性深度。具体费率建议查看官方数据。
F3和UNI的流动性挖矿收益率如何对比?
F3流动性挖矿年化收益率为3-5%,与UNI相近。UNI收益率较为稳定,但F3具体收益需实时查询,两者收益因市场波动会有差异。
F3和UNI哪个更安全?审计情况和风险如何?
UNI具有更完善的安全审计体系和合规框架,经过多轮独立审计认证。F3安全性取决于具体实现,建议查看其官方审计报告。总体而言,UNI风险相对可控,F3需进一步评估。
F3和UNI在不同区块链上的部署和生态支持有什么区别?
F3主要聚焦于金融生态,在多条公链部署具有强大DeFi支持。UNI则以DEX和智能合约生态见长,在以太坊及Layer2生态中优势明显。两者部署广度和生态侧重点存在差异。
作为投资者,应该如何选择F3还是UNI?
F3专注金融科技领域,UNI覆盖更广泛的技术应用。选择应基于你的投资偏好:若看好金融创新选F3,若看好去中心化生态选UNI。两者都具备长期增长潜力。
* The information is not intended to be and does not constitute financial advice or any other recommendation of any sort offered or endorsed by Gate.


