The article "ING vs ENJ: The Battle of Digital Asset Platforms in the Metaverse Era" offers an in-depth comparison of Infinity Games (ING) and Enjin Coin (ENJ). It examines their investment value through historical price trends, tokenomics, institutional adoption, and technological ecosystems. Aimed at investors, it answers crucial questions about which asset presents a better buying opportunity. The article is structured to provide a comprehensive understanding of both cryptocurrencies' market performance, risk factors, and future potential, making it essential reading for both novice and experienced investors. For up-to-date price information, visit Gate.
Introduction: ING vs ENJ Investment Comparison
In the cryptocurrency market, the comparison between Infinity Games (ING) vs Enjin Coin (ENJ) has always been a topic that investors can't ignore. The two not only have significant differences in market cap ranking, application scenarios, and price performance, but also represent different cryptocurrency asset positioning.
Infinity Games (ING): Since its launch, it has gained market recognition by providing opportunities for many game projects to run on various chains.
Enjin Coin (ENJ): Launched in 2017, it has been hailed as a leading platform for blockchain gaming, being one of the cryptocurrencies with the highest global trading volume and market capitalization in the gaming sector.
This article will comprehensively analyze the investment value comparison between ING and ENJ, focusing on historical price trends, supply mechanisms, institutional adoption, technological ecosystems, and future predictions, and attempt to answer the question that investors are most concerned about:
"Which is the better buy right now?"
I. Price History Comparison and Current Market Status
ING and ENJ Historical Price Trends
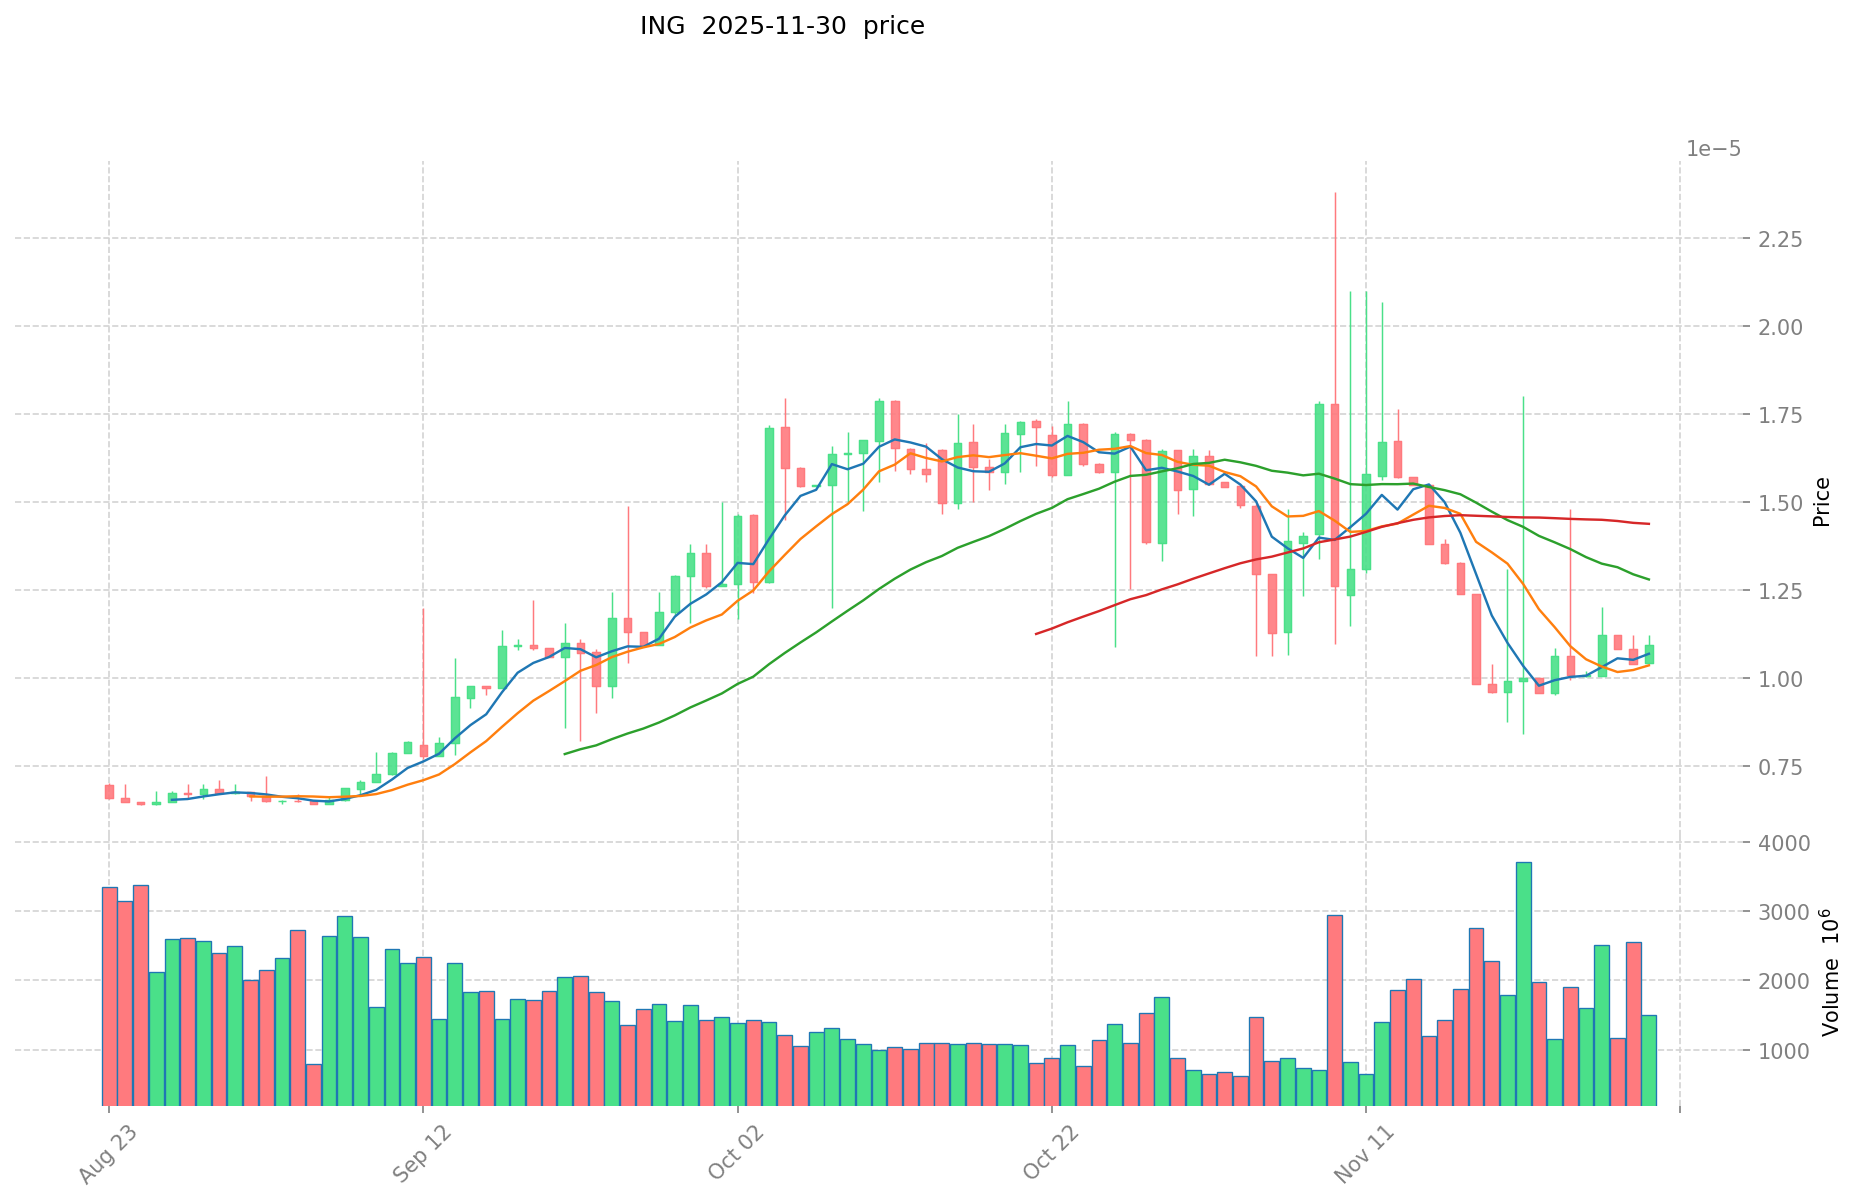
- 2025: ING reached its all-time low of $0.00000314 on June 27, 2025.
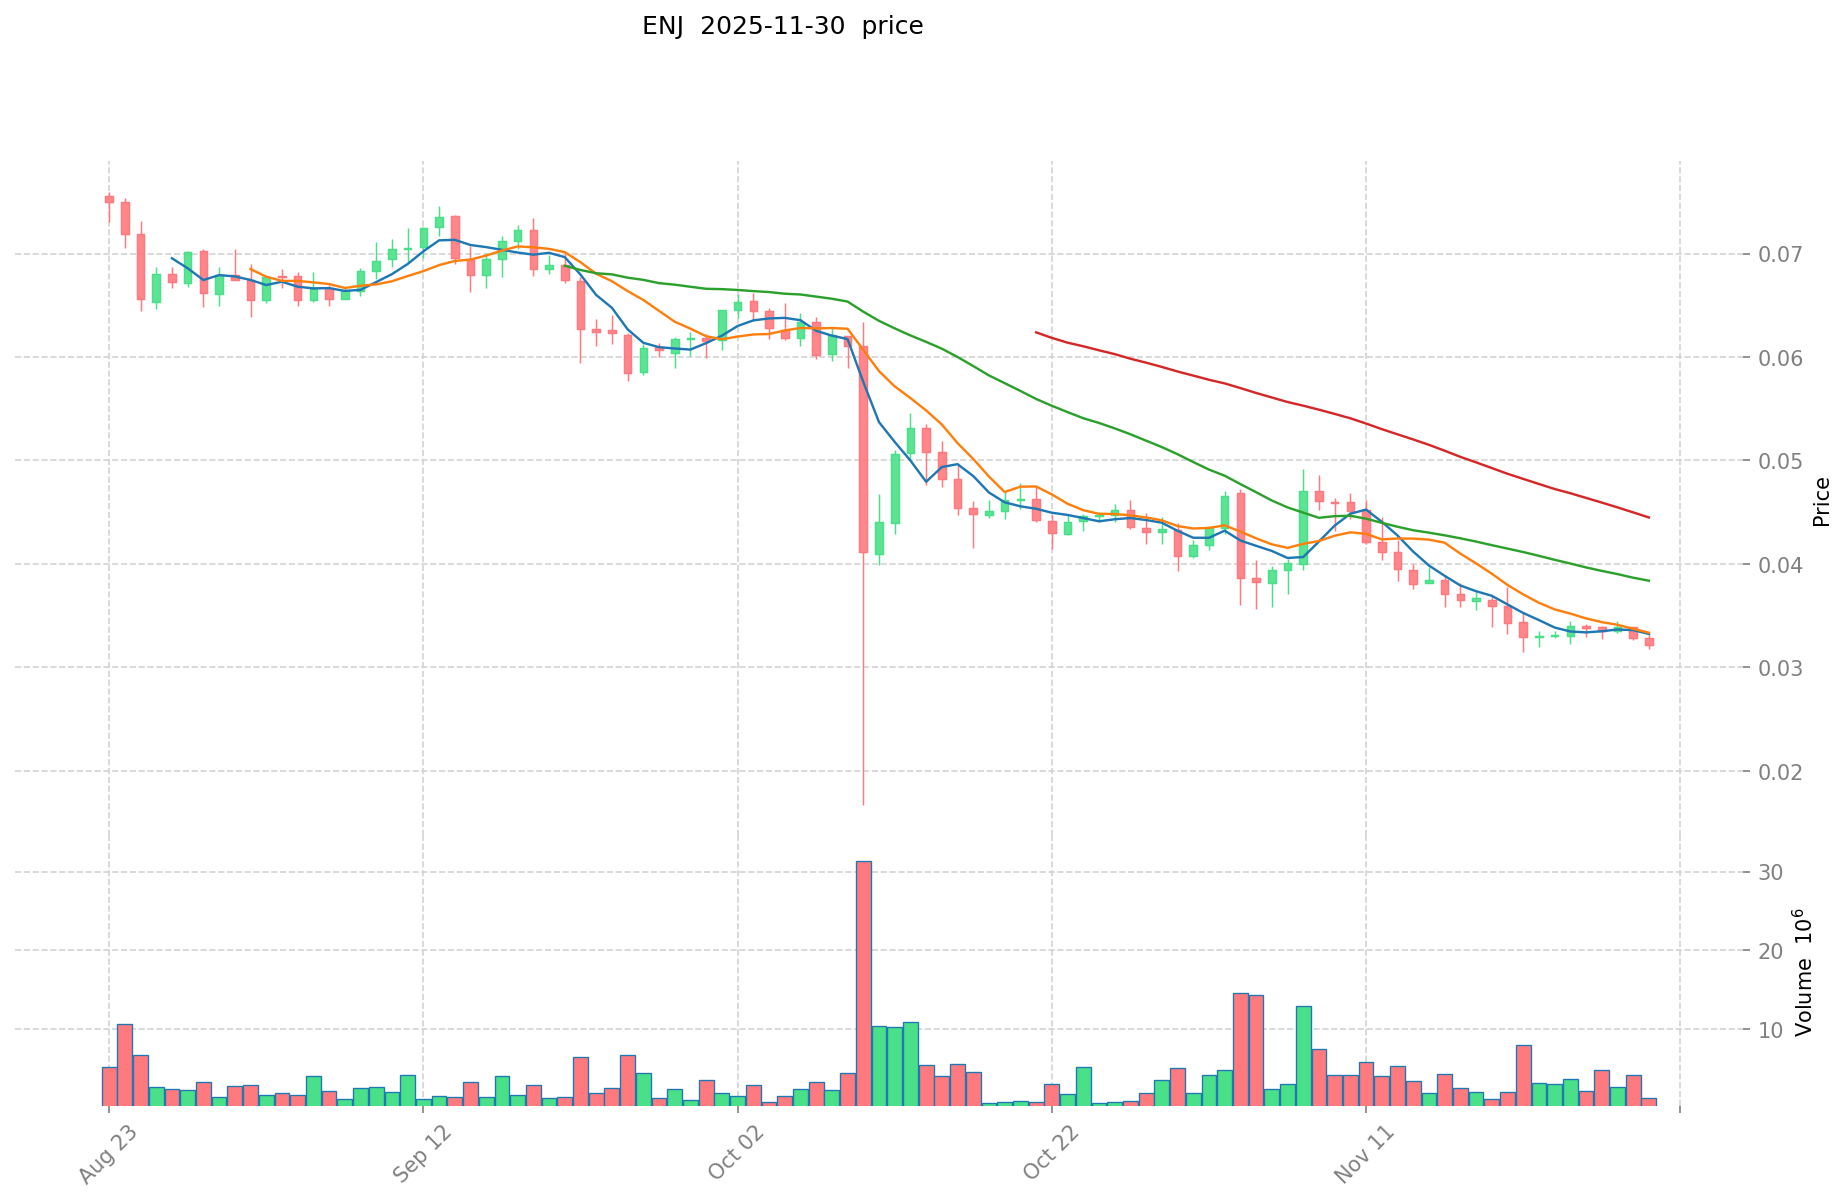
- 2021: ENJ reached its all-time high of $4.82 on November 25, 2021.
- Comparative analysis: Since their respective peaks, ING has dropped from $0.069273 to $0.00001089, while ENJ has fallen from $4.82 to $0.03188.
Current Market Situation (2025-11-30)
- ING current price: $0.00001089
- ENJ current price: $0.03188
- 24-hour trading volume: $11,694.50 (ING) vs $37,152.19 (ENJ)
- Market Sentiment Index (Fear & Greed Index): 28 (Fear)
Click to view real-time prices:
- View ING current price Market Price
- View ENJ current price Market Price
II. Key Factors Affecting ING vs ENJ Investment Value
Supply Mechanism Comparison (Tokenomics)
- ING: Fixed supply of 1 billion tokens with no further minting
- ENJ: Deflationary model with token burning mechanism - ENJ gets locked into created assets and removed from circulation
- 📌 Historical pattern: ENJ's deflationary mechanism has historically created upward price pressure during periods of increased platform usage and asset creation.
Institutional Adoption and Market Applications
- Institutional holdings: ENJ has attracted more institutional interest due to its established position in the gaming NFT space
- Enterprise adoption: ENJ has partnerships with Samsung and Microsoft, while ING is focusing on emerging Web3 gaming applications
- Regulatory attitudes: Both tokens face similar regulatory scrutiny in gaming-related crypto assets, with ENJ having a longer compliance track record
Technical Development and Ecosystem Building
- ENJ technical upgrades: Efinity parachain on Polkadot providing scalability and lower gas fees for NFT transactions
- ING technical development: Focused on cross-chain compatibility and multiverse gaming applications
- Ecosystem comparison: ENJ has a more established ecosystem with over 250,000 gaming communities and numerous NFT marketplaces, while ING is building its presence in the decentralized gaming sector
Macroeconomic Factors and Market Cycles
- Inflation performance: ENJ's deflationary mechanism provides some theoretical hedge against inflation
- Monetary policy impact: Both tokens show correlation with broader crypto market responses to interest rate changes
- Geopolitical factors: Gaming tokens like ENJ and ING generally show less sensitivity to geopolitical tensions compared to payment-focused cryptocurrencies
III. 2025-2030 Price Prediction: ING vs ENJ
Short-term Prediction (2025)
- ING: Conservative $0.0000087288 - $0.000010911 | Optimistic $0.000010911 - $0.0000152754
- ENJ: Conservative $0.0210738 - $0.03193 | Optimistic $0.03193 - $0.0370388
Mid-term Prediction (2027)
- ING may enter a growth phase, with an estimated price range of $0.00000898717248 - $0.00001729349856
- ENJ may enter a steady growth phase, with an estimated price range of $0.03299467392 - $0.04734018432
- Key drivers: Institutional capital inflow, ETFs, ecosystem development
Long-term Prediction (2030)
- ING: Base scenario $0.000013236752646 - $0.000022435173977 | Optimistic scenario $0.000022435173977 - $0.00002961442965
- ENJ: Base scenario $0.024671139090324 - $0.048374782530048 | Optimistic scenario $0.048374782530048 - $0.057565991210757
View detailed price predictions for ING and ENJ
Disclaimer: The above predictions are based on historical data and market analysis. Cryptocurrency markets are highly volatile and subject to rapid changes. These projections should not be considered as financial advice or guarantees of future performance.
ING:
| 年份 |
预测最高价 |
预测平均价格 |
预测最低价 |
涨跌幅 |
| 2025 |
0.0000152754 |
0.000010911 |
0.0000087288 |
0 |
| 2026 |
0.000014140656 |
0.0000130932 |
0.000008903376 |
20 |
| 2027 |
0.00001729349856 |
0.000013616928 |
0.00000898717248 |
25 |
| 2028 |
0.000021173642193 |
0.00001545521328 |
0.000010664097163 |
41 |
| 2029 |
0.000026555920218 |
0.000018314427736 |
0.000011904378028 |
68 |
| 2030 |
0.00002961442965 |
0.000022435173977 |
0.000013236752646 |
106 |
ENJ:
| 年份 |
预测最高价 |
预测平均价格 |
预测最低价 |
涨跌幅 |
| 2025 |
0.0370388 |
0.03193 |
0.0210738 |
0 |
| 2026 |
0.037243152 |
0.0344844 |
0.03276018 |
8 |
| 2027 |
0.04734018432 |
0.035863776 |
0.03299467392 |
12 |
| 2028 |
0.0532505346048 |
0.04160198016 |
0.0241291484928 |
30 |
| 2029 |
0.049323307677696 |
0.0474262573824 |
0.02608444156032 |
48 |
| 2030 |
0.057565991210757 |
0.048374782530048 |
0.024671139090324 |
51 |
IV. Investment Strategy Comparison: ING vs ENJ
Long-term vs Short-term Investment Strategy
- ING: Suitable for investors focused on emerging Web3 gaming applications and cross-chain compatibility
- ENJ: Suitable for investors seeking established gaming NFT platforms with institutional partnerships
Risk Management and Asset Allocation
- Conservative investors: ING: 20% vs ENJ: 80%
- Aggressive investors: ING: 40% vs ENJ: 60%
- Hedging tools: Stablecoin allocation, options, cross-currency portfolios
V. Potential Risk Comparison
Market Risk
- ING: Higher volatility due to lower market cap and trading volume
- ENJ: Susceptible to broader gaming and NFT market trends
Technical Risk
- ING: Scalability, network stability
- ENJ: Efinity parachain adoption, smart contract vulnerabilities
Regulatory Risk
- Global regulatory policies may impact both tokens, with ENJ potentially having an advantage due to its longer compliance track record
VI. Conclusion: Which Is the Better Buy?
📌 Investment Value Summary:
- ING advantages: Focus on cross-chain compatibility, potential for growth in emerging Web3 gaming sector
- ENJ advantages: Established ecosystem, institutional partnerships, deflationary tokenomics
✅ Investment Advice:
- Novice investors: Consider ENJ for its more established market position and partnerships
- Experienced investors: Diversify between both, with a higher allocation to ENJ
- Institutional investors: Focus on ENJ due to its larger market cap and institutional adoption
⚠️ Risk Warning: The cryptocurrency market is highly volatile. This article does not constitute investment advice.
None
VII. FAQ
Q1: What are the main differences between ING and ENJ?
A: The main differences are:
- Market cap: ENJ has a larger market cap and higher trading volume
- Ecosystem: ENJ has a more established ecosystem with over 250,000 gaming communities
- Partnerships: ENJ has partnerships with major companies like Samsung and Microsoft
- Tokenomics: ENJ has a deflationary model, while ING has a fixed supply
- Focus: ENJ is focused on gaming NFTs, while ING is targeting emerging Web3 gaming applications
Q2: Which token has performed better historically?
A: ENJ has shown better historical performance. It reached an all-time high of $4.82 in November 2021, while ING's all-time high was $0.069273. Both have seen significant drops since their peaks, but ENJ has maintained a higher relative value.
Q3: What are the key factors affecting the investment value of these tokens?
A: Key factors include:
- Supply mechanisms (tokenomics)
- Institutional adoption and partnerships
- Technical development and ecosystem growth
- Macroeconomic factors and market cycles
- Regulatory environment
Q4: How do the future price predictions compare for ING and ENJ?
A: By 2030, predictions suggest:
- ING: Base scenario $0.000013236752646 - $0.000022435173977
- ENJ: Base scenario $0.024671139090324 - $0.048374782530048
ENJ is predicted to maintain a higher price point, but both tokens are expected to see growth.
Q5: Which token is considered a better buy for different types of investors?
A:
- Novice investors: ENJ is recommended due to its established market position
- Experienced investors: A diversified approach with both tokens, leaning more towards ENJ
- Institutional investors: ENJ is preferred due to its larger market cap and institutional adoption
Q6: What are the main risks associated with investing in ING and ENJ?
A: Main risks include:
- Market volatility
- Technical risks such as scalability and smart contract vulnerabilities
- Regulatory risks, especially in the gaming and NFT sectors
- Competition within the blockchain gaming industry
* The information is not intended to be and does not constitute financial advice or any other recommendation of any sort offered or endorsed by Gate.


