# Article Overview: Is Andromeda (ANDR) a Good Investment?
This comprehensive analysis evaluates Andromeda (ANDR), a decentralized Web3 Operating System token, examining its investment viability through performance metrics, market positioning, and risk assessment. The article addresses critical questions for cryptocurrency investors: current valuation ($0.000655, down 97.31% annually), liquidity constraints, and price forecasts through 2031. Structured across market fundamentals, historical price trends, technical analysis, and investment recommendations, this guide serves risk-tolerant traders and institutional investors seeking detailed ANDR exposure evaluation. Key findings indicate ANDR represents highly speculative micro-cap positioning with significant volatility, limited adoption, and uncertain recovery catalysts requiring minimal portfolio allocation (0-1% maximum).
Introduction: Andromeda (ANDR) Investment Position and Market Prospects
ANDR is a significant asset in the cryptocurrency sector. As the first true 100% on-chain, IBC-enabled decentralized Web3 Operating System (OS), it has garnered attention in the blockchain infrastructure space. As of January 2026, ANDR maintains a market capitalization of USD 655,000 with a circulating supply of approximately 241.14 million tokens, trading at around USD 0.000655 per token. With its positioning as a decentralized Web3 operating system designed to bring institutional-grade engineering, security, and UI/UX to the blockchain ecosystem, ANDR has become a focal point when investors consider the question "Is Andromeda (ANDR) a good investment?" This article provides a comprehensive analysis of ANDR's investment value, historical price trends, future price predictions, and associated investment risks to serve as a reference for investors.
Andromeda (ANDR) Cryptocurrency Asset Research Report
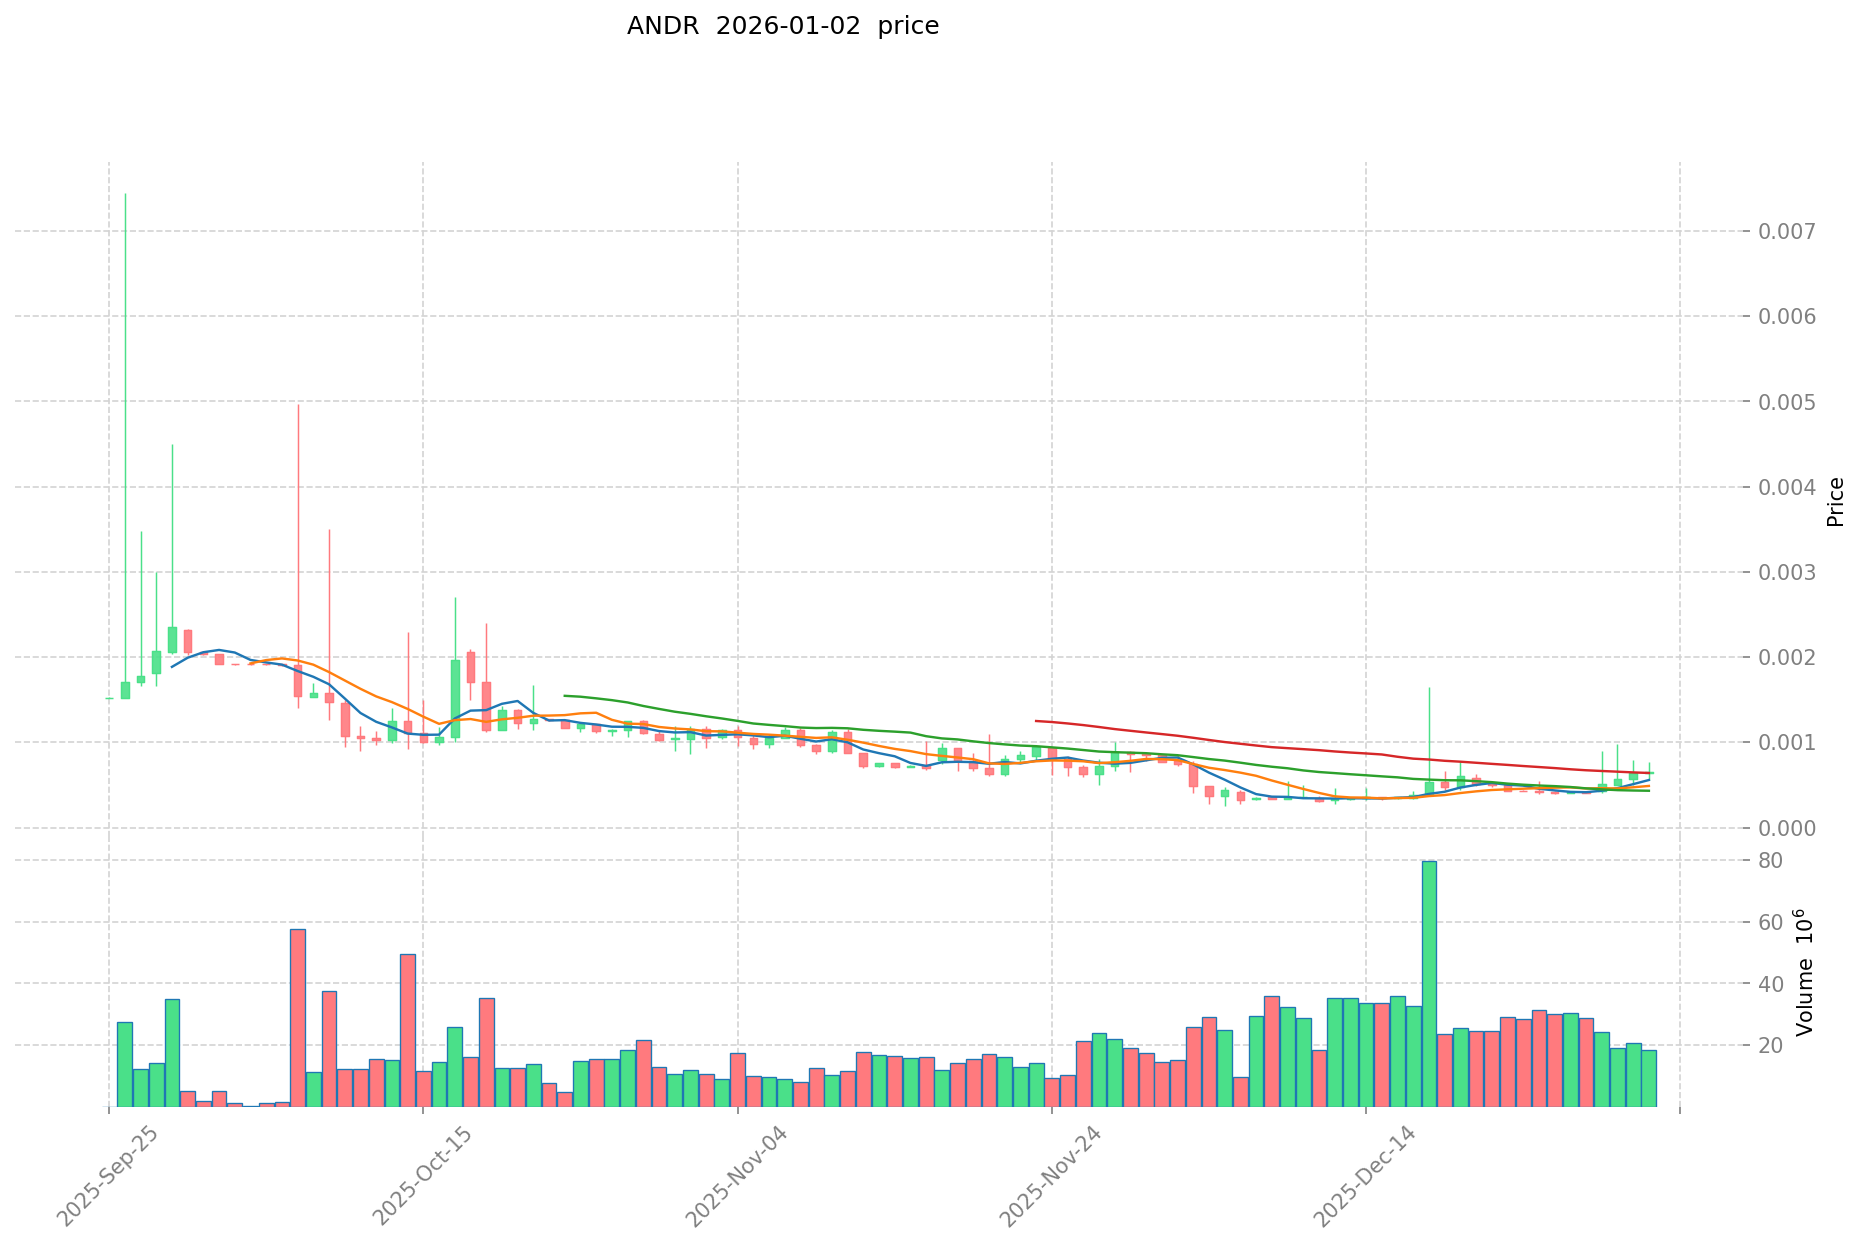
I. ANDR Price History Review and Current Investment Value Status
Peak Performance Period (2024)
- May 6, 2024: All-time high of USD 0.5869 reached
- Investors experienced significant gains during this period
Significant Decline (2025)
- December 5, 2025: All-time low of USD 0.0002512 recorded
- Represents a 97.31% depreciation over the one-year period from January 2025 to January 2026
Key Market Cycles
- The asset has experienced extreme volatility, declining from its historical peak of USD 0.5869 to the recent low of USD 0.0002512
- Year-to-date performance shows a -97.31% decline
- 30-day performance: -9.04%
- 7-day performance: +59.04% (indicating recent recovery attempts)
Current ANDR Market Status (January 2, 2026)
- Current Price: USD 0.000655
- Market Sentiment: Neutral to cautious (Market emotion index: 1)
- 24-Hour Trading Volume: USD 12,142.69
- Market Capitalization: USD 655,000.00 (fully diluted valuation)
- Circulating Supply: 241,137,829.61 ANDR (24.11% of total supply)
- Total Supply: 1,000,000,000 ANDR tokens
- Market Dominance: 0.000020% of overall cryptocurrency market
Current live ANDR market price and data available at Gate ANDR
II. Project Overview and Technological Foundation
Andromeda positions itself as the first truly 100% on-chain, Inter-Blockchain Communication (IBC)-enabled decentralized Web3 Operating System (OS). The platform offers products, tools, and utilities designed to address application building and composing challenges through the following value propositions: improved simplicity, enhanced quality, reduced costs, and increased speed.
The project aims to bring institutional-grade engineering, security, user interface/user experience (UI/UX), and professional leadership to Web3 ecosystems, making the space trustworthy for enterprise adoption. The platform seeks to expand total addressable market (TAM), block space, optionality, and the ability to avoid single-chain functionality and technical risks through its multi-chain architecture.
Price Movement Overview (Recent Periods)
| Time Period |
Price Change |
Absolute Change (USD) |
| 1 Hour |
+0.76% |
+0.000004940452560540 |
| 24 Hours |
0% |
0 |
| 7 Days |
+59.040% |
+0.000243153923541248 |
| 30 Days |
-9.04% |
-0.000065096745822339 |
| 1 Year |
-97.31% |
-0.023694442379182223 |
Trading Activity Metrics
- 24-Hour High: USD 0.0007657
- 24-Hour Low: USD 0.0005561
- Circulating Supply Ratio: 24.11%
- Number of Exchanges: Limited availability (1 primary exchange listed)
IV. Key Observations and Risk Considerations
Extreme Volatility and Valuation Risk: The asset has experienced a 97.31% decline over the past year, indicating substantial market volatility and downside risk exposure.
Limited Market Liquidity: The 24-hour trading volume of USD 12,142.69 is relatively low, suggesting liquidity constraints that may impact position entry and exit opportunities.
Market Capitalization Concerns: With a fully diluted valuation of only USD 655,000 and a market dominance of 0.000020%, ANDR maintains minimal influence on the broader cryptocurrency market.
Circulating Supply Pressure: The circulating supply represents 24.11% of the total supply, with 758.8 million tokens remaining to enter circulation, which may create significant dilution pressure.
V. Project Resources
Disclaimer: This report contains factual market data only and does not constitute investment advice. Cryptocurrency assets carry substantial risk, including potential total loss of capital. Market participants should conduct thorough independent research and consult qualified financial advisors before making any investment decisions.
Andromeda (ANDR) Comprehensive Research Report
Report Date: January 2, 2026
Data Source: Gate Crypto Asset Database
I. Executive Summary
Andromeda (ANDR) is positioned as the first fully on-chain, IBC-enabled decentralized Web3 Operating System (OS). As of January 2, 2026, ANDR trades at $0.000655 with a market capitalization of $157,945.28 and a fully diluted valuation of $655,000. The token exhibits significant bearish market sentiment, having declined 97.31% over the past year from its all-time high of $0.5869 recorded on May 6, 2024.
II. Core Factors Affecting ANDR Investment Potential
Supply Mechanism and Scarcity
Andromeda operates with a fixed maximum supply of 1,000,000,000 tokens. Currently, 241,137,829.61 tokens are in circulation, representing approximately 24.11% of total supply. This circulating supply structure indicates substantial token dilution potential, as over 75% of tokens remain uncommitted. The circulating supply ratio of 24.11% represents a significant overhang that could suppress price appreciation during future distribution phases.
Market Positioning and Ecosystem Development
Andromeda positions itself as an institutional-grade Web3 operating system with focus on:
- 100% on-chain architecture with Inter-Blockchain Communication (IBC) support
- Application building and compositing solutions designed for simplified, cheaper, and faster development
- Institutional-level engineering, security, and UI/UX capabilities
- Risk mitigation through multi-chain optionality rather than single-chain dependency
However, the project's current market rank of 4,401 and extremely low trading volume ($12,142.69 in 24-hour volume) suggest limited market adoption and ecosystem liquidity.
Technical Market Indicators
Recent price action demonstrates mixed technical signals:
- 1-hour change: +0.76%
- 7-day change: +59.04%
- 30-day change: -9.04%
- 1-year change: -97.31%
The short-term 7-day appreciation contrasts sharply with longer-term depreciation, suggesting potential speculative positioning rather than fundamental strength. Technical indicators show predominantly neutral signals, with bearish sentiment prevailing in short-term analysis.
Price History and Current Valuation
| Metric |
Value |
| Current Price |
$0.000655 |
| 24-Hour High |
$0.0007657 |
| 24-Hour Low |
$0.0005561 |
| All-Time High (May 6, 2024) |
$0.5869 |
| All-Time Low (December 5, 2025) |
$0.0002512 |
| Year-to-Date Decline |
-97.31% |
The token has experienced catastrophic depreciation from its peak valuation. Current price levels approximate the all-time low, indicating sustained selling pressure and minimal investor confidence.
Liquidity Assessment
24-hour trading volume of $12,142.69 represents extremely limited liquidity. This minimal volume relative to market capitalization suggests high price volatility and potential difficulty executing significant positions without substantial slippage.
IV. Market Sentiment and Outlook
Bearish Forecast Consensus
Multiple analytical frameworks indicate bearish outlook for ANDR:
- Short-term prediction (January 31, 2026): Price expected to decline 24.90% to $0.0005212
- Technical analysis sentiment: Predominantly bearish based on technical indicators
- 2026 price projections: Range between $0.0005912–$0.0007009
- Profit potential assessment: Minimal to zero profit potential indicated through 2026
Divergent Long-Term Projections
Certain analysts present more optimistic longer-term scenarios:
- 2029 predictions range from $0.00277–$0.00332
- 2030 estimates reach $0.00700–$3.10 depending on methodology
- 2031–2033 projections continue incremental price appreciation
However, these extended forecasts carry substantially lower confidence given the fundamental market challenges currently evident.
V. Risk Assessment
Downside Risks
- Supply dilution: 75.89% of token supply remains unvested, creating significant price pressure upon distribution
- Liquidity constraints: Minimal trading volume increases volatility and slippage
- Market adoption: Low exchange presence (1 exchange) and market rank (4,401) indicate limited institutional interest
- Historical performance: Sustained 97.31% drawdown from peaks suggests structural challenges
Valuation Considerations
The fully diluted valuation of $655,000 against minimal daily trading volume creates severe valuation disconnect. This metric suggests potential overvaluation or extreme market inefficiency.
VI. Project Infrastructure
Official Channels:
Market Data:
- Primary Exchange: Gate
- Ranking: 4,401
- Market Sentiment Index: 1 (neutral)
VII. Conclusion
Andromeda (ANDR) currently exhibits characteristics inconsistent with promising investment positioning. The token's 97.31% depreciation from all-time highs, minimal trading liquidity, low market adoption, and consensus bearish technical outlook create significant headwinds. While the project's conceptual positioning as a Web3 operating system addresses legitimate ecosystem needs, current market metrics suggest execution challenges or market skepticism regarding the protocol's viability.
The substantial unreleased token supply (75.89%) presents particular concern regarding near-term price dynamics. Short-term price predictions indicate further depreciation potential through early 2026.
Market Status (as of January 2, 2026): ANDR exhibits characteristics of a highly speculative, illiquid asset in sustained downtrend with uncertain recovery catalysts.
Report Disclaimer: This report presents factual market data and analytical synthesis based on available information. Market projections contain inherent uncertainty. Cryptocurrency investments carry substantial risk including potential total capital loss.
III. ANDR Future Investment Predictions and Price Outlook
Short-term Investment Prediction (2026, short-term ANDR investment outlook)
- Conservative forecast: $0.00034715 - $0.000655
- Neutral forecast: $0.000655 - $0.00087115
- Bullish forecast: $0.00087115 - $0.00130000
Mid-term Investment Outlook (2027-2029, mid-term Andromeda(ANDR) investment forecast)
- Market stage expectation: ANDR is positioned to benefit from increased adoption of decentralized Web3 operating systems and IBC-enabled infrastructure as institutional interest in blockchain technology grows.
- Investment return predictions:
- 2027: $0.00060283 - $0.000824121 (+16% anticipated)
- 2028: $0.0006348784 - $0.00084914986 (+21% anticipated)
- Key catalysts: Expansion of the Andromeda OS ecosystem, integration partnerships with major blockchain networks, institutional adoption of Web3 infrastructure solutions, and development of enterprise-grade tools and security features.
Long-term Investment Outlook (Is Andromeda a good long-term investment?)
- Base scenario: $0.000616 - $0.001310 USD (assuming steady ecosystem growth and moderate market expansion with successful product adoption)
- Optimistic scenario: $0.001200 - $0.002000 USD (assuming accelerated enterprise adoption and significant increase in total addressable market through institutional partnerships)
- Risk scenario: $0.000200 - $0.000400 USD (under conditions of prolonged market downturn, regulatory headwinds, or failure to achieve planned ecosystem milestones)
Click to view ANDR long-term investment and price forecasts: Price Prediction
2026-01-02 to 2031 Long-term Outlook
- Base scenario: $0.000617 - $0.000851 USD (corresponding to steady progress in ecosystem development and gradual mainstream adoption of decentralized operating systems)
- Optimistic scenario: $0.001100 - $0.001310 USD (corresponding to widespread enterprise adoption and favorable market conditions for Web3 infrastructure)
- Transformative scenario: $0.001500 USD or above (contingent upon breakthrough ecosystem developments and mainstream adoption of Andromeda's institutional-grade solutions)
- 2031-12-31 predicted high point: $0.001310 USD (based on optimistic development assumptions)
Disclaimer: This analysis is for informational purposes only and does not constitute investment advice. The cryptocurrency market is highly volatile and subject to rapid price fluctuations. Actual results may differ significantly from forecasts. Investors should conduct their own research and consult with qualified financial advisors before making investment decisions.
| 年份 |
预测最高价 |
预测平均价格 |
预测最低价 |
涨跌幅 |
| 2026 |
0.00087115 |
0.000655 |
0.00034715 |
0 |
| 2027 |
0.000824121 |
0.000763075 |
0.00060282925 |
16 |
| 2028 |
0.00084914986 |
0.000793598 |
0.0006348784 |
21 |
| 2029 |
0.0009692212374 |
0.00082137393 |
0.0007310227977 |
25 |
| 2030 |
0.001307134472202 |
0.0008952975837 |
0.000850532704515 |
36 |
| 2031 |
0.001310447073261 |
0.001101216027951 |
0.000616680975652 |
68 |
Andromeda (ANDR) Investment Analysis Report
I. Project Overview
Andromeda (ANDR) is positioned as the first truly 100% on-chain, IBC-enabled, decentralized Web3 Operating System (OS) designed to address application building and composing challenges through simpler, better, cheaper, and faster solutions.
Key Metrics (As of January 02, 2026)
| Metric |
Value |
| Current Price |
$0.000655 |
| Market Capitalization |
$157,945.28 |
| Fully Diluted Valuation |
$655,000.00 |
| Circulating Supply |
241,137,829.61 ANDR |
| Total Supply |
1,000,000,000 ANDR |
| 24h Trading Volume |
$12,142.69 |
| Market Rank |
#4401 |
| Market Dominance |
0.000020% |
- All-Time High (ATH): $0.5869 (May 06, 2024)
- All-Time Low (ATL): $0.0002512 (December 05, 2025)
- 1 Hour Change: +0.76%
- 7 Day Change: +59.040%
- 30 Day Change: -9.04%
- 1 Year Change: -97.31%
II. Project Value Proposition
Core Features
Andromeda presents itself as a decentralized Web3 operating system with the following stated objectives:
- Institutional-Grade Standards: Bringing enterprise-level engineering, security, UI/UX, and professional management to Web3
- IBC Integration: Supporting inter-blockchain communication protocols
- Multi-Chain Architecture: Designed to avoid single-chain functionality and technological risks
- Comprehensive Tooling: Offering products, tools, and utilities for application development
Target Market
The protocol aims to serve enterprises seeking trustworthy Web3 infrastructure, addressing concerns around security, usability, and interoperability.
Recent Price Trends
The asset shows significant volatility with a notable recovery in the 7-day period (+59.040%) following a substantial annual decline (-97.31%). The 30-day performance remains negative at -9.04%, suggesting continued market pressure.
Liquidity Assessment
With 24-hour trading volume of $12,142.69 and a market cap of $157,945.28, ANDR exhibits relatively low liquidity. The volume-to-market-cap ratio indicates limited trading activity, which may result in higher slippage for significant positions.
Market Position
Ranked #4401 by market capitalization, ANDR occupies a micro-cap position within the broader cryptocurrency ecosystem, characteristic of early or developing projects.
IV. Investment Strategy and Risk Management
Investment Methodologies
Long-Term Holdings (HODL):
Suitable for risk-tolerant investors who believe in the protocol's long-term vision and are prepared to endure significant price volatility over extended periods.
Active Trading:
May appeal to experienced traders capable of performing technical analysis and identifying short-term trading opportunities, though the low liquidity presents execution challenges.
Risk Management Considerations
Portfolio Allocation:
- Conservative Investors: ANDR should represent minimal allocation (0-1% of portfolio)
- Active Traders: Position sizing should account for extreme volatility
- Institutional Investors: Typically avoid micro-cap assets due to liquidity constraints
Security Practices:
- Use reputable exchanges for trading
- Transfer significant holdings to non-custodial wallets
- Consider hardware wallets for long-term storage
V. Investment Risks and Challenges
Market Risks
- Extreme Volatility: The 97.31% annual decline and dramatic price swings indicate severe volatility unsuitable for conservative portfolios
- Low Liquidity: Trading volume relative to market cap suggests difficulty executing large positions without significant slippage
- Micro-Cap Exposure: Higher susceptibility to price manipulation and sudden collapses
Regulatory Risks
- Regulatory frameworks for decentralized operating systems remain uncertain across jurisdictions
- Potential changes in cryptocurrency regulations could impact project viability
Technology and Execution Risks
- Early-stage protocol development carries inherent technical risks
- IBC integration and cross-chain functionality require robust security implementations
- Adoption challenges in competitive Web3 infrastructure landscape
Adoption and Competitive Risks
- Competing projects in the Web3 OS space
- Dependence on developer adoption and ecosystem growth
- Execution risk on stated institutional-grade standards
VI. Conclusion: Is Andromeda a Good Investment?
Investment Thesis Summary
Andromeda (ANDR) represents a highly speculative micro-cap cryptocurrency focused on decentralized Web3 operating system infrastructure. While the project's vision addresses legitimate challenges in enterprise blockchain adoption, current metrics—including 97.31% annual decline, low trading volume, and minimal market dominance—reflect significant challenges in achieving market traction.
The recent 7-day recovery (+59.040%) does not offset the broader downward trend, and the asset remains substantially below its all-time high, indicating ongoing pressure and limited near-term recovery momentum.
Investor Recommendations
✅ New Investors:
ANDR is not recommended for capital preservation-focused portfolios. Only consider small, strictly speculative allocations with capital one can afford to lose entirely.
✅ Experienced Traders:
Technical traders may monitor the asset for specific trading opportunities based on price patterns, but liquidity constraints require careful position sizing.
✅ Institutional Investors:
Typically inappropriate due to micro-cap status, limited liquidity, and execution risk.
⚠️ Important Disclaimer
Cryptocurrency investments, particularly in micro-cap assets, carry substantial risk including total loss of capital. This report is provided for informational purposes only and does not constitute investment advice, financial advice, or a recommendation to buy or sell ANDR. Conduct independent research and consult qualified financial advisors before making investment decisions.
Report Generated: January 02, 2026
Andromeda (ANDR) Investment Analysis: Frequently Asked Questions
I. FAQ
Q1: What is Andromeda (ANDR) and what problem does it solve?
A: Andromeda (ANDR) is positioned as the first 100% on-chain, IBC-enabled decentralized Web3 Operating System (OS) designed to address application building and composing challenges in the blockchain ecosystem. It aims to provide institutional-grade engineering, security, and user experience by offering simpler, better, cheaper, and faster solutions for Web3 development. The project attempts to mitigate single-chain risks through multi-chain architecture and interoperability protocols.
Q2: What is ANDR's current market position and valuation as of January 2, 2026?
A: As of January 2, 2026, ANDR trades at $0.000655 with a market capitalization of $157,945.28 and a fully diluted valuation of $655,000. The token ranks #4401 by market cap with a market dominance of only 0.000020%. Daily trading volume stands at $12,142.69, indicating extremely limited liquidity. The circulating supply represents 241.14 million tokens (24.11% of total supply), with 758.86 million tokens remaining to enter circulation.
Q3: How has ANDR performed historically and what does price history indicate about investment viability?
A: ANDR has experienced catastrophic price depreciation, declining 97.31% over the past year from its all-time high of $0.5869 (May 6, 2024) to current levels near its all-time low of $0.0002512 (December 5, 2025). While the asset showed short-term recovery with a +59.04% gain over seven days, this contrasts sharply with 30-day decline of -9.04% and the devastating annual performance. This pattern suggests ongoing structural market challenges rather than fundamental strength recovery.
Q4: What are the primary investment risks associated with ANDR?
A: Key investment risks include: extreme volatility unsuitable for conservative portfolios; severe liquidity constraints with minimal trading volume; supply dilution risk from 75.89% of tokens remaining unvested; micro-cap classification increasing manipulation susceptibility; uncertain regulatory environment for decentralized operating systems; and execution risk on achieving institutional adoption. The asset also faces competitive pressure from alternative Web3 infrastructure projects.
Q5: What are the price predictions for ANDR in 2026 and beyond?
A: Short-term 2026 predictions range from $0.00034715 (conservative) to $0.00130000 (bullish). Mid-term forecasts (2027-2029) anticipate modest appreciation to $0.000824121–$0.00084914986. Long-term projections (through 2031) present base scenarios of $0.000617–$0.001310, optimistic scenarios reaching $0.001100–$0.001310, and transformative scenarios exceeding $0.001500. However, these forecasts carry substantial uncertainty given market fundamentals and consensus bearish technical sentiment.
Q6: Is ANDR suitable for long-term investment holdings?
A: ANDR is generally not recommended as a core long-term holding for most investors. Only risk-tolerant investors with extended time horizons and capacity to withstand potential total capital loss should consider exposure. The asset's extreme volatility, minimal market adoption, and bearish technical indicators suggest greater suitability for speculative tactical positioning rather than strategic long-term accumulation. Conservative investors should allocate zero to minimal exposure (0-1% of portfolio maximum).
Q7: What liquidity challenges does ANDR present and how do they impact trading?
A: With 24-hour trading volume of only $12,142.69 against a market cap of $157,945.28, ANDR exhibits severe liquidity constraints. This low volume-to-market-cap ratio creates significant slippage risk for position entry and exit, particularly for larger orders. The asset trades on limited exchange availability (primarily one exchange), further restricting trading opportunities. Investors should anticipate substantial price impact when executing meaningful positions and consider the difficulty of liquidating holdings quickly during market stress.
Q8: What catalysts could potentially drive ANDR price appreciation in the medium to long term?
A: Potential positive catalysts include: ecosystem expansion through developer adoption; strategic integration partnerships with major blockchain networks; institutional adoption of Web3 infrastructure solutions; successful implementation of enterprise-grade security and user experience improvements; favorable regulatory developments for decentralized operating systems; and resolution of competitive pressures from alternative projects. However, current market positioning and execution challenges suggest these catalysts remain uncertain and may require extended timeframes to materialize into measurable price impact.
Disclaimer: This analysis presents factual market data and informational content only. It does not constitute investment advice, financial recommendation, or encouragement to buy or sell ANDR. Cryptocurrency investments, particularly in micro-cap assets, carry substantial risk including potential total loss of capital. Conduct independent research and consult qualified financial advisors before making investment decisions. Market forecasts contain inherent uncertainty and actual results may differ significantly from projections.
* The information is not intended to be and does not constitute financial advice or any other recommendation of any sort offered or endorsed by Gate.