# Article Introduction
**Is dotmoovs (MOOV) a Good Investment? A Comprehensive Analysis**
This comprehensive MOOV investment analysis examines whether the AI-powered sports platform token merits capital allocation. The article addresses critical questions for investors: current market valuation, historical price performance, risk assessment, and 2025-2030 price forecasts. It evaluates MOOV's investment potential across multiple investor profiles—from beginners to institutional traders—highlighting the token's 99.5% decline from peak and minimal market liquidity. The guide provides essential data on MOOV's ERC-20 specifications, supply mechanics, and trading availability on Gate, while delivering actionable risk management strategies and investment recommendations for the cryptocurrency market.
Introduction: The Investment Position and Market Prospects of dotmoovs (MOOV)
$MOOV is an ERC-20 token circulating on the dotmoovs platform that has garnered attention in the cryptocurrency market. Since its launch in May 2021, the token has experienced significant price volatility. As of December 29, 2025, MOOV maintains a market capitalization of approximately $499,600 with a circulating supply of 1 billion tokens, currently trading at around $0.0004996. The token has demonstrated notable market fluctuations, with an all-time high of $0.096391 reached in August 2021 and recent lows approaching $0.0004839. With only 1,355 token holders and limited exchange availability, MOOV represents a relatively niche asset in the broader cryptocurrency ecosystem. As investors increasingly explore diverse digital assets beyond mainstream cryptocurrencies, questions regarding "Is dotmoovs (MOOV) a good investment?" have become more prevalent. This article provides a comprehensive analysis of MOOV's investment value, historical price trends, future price forecasts, and associated investment risks to offer investors essential reference information.
dotmoovs (MOOV) Market Research Report
I. MOOV Price History Review and Current Investment Status
- August 30, 2021: All-Time High (ATH) reached at $0.096391 → Peak valuation period for early investors
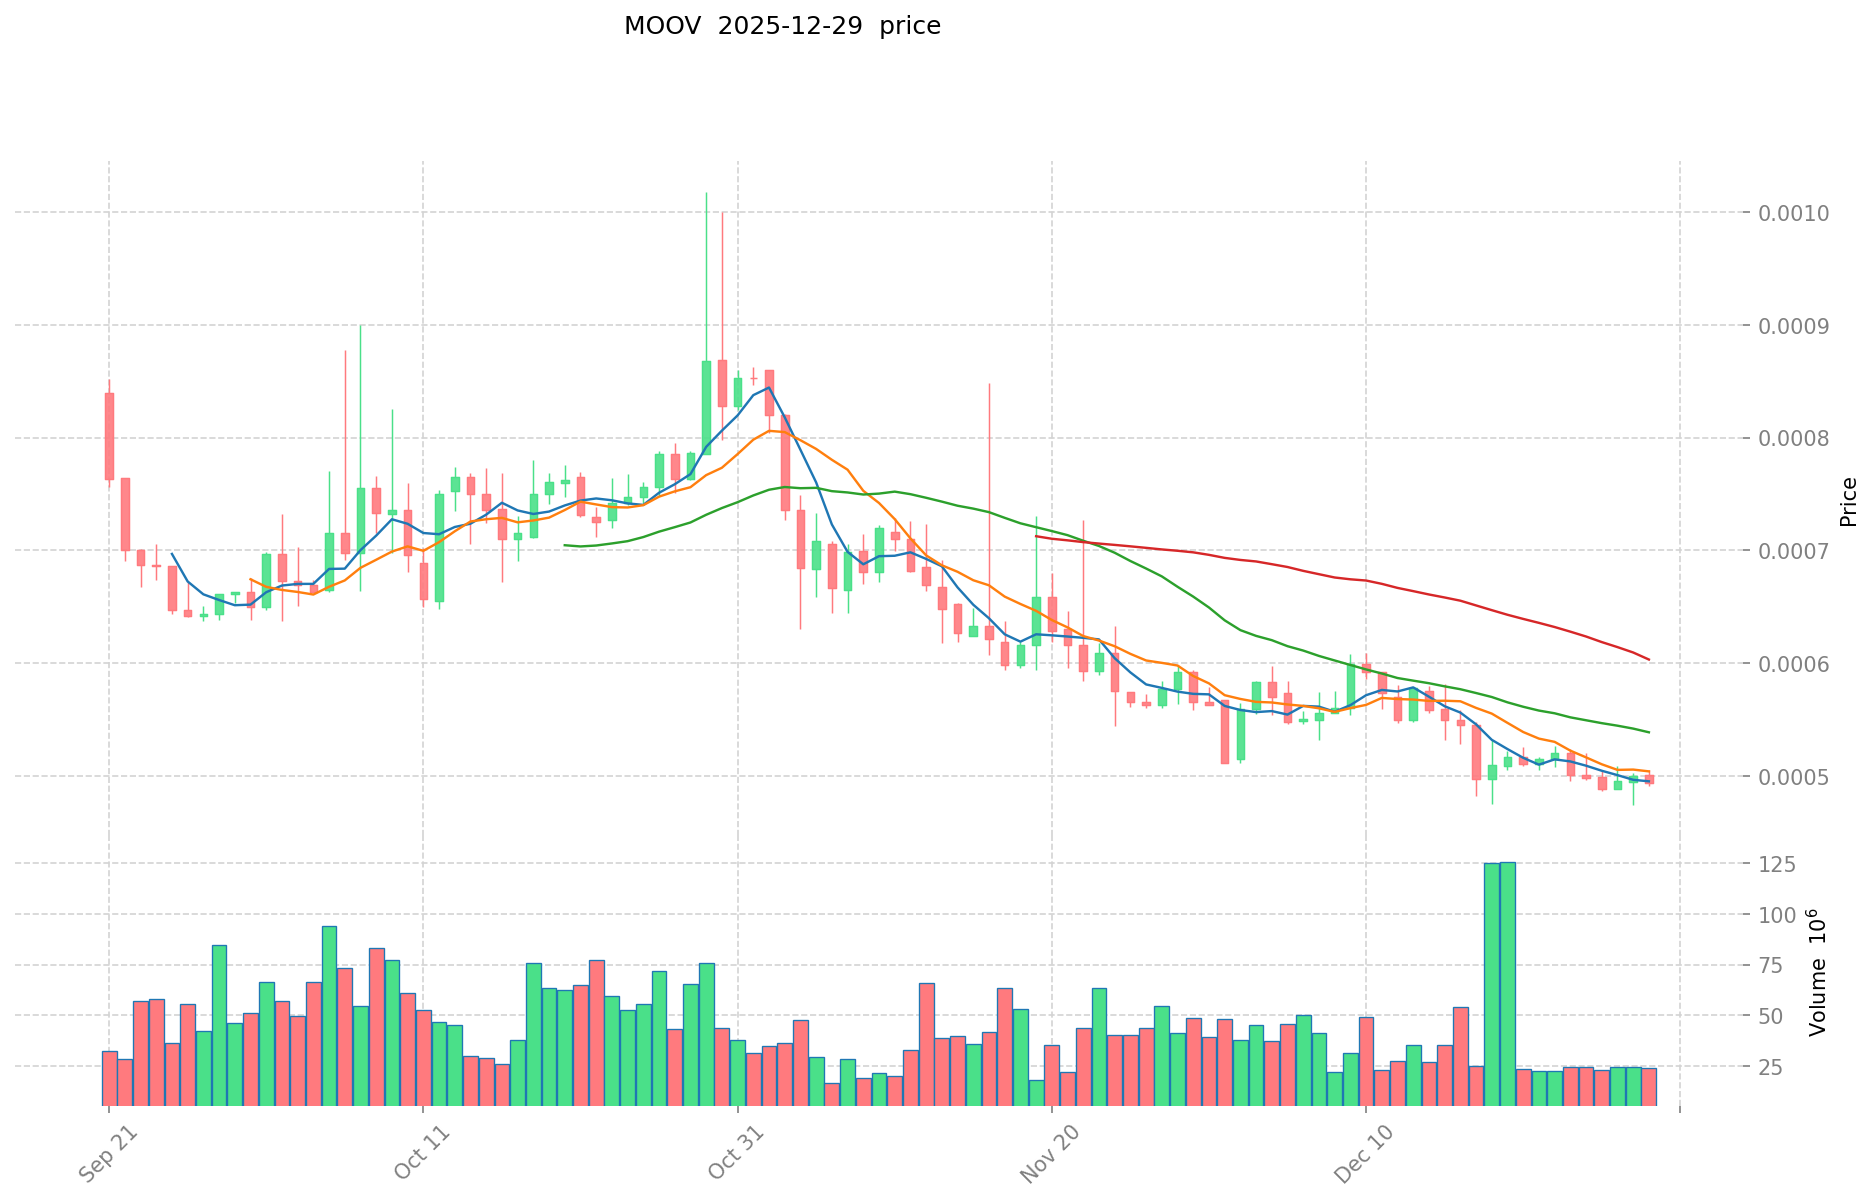
- December 18, 2025: All-Time Low (ATL) reached at $0.0004839 → Represents 99.50% decline from ATH
- 2021-2025 Market Cycle: From $0.096391 (peak) declined to $0.0004839 (low) → Significant long-term value erosion
Current MOOV Investment Market Status (December 29, 2025)
- Current Price: $0.0004996
- Market Sentiment: Neutral to Negative (Market Emotion Index: 1)
- 24-Hour Trading Volume: $15,786.22 USD
- Price Performance Metrics:
- 1-Hour Change: -1.79%
- 24-Hour Change: +1.19%
- 7-Day Change: -4.15%
- 30-Day Change: -12.07%
- 1-Year Change: -72.10%
Access real-time MOOV market price at Gate
II. Market Capitalization and Supply Analysis
| Metric |
Value |
| Current Market Cap |
$499,600.00 USD |
| Fully Diluted Valuation (FDV) |
$499,600.00 USD |
| Market Share |
0.000015% |
| Circulating Supply |
1,000,000,000 MOOV |
| Total Supply |
1,000,000,000 MOOV |
| Max Supply |
1,000,000,000 MOOV |
| Circulation Ratio |
100.0% |
| Token Holders |
1,355 addresses |
III. Token Specifications
Token Type: ERC-20 Standard Token
Blockchain: Ethereum (ETH)
Contract Address: 0x4116f14b6d462b32a1c10f98049e4b1765e34fa9
Supported wallets: All wallets supporting ERC-20 standard tokens can view and manage MOOV holdings.
$MOOV is an ERC-20 token circulating on the dotmoovs platform. The token can be transferred to Ethereum addresses, and wallets supporting ERC-20 tokens can view MOOV balances.
Official Resources
Market Ranking
- Global Ranking: #3,223 by market capitalization
Report Date: December 29, 2025
Data Source: Gate Market Data
dotmoovs (MOOV) Investment Analysis Report
I. Executive Summary
Current Status as of December 29, 2025:
- Price: $0.0004996
- Market Capitalization: $499,600
- Market Ranking: 3,223
- 24-Hour Trading Volume: $15,786.22
- Circulating Supply: 1,000,000,000 MOOV (100% of total supply)
MOOV is an ERC-20 token operating on the dotmoovs platform, deployed on the Ethereum blockchain. The token has experienced significant depreciation from its all-time high, with limited market presence and trading activity.
II. Core Factors Influencing MOOV as an Investment
Supply Mechanism and Scarcity (MOOV Investment Scarcity)
Fixed Supply Structure:
- Total Supply: 1,000,000,000 MOOV
- Circulating Supply: 1,000,000,000 MOOV (100% in circulation)
- No maximum supply restrictions beyond the total supply cap
- All tokens are currently circulating in the market
Scarcity Implications:
- Complete supply circulation indicates no deflationary mechanisms are currently active
- The absence of token burning, staking rewards, or supply reduction mechanisms limits traditional scarcity dynamics
- Market share remains minimal at 0.000015%, suggesting limited market penetration
Historical Price Analysis:
- All-Time High: $0.096391 (August 30, 2021)
- All-Time Low: $0.0004839 (December 18, 2025)
- Current Price: $0.0004996
- Price Decline from ATH: -99.48%
Recent Performance Metrics:
- 1-Hour Change: -1.79%
- 24-Hour Change: +1.19%
- 7-Day Change: -4.15%
- 30-Day Change: -12.07%
- 1-Year Change: -72.1%
Trading Activity:
- 24-Hour Volume: $15,786.22
- Market Concentration: Limited exchange presence (1 exchange)
- Token Holder Count: 1,355
Technical Infrastructure
Blockchain Integration:
- Standard: ERC-20 on Ethereum network
- Contract Address: 0x4116f14b6d462b32a1c10f98049e4b1765e34fa9
- Compatible with all ERC-20 supporting wallets
- Full transparency via Etherscan blockchain explorer
III. Risk Assessment
Market Liquidity Concerns:
- Extremely low trading volume relative to market cap
- Limited exchange availability restricts market accessibility
- High concentration risk with only 1,355 token holders
Valuation Metrics:
- Fully Diluted Valuation equals current market cap ($499,600), indicating no valuation expansion potential
- Historical price collapse of 99.48% from peak demonstrates extreme volatility
Official Channels:
Trading Access:
- Available on Gate platform
Report Date: December 29, 2025
III. MOOV Future Investment Predictions and Price Outlook (Is dotmoovs(MOOV) worth investing in 2025-2030)
Short-term Investment Prediction (2025, short-term MOOV investment outlook)
- Conservative forecast: $0.000287 - $0.0004954
- Neutral forecast: $0.0004954 - $0.000649
- Optimistic forecast: $0.000649 and above
Mid-term Investment Outlook (2026-2028, mid-term dotmoovs(MOOV) investment forecast)
- Market stage expectation: Token is expected to experience gradual recovery with modest price appreciation alongside potential ecosystem developments.
- Investment return prediction:
- 2026: $0.000378 - $0.000692
- 2027: $0.000506 - $0.000689
- 2028: $0.000522 - $0.000971
Long-term Investment Outlook (Is MOOV a good long-term investment?)
- Base case scenario: $0.000522 - $0.000971 (assuming stable platform operations and moderate adoption growth)
- Optimistic scenario: $0.000714 - $0.001072 (assuming increased user engagement and positive market sentiment)
- Risk scenario: $0.000287 - $0.000506 (assuming market headwinds and reduced platform activity)
For detailed MOOV long-term investment and price predictions, visit: Price Prediction
2025-12-29 to 2030-12-31 Long-term Outlook
- Base case: $0.000522 - $0.000893 USD (corresponding to steady platform development and gradual user base expansion)
- Optimistic case: $0.000714 - $0.001072 USD (corresponding to large-scale adoption and favorable market environment)
- Transformative case: $0.001072 USD and above (if ecosystem achieves breakthrough progress and mainstream adoption)
- 2030-12-31 predicted high: $0.001072 USD (based on optimistic development assumptions)
Disclaimer: This analysis is based on historical data and predictive models. Actual results may differ significantly. Crypto markets remain highly volatile and speculative. Investors should conduct independent research and consult financial advisors before making investment decisions.
| 年份 |
预测最高价 |
预测平均价格 |
预测最低价 |
涨跌幅 |
| 2025 |
0.000648974 |
0.0004954 |
0.000287332 |
0 |
| 2026 |
0.00069234627 |
0.000572187 |
0.00037764342 |
14 |
| 2027 |
0.00068917063215 |
0.000632266635 |
0.000505813308 |
26 |
| 2028 |
0.000971256391355 |
0.000660718633575 |
0.000521967720524 |
32 |
| 2029 |
0.000971025139833 |
0.000815987512465 |
0.000628310384598 |
63 |
| 2030 |
0.001072207591379 |
0.000893506326149 |
0.000714805060919 |
78 |
dotmoovs (MOOV) Token Analysis Report
I. Project Overview
Token Name: dotmoovs
Token Symbol: MOOV
Token Standard: ERC-20
Blockchain: Ethereum
Contract Address: 0x4116f14b6d462b32a1c10f98049e4b1765e34fa9
Market Position
- Current Price: $0.0004996
- Market Capitalization: $499,600
- Market Rank: 3,223
- Fully Diluted Valuation (FDV): $499,600
- Market Dominance: 0.000015%
- 24-Hour Trading Volume: $15,786.22
Token Supply
- Circulating Supply: 1,000,000,000 MOOV
- Total Supply: 1,000,000,000 MOOV
- Max Supply: 1,000,000,000 MOOV
- Circulation Ratio: 100%
- Token Holders: 1,355
II. Project Description
$MOOV is an ERC-20 token circulating on the dotmoovs platform. It can be transferred to Ethereum addresses, and wallets that support ERC-20 tokens can view MOOV holdings.
Official Resources:
Historical Price Metrics
- All-Time High (ATH): $0.096391 (August 30, 2021)
- All-Time Low (ATL): $0.0004839 (December 18, 2025)
- 24-Hour High: $0.0005219
- 24-Hour Low: $0.0004926
- Launch Price: $0.012241
Price Change Analysis
| Timeframe |
Change Percentage |
Change Amount |
| 1 Hour |
-1.79% |
-0.000009105834436412 |
| 24 Hours |
+1.19% |
+0.000005875323648582 |
| 7 Days |
-4.15% |
-0.000021631090245175 |
| 30 Days |
-12.07% |
-0.000068579233481178 |
| 1 Year |
-72.1% |
-0.001291081003584229 |
Key Observations: MOOV has experienced significant depreciation over the long term, declining 72.1% over the past year. Short-term volatility remains present with mixed directional signals across different timeframes.
IV. Investment Strategy & Risk Management
Investment Methodologies for MOOV
Long-term Holding (HODL MOOV):
- Suitable for conservative investors with extended investment horizons
- Requires conviction in platform utility and ecosystem development
- Given current price levels near ATL, risk-reward considerations differ significantly from peak prices
Active Trading:
- Dependent on technical analysis and momentum identification
- Limited trading volume ($15,786.22 daily) constrains execution capability
- Volatility presents both opportunities and heightened risks
Risk Management for MOOV Investment
Asset Allocation Considerations:
- Conservative investors: Given the token's poor long-term performance and modest market position, exposure should remain minimal (< 1% of portfolio)
- Experienced traders: Position sizing critical due to limited liquidity and small holder base (1,355 addresses)
- Institutional investors: Utility assessment and platform development metrics should precede capital allocation
Security Storage:
- ERC-20 tokens require Ethereum-compatible wallets (MetaMask, Ledger, Trezor)
- Hardware wallet storage recommended for significant holdings
- Smart contract risk inherent to token standard
V. Investment Risks & Challenges
Market Risks
- Extreme Price Volatility: Historical fluctuation from $0.096391 to $0.0004839 demonstrates severe depreciation risk
- Minimal Liquidity: Daily volume of ~$15,786 creates slippage risk for larger transactions
- Low Market Capitalization: $499,600 market cap indicates vulnerability to price manipulation
- Concentrated Holder Base: Only 1,355 token holders increases concentration risk
Regulatory Risks
- ERC-20 tokens on Ethereum remain subject to evolving cryptocurrency regulations across jurisdictions
- Uncertainty regarding stablecoin and token classification in various regulatory frameworks
Technology Risks
- Dependency on Ethereum network security and continued operation
- Smart contract risk inherent to ERC-20 standard implementation
- Platform development and maintenance risks for dotmoovs ecosystem
Liquidity Risks
- Minimal trading volume constrains exit strategies during market stress
- Limited exchange listings may impact accessibility and market depth
VI. Conclusion: Is MOOV a Good Investment?
Investment Value Assessment
MOOV presents a significantly challenged investment profile characterized by:
- Severe Long-term Depreciation: 72.1% decline over one year and 99.5% decline from ATH represent substantial value destruction
- Minimal Market Presence: Market rank of 3,223 with market cap under $500,000 indicates limited ecosystem development or adoption
- Concentrated Liquidity: Daily volume of approximately $15,786 creates practical constraints for meaningful capital deployment
- Small Holder Base: 1,355 token holders suggest limited community engagement or network effects
Investment Recommendations
Note: Cryptocurrency investments carry substantial risk. This analysis is for informational purposes only and does not constitute investment advice.
For New Investors:
⚠️ Not recommended as entry point into crypto markets. Consider alternative, more established tokens with stronger fundamentals and larger user bases.
For Experienced Traders:
⚠️ Speculative positions only. Position sizing must account for extreme illiquidity and concentration risks. Technical analysis tools limited by low volume.
For Institutional Investors:
⚠️ Insufficient market liquidity and ecosystem clarity for meaningful allocation. Requires direct assessment of dotmoovs platform development and utility metrics before consideration.
Risk Disclaimer
MOOV demonstrates characteristics of a high-risk, low-liquidity token with poor historical performance. Investment decisions should be based on thorough due diligence of the dotmoovs platform, development roadmap, and realistic use case assessment. The extreme price depreciation observed warrants significant caution regardless of investor sophistication level.
Report Generated: December 29, 2025
Data Current As Of: December 29, 2025 20:19:03 UTC
dotmoovs (MOOV) Frequently Asked Questions (FAQ)
I. Investment Basics
Q1: What is dotmoovs (MOOV) and how does it work?
A: MOOV is an ERC-20 token operating on the Ethereum blockchain, deployed on the dotmoovs platform. It functions as a standard Ethereum token that can be transferred between addresses and stored in any wallet supporting ERC-20 standards. The token was launched in May 2021 with a fixed supply of 1 billion tokens, 100% of which are currently in circulation.
Q2: What is the current price and market capitalization of MOOV?
A: As of December 29, 2025, MOOV trades at $0.0004996 with a market capitalization of approximately $499,600. The token ranks 3,223 globally by market cap with a daily trading volume of $15,786.22. The fully diluted valuation equals the current market cap, as all tokens are already circulating.
Q3: What is MOOV's price history and performance?
A: MOOV reached its all-time high of $0.096391 in August 2021, representing the peak valuation period for early investors. The token subsequently declined to an all-time low of $0.0004839 in December 2025, reflecting a 99.50% decline from peak. Over the past year, the token has depreciated 72.1%, indicating significant long-term value erosion and substantial losses for investors who purchased at higher prices.
II. Market Analysis and Risks
Q4: How many people hold MOOV tokens and what does this indicate?
A: Currently, only 1,355 Ethereum addresses hold MOOV tokens, indicating a highly concentrated holder base. This limited distribution raises concerns about network effects, community engagement, and suggests vulnerability to price manipulation. The small holder base, combined with minimal trading volume, represents a significant liquidity and concentration risk for potential investors.
Q5: Is MOOV a good investment for 2025-2030?
A: Based on available analysis, MOOV presents a high-risk investment profile. Long-term price predictions range from $0.000522 to $0.001072 by 2030 under optimistic scenarios, though the token's history of severe depreciation and minimal market adoption warrant extreme caution. The token is not recommended as an entry point for new cryptocurrency investors and should only be considered by experienced traders willing to accept substantial risk of further losses.
Q6: What are the main risks associated with investing in MOOV?
A: Key investment risks include extreme price volatility (99.5% decline from ATH), minimal liquidity with daily volume under $16,000, extremely low market capitalization creating manipulation vulnerability, concentrated holder base limiting network effects, regulatory uncertainty surrounding ERC-20 tokens, dependency on Ethereum network security, and limited exchange availability constraining exit strategies. These factors collectively present elevated risk unsuitable for most investors.
III. Technical and Practical Considerations
Q7: How can I buy, store, and trade MOOV tokens?
A: MOOV can be purchased on Gate exchange. For storage, any wallet supporting ERC-20 standard tokens may be used, including MetaMask, Ledger, Trezor, and other Ethereum-compatible wallets. Hardware wallet storage is recommended for significant holdings to mitigate security risks. The token's smart contract address on Etherscan is 0x4116f14b6d462b32a1c10f98049e4b1765e34fa9, enabling blockchain transparency and verification.
Q8: What official resources are available for learning more about dotmoovs (MOOV)?
A: Official project resources include the website (https://dotmoovs.com), whitepaper (available via DocSend at https://docsend.com/view/pjamgzxazgmbwt24), Twitter account (@dotmoovs for updates and announcements), and the Etherscan contract page (https://etherscan.io/token/0x4116f14b6d462b32a1c10f98049e4b1765e34fa9) for on-chain transaction verification. Investors should review these resources and conduct independent research before making investment decisions.
Disclaimer: This FAQ is for informational purposes only and does not constitute investment advice. Cryptocurrency investments involve substantial risk, including potential total loss of capital. Investors should conduct thorough due diligence and consult qualified financial advisors before making investment decisions.
* The information is not intended to be and does not constitute financial advice or any other recommendation of any sort offered or endorsed by Gate.