# Is LandX Finance (LNDX) a Good Investment? A Comprehensive Analysis
**Article Overview:**
This comprehensive analysis evaluates LandX Finance (LNDX) as an investment asset through detailed examination of tokenomics, market performance, and blockchain infrastructure. The report delivers critical insights into LNDX's current trading at $0.02496 with a 91.41% annual decline, Layer 2 scalability potential via Arbitrum and Optimism partnerships, and realistic price forecasts through 2030. Designed for both retail and institutional investors, this guide addresses whether LNDX warrants portfolio allocation by examining market risks, liquidity constraints, and technical architecture. The article combines historical price analysis with forward-looking projections and actionable risk management strategies, enabling informed investment decisions on this high-risk DeFi asset trading on Gate.
Introduction: LandX Finance (LNDX) Investment Position and Market Prospects
LNDX is an important asset in the cryptocurrency field. Since its launch in December 2023, it has gained significant attention in the DeFi accessibility and efficiency sector. As of December 31, 2025, LNDX's fully diluted valuation reached $1,747,528.22, with circulating supply of approximately 13.18 million tokens and current price maintained around $0.02496. With its positioning as a "revolutionary DeFi accessibility and efficiency solution," LNDX has gradually become a focal point when investors discuss "Is LandX Finance (LNDX) a good investment?"
LandX represents an exciting advancement in blockchain technology, with its open-source code deployed on the Ethereum mainnet. The project is advancing through cutting-edge Layer 2 solutions in collaboration with industry leaders LayerZero and L2 solutions including Arbitrum and Optimism. This innovation extends beyond technology to user experience, with smart contracts and web applications masterfully designed to offer seamless, intuitive interaction while setting new standards in user-friendly blockchain engagement.
This report will provide a comprehensive analysis of LNDX's investment value, historical performance, future price predictions, and investment risks to serve as a reference for investors.
LandX Finance (LNDX) Comprehensive Research Report
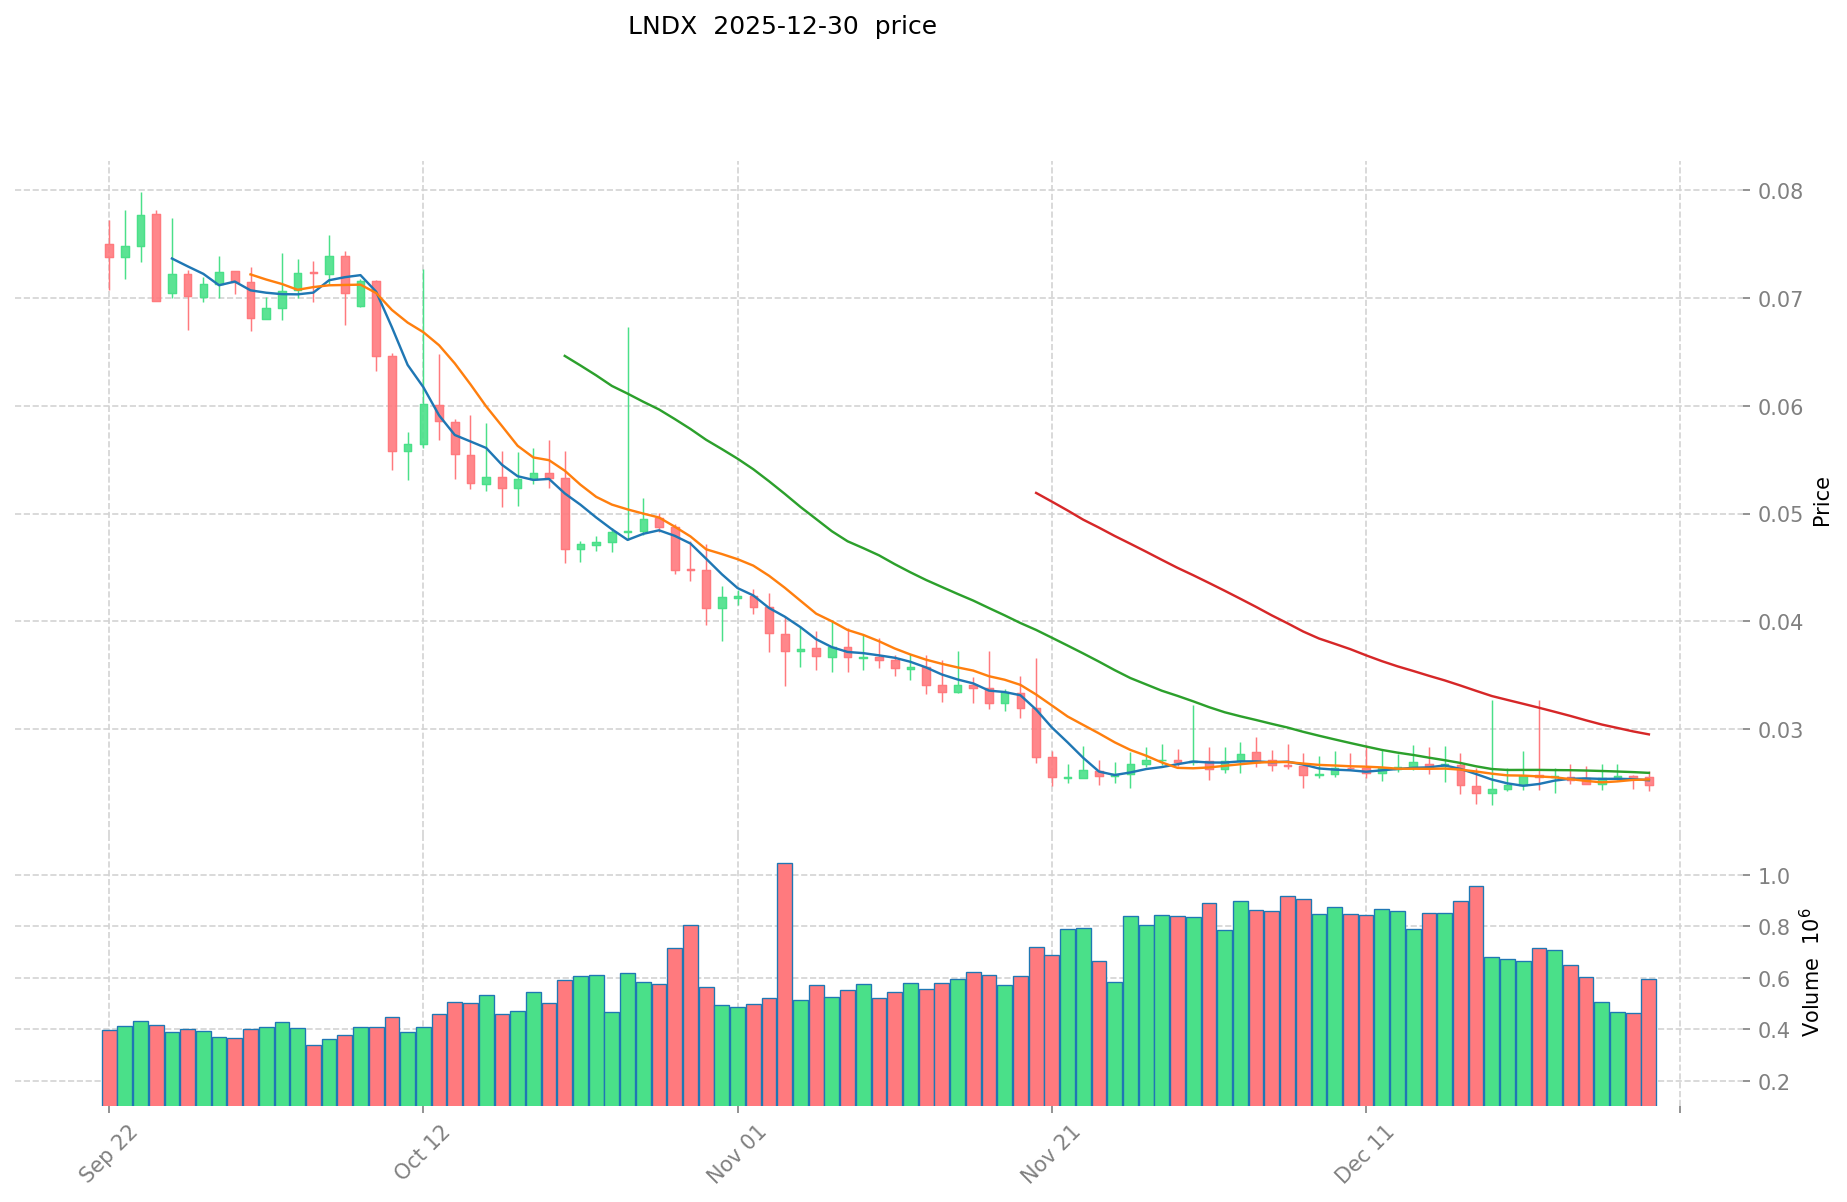
I. LNDX Price History Review and Current Investment Status
Based on available data, the following price milestones have been documented for LNDX:
- December 15, 2023: All-time high of $7.14676 was reached, representing the peak valuation since project launch.
- December 19, 2025: All-time low of $0.02294 was recorded, marking a significant decline from historical peaks.
- Overall decline trajectory: From the all-time high to the all-time low represents approximately a 99.68% depreciation over the two-year period.
Current Market Status (December 31, 2025)
Price Metrics:
- Current Price: $0.02496
- 24-Hour Price Change: +0.93%
- 7-Day Price Change: -1.54%
- 30-Day Price Change: -7.59%
- 1-Year Price Change: -91.41%
Trading Volume and Market Cap:
- 24-Hour Trading Volume: $13,409.26
- Total Market Capitalization: $328,891.63 (market cap based on circulating supply)
- Fully Diluted Valuation: $1,747,528.22
- Market Dominance: 0.000055%
Supply Metrics:
- Circulating Supply: 13,176,747.82 LNDX (16.47% of total supply)
- Total Supply: 70,013,149.65 LNDX
- Maximum Supply: 80,000,000 LNDX
- Number of Holders: 2,431
Market Sentiment:
- Market Emotion Index: 1 (indicating neutral sentiment)
For real-time LNDX market data and pricing information, visit Gate LNDX Price
II. Project Overview and Technical Architecture
Project Description
LandX represents a significant advancement in blockchain technology. The project's open-source code is deployed on the Ethereum mainnet as an ERC-20 token standard. LandX is collaborating with industry leaders LayerZero and various Layer 2 solutions including Arbitrum and Optimism to advance its technological capabilities.
Technical Specifications
Blockchain Details:
- Token Standard: ERC-20
- Primary Chain: Ethereum (ETH)
- Contract Address: 0x08A1C30BBB26425c1031ee9E43FA0B9960742539
- Deployment Date: December 15, 2023
Cross-Chain Infrastructure:
- LayerZero Integration: Enabling interoperability protocols
- Layer 2 Solutions: Arbitrum and Optimism compatibility
Core Objectives
The project focuses on:
- Creating seamless and intuitive blockchain user experiences
- Enhancing smart contract design for accessibility
- Improving DeFi accessibility and operational efficiency
- Setting new standards in user-friendly blockchain interaction
III. Project Resources and Community
Official Channels
IV. Market Assessment and Notable Observations
Key Market Indicators
Volatility Assessment:
- The token has experienced extreme price volatility, declining 91.41% over the past year
- Recent 24-hour fluctuations show minimal movement (+0.93%)
- Trading volume remains relatively modest at approximately $13,400 in 24-hour volume
Valuation Metrics:
- Current price-to-ATH ratio: Approximately 0.35% of all-time high
- Market cap to fully diluted valuation ratio: 16.47% (indicating significant unlocked supply potential)
- Rank by market capitalization: #3,628 globally
Trading and Liquidity:
- Exchange presence: Limited (trading on 1 exchange)
- Holder distribution: 2,431 addresses holding LNDX tokens
- Market concentration remains relatively low given holder count
V. Risk Considerations
This report is provided for informational purposes only and should not be construed as investment advice. Readers should conduct their own due diligence before making any financial decisions.
Notable Risk Factors:
- Severe historical price depreciation (99.68% from ATH to ATL)
- Low trading volume relative to market cap
- Limited exchange availability
- Project relatively early in maturity cycle
- Significant unlocked token supply (83.53% not yet in circulation)
Report Generated: December 31, 2025
Data Source: Gate Market Data
Disclaimer: This analysis is based on publicly available information as of the report date. Cryptocurrency markets are highly volatile and subject to rapid changes. Past performance does not indicate future results.
LandX Finance (LNDX) Investment Analysis Report
Report Date: December 31, 2025
I. Executive Summary
LandX Finance (LNDX) is a blockchain-based project operating on the Ethereum mainnet with a current market capitalization of approximately $328,891.63 and a circulating supply of 13,176,747.82 tokens. As of December 31, 2025, LNDX is trading at $0.02496, representing a significant decline of 91.41% over the past year from its all-time high of $7.14676 reached on December 15, 2023.
II. Core Factors Influencing LNDX Investment Viability
Supply Mechanism and Scarcity (LNDX Investment Scarcity)
- Token Structure: The LNDX token operates as an ERC20 token on the Ethereum network with a maximum supply cap of 80,000,000 tokens.
- Current Circulation: With 13,176,747.82 tokens currently in circulation, the circulating supply represents approximately 16.47% of the maximum supply.
- Supply Implications: The substantial gap between circulating and maximum supply suggests potential for dilution, which may exert downward pressure on token valuation as additional tokens enter circulation.
- Investment Significance: Token scarcity is a traditional factor in cryptographic asset valuation; however, the current supply dynamics indicate limited near-term scarcity benefits.
Technology and Ecosystem Development (Technology & Ecosystem for LNDX Investment)
- Ethereum Mainnet Deployment: LNDX's open-source code resides on the Ethereum mainnet, providing access to established infrastructure and security protocols.
- Layer 2 Integration: The project collaborates with industry participants including LayerZero, Arbitrum, and Optimism to deploy cutting-edge Layer 2 solutions, which aim to improve transaction scalability and reduce network congestion.
- User Experience Focus: Smart contracts and web applications are designed to provide seamless and intuitive blockchain interaction, positioning LandX as a user-centric DeFi platform.
- DeFi Accessibility Goals: The project targets improvements in DeFi accessibility and operational efficiency through its technical architecture.
- Current Market Position: LNDX ranks 3,628 by market capitalization with a market dominance of 0.000055%.
- 24-Hour Price Movement: +0.93% change in the past 24 hours, trading between $0.02427 and $0.02611.
- Extended Performance Metrics:
- 7-Day Change: -1.54%
- 30-Day Change: -7.59%
- 1-Year Change: -91.41%
- All-Time Performance: The token reached its all-time high of $7.14676 on December 15, 2023, and its all-time low of $0.02294 on December 19, 2025—a decline of approximately 99.68% from peak valuation.
Market Sentiment and Technical Indicators
- Trading Volume: 24-hour trading volume stands at $13,409.26, indicating limited liquidity.
- Technical Analysis Signals: Available technical indicators suggest a "Strong Sell" signal based on moving averages.
- Market Emotion Index: Neutral market sentiment score of 1.
- Holder Distribution: The project has 2,431 token holders, suggesting moderate but not extensive community adoption.
Institutional Adoption and Mainstream Acceptance
The available data does not provide specific information regarding institutional holdings, major corporate adoption, or official government policy positions toward LNDX. Therefore, this assessment cannot be completed based on the provided materials.
Macroeconomic Environment Impact on LNDX Investment
The provided reference materials do not contain specific analysis of macroeconomic factors such as monetary policy, interest rate dynamics, inflationary pressures, or geopolitical considerations as they relate to LNDX valuation. Therefore, this section cannot be substantively completed.
III. Key Risk Factors
- Severe Price Depreciation: The 91.41% decline over 12 months and 99.68% decline from all-time highs represent substantial value erosion.
- Limited Trading Liquidity: Daily volume of $13,409.26 is relatively modest, potentially limiting entry and exit opportunities.
- Market Capitalization Concerns: With a fully diluted valuation of $1,747,528.22 against modest trading activity, the asset demonstrates characteristics of a low-liquidity, small-cap cryptocurrency.
- Technical Sell Signals: Current technical indicators suggest bearish momentum.
IV. Project Resources
V. Conclusion
Based on the available data, LNDX presents characteristics of a high-risk, low-liquidity cryptocurrency asset experiencing significant market challenges. While the project demonstrates technical infrastructure on Ethereum with Layer 2 integrations, the substantial price depreciation, limited trading volume, and bearish technical signals warrant careful consideration. Potential investors should conduct comprehensive independent research and risk assessment before making investment decisions.
III. LNDX Future Investment Forecast and Price Outlook (Is LandX Finance(LNDX) worth investing in 2025-2030)
Short-term Investment Forecast (2025, short-term LNDX investment outlook)
- Conservative forecast: $0.0157 - $0.0249
- Neutral forecast: $0.0249 - $0.0329
- Optimistic forecast: $0.0329 - $0.0379
Mid-term Investment Outlook (2026-2028, mid-term LandX Finance(LNDX) investment forecast)
- Market stage expectation: Gradual recovery phase with increasing protocol adoption and Layer 2 integration expansion
- Investment return forecast:
- 2026: $0.0165 - $0.0387 (16% potential growth)
- 2027: $0.0291 - $0.0487 (35% potential growth)
- 2028: $0.0375 - $0.0532 (65% potential growth)
- Key catalysts: Enhanced cross-chain functionality through LayerZero partnerships, increased DeFi accessibility, growing user adoption on Arbitrum and Optimism ecosystems, smart contract optimization and network application improvements
Long-term Investment Outlook (Is LNDX a good long-term investment?)
- Base scenario: $0.0455 - $0.0770 (2030, assuming steady mainstream adoption and stable market conditions)
- Optimistic scenario: $0.0770 - $0.1200 (2030, assuming accelerated DeFi accessibility adoption and strong ecosystem growth)
- Risk scenario: $0.0300 - $0.0450 (2030, under market contraction or reduced user engagement conditions)
View LNDX long-term investment and price forecast: Price Prediction
2025-12-31 to 2030-12-31 Long-term Outlook
- Base scenario: $0.0455 - $0.0770 USD (corresponding to steady progress in protocol development and gradual mainstream application expansion)
- Optimistic scenario: $0.0770 - $0.1200 USD (corresponding to large-scale DeFi adoption and favorable market environment)
- Transformative scenario: $0.1500 USD and above (should the ecosystem achieve breakthrough developments and mainstream proliferation)
- 2030-12-31 forecasted high: $0.0770 USD (based on optimistic development assumptions)
Disclaimer: This analysis is based on historical data and available forecasts. Cryptocurrency markets are highly volatile and unpredictable. Past performance does not guarantee future results. Investors should conduct their own research and consult financial advisors before making investment decisions. This content does not constitute investment advice.
| 年份 |
预测最高价 |
预测平均价格 |
预测最低价 |
涨跌幅 |
| 2025 |
0.0328812 |
0.02491 |
0.0156933 |
0 |
| 2026 |
0.038720104 |
0.0288956 |
0.016470492 |
16 |
| 2027 |
0.04868330688 |
0.033807852 |
0.02907475272 |
35 |
| 2028 |
0.0532067974776 |
0.04124557944 |
0.0375334772904 |
65 |
| 2029 |
0.065172140073144 |
0.0472261884588 |
0.045809402805036 |
89 |
| 2030 |
0.076992855044381 |
0.056199164265972 |
0.045521323055437 |
125 |
LandX Finance (LNDX) Research Report
I. Project Overview
Project Name: LandX Finance
Token Symbol: LNDX
Blockchain: Ethereum (ERC20)
Contract Address: 0x08A1C30BBB26425c1031ee9E43FA0B9960742539
Official Website: https://landx.fi
Current Ranking: 3,628
Project Description
LandX represents a significant advancement in blockchain technology with its open-source code deployed on the Ethereum mainnet. The project is collaborating with industry leaders including LayerZero, Arbitrum, and Optimism to leverage cutting-edge Layer 2 solutions. The platform emphasizes user experience through intelligently designed smart contracts and web applications that provide seamless, intuitive blockchain interactions, aiming to revolutionize DeFi accessibility and efficiency.
II. Market Data Analysis
Token Economics
| Metric |
Value |
| Current Price |
$0.02496 |
| Market Cap |
$328,891.63 |
| Fully Diluted Valuation |
$1,747,528.22 |
| Circulating Supply |
13,176,747.82 LNDX |
| Total Supply |
70,013,149.65 LNDX |
| Maximum Supply |
80,000,000 LNDX |
| Circulation Ratio |
16.47% |
| Token Holders |
2,431 |
| Period |
Change |
| 1 Hour |
+0.20% |
| 24 Hours |
+0.93% |
| 7 Days |
-1.54% |
| 30 Days |
-7.59% |
| 1 Year |
-91.41% |
Historical Price Points
- All-Time High: $7.14676 (December 15, 2023)
- All-Time Low: $0.02294 (December 19, 2025)
- 24-Hour Range: $0.02427 - $0.02611
Trading Activity
- 24-Hour Volume: $13,409.26
- Market Dominance: 0.000055%
- Trading Exchanges: Available on 1 major exchange
III. Technical Architecture
Network Infrastructure
LandX operates as an ERC20 token on the Ethereum mainnet with strategic partnerships extending its capabilities across multiple Layer 2 solutions. The integration with LayerZero, Arbitrum, and Optimism enables cross-chain functionality and improved scalability for DeFi applications.
Development Resources
IV. Investment Strategy and Risk Management
Investment Methodology
- Long-Term Holding (HODL): Suitable for investors with extended time horizons who believe in the project's Layer 2 scaling vision and DeFi accessibility objectives
- Active Trading: Dependent on technical analysis given the token's high volatility and limited trading volume
Risk Management Considerations
- Asset Allocation: Given the token's speculative nature and low market capitalization, allocation should be conservative, representing a minimal percentage of overall investment portfolios
- Diversification: Integration into multi-asset portfolios recommended to mitigate concentration risk
- Secure Storage: Use of hardware wallets or established custodial solutions appropriate for long-term holdings
V. Investment Risks and Challenges
Market Risk
- Extreme Volatility: The token has experienced a 91.41% depreciation over the past year, with the price declining from an all-time high of $7.14676 to current levels below $0.03
- Low Liquidity: Daily trading volume of approximately $13,400 indicates limited market depth and potential slippage on substantial orders
Liquidity Risk
- Small Token Holder Base: With only 2,431 holders, the token exhibits concentration risk
- Market Capitalization Concerns: Total market cap of $328,891.63 represents an extremely small market, susceptible to rapid price movements
Regulatory Risk
- Policy Uncertainty: Regulatory treatment of DeFi tokens and Layer 2 solutions remains uncertain across different jurisdictions
Technical Risk
- Smart Contract Security: Dependence on code security and successful Layer 2 integration implementation
- Network Dependency: Reliance on Ethereum, LayerZero, and other partner networks' stability and development
VI. Conclusion: Is LNDX a Good Investment?
Investment Value Assessment
LandX Finance operates in the DeFi infrastructure space with a focus on Layer 2 scalability and user experience. However, the project currently demonstrates significant market challenges:
- The 91.41% annual decline from all-time highs indicates substantial losses for early investors
- Extremely low market liquidity ($13,400 daily volume) presents practical obstacles to position entry and exit
- Concentrated token distribution among 2,431 holders raises sustainability concerns
- The project remains speculative with limited demonstrated adoption metrics
Investor Recommendations
⚠️ General Caution: Given the extreme volatility, low liquidity, and significant price depreciation, LNDX represents a high-risk asset suitable only for investors with substantial risk tolerance.
For Different Investor Types:
- Retail/New Investors: Extreme caution advised; if considering exposure, use only minimal allocations with capital preservation as priority
- Experienced Traders: Position sizing should reflect the limited liquidity and high volatility profile; stop-loss orders essential
- Institutional Investors: The token's market capitalization and liquidity constraints make it unsuitable for significant institutional allocation
Final Disclaimer
⚠️ Risk Disclosure: Cryptocurrency investments carry substantial risk, including potential total loss of capital. This report is provided for informational purposes only and does not constitute investment advice, financial recommendation, or solicitation to purchase. Investors should conduct independent research and consult qualified financial advisors before making investment decisions. Past performance does not guarantee future results.
Report Generated: December 31, 2025
Data Source: Market Data as of 2025-12-31 04:21:08 UTC
LandX Finance (LNDX) Frequently Asked Questions
I. What is LandX Finance (LNDX) and what are its core functions?
Answer: LandX Finance (LNDX) is a blockchain-based project deployed on the Ethereum mainnet as an ERC-20 token. Launched in December 2023, it focuses on revolutionizing DeFi accessibility and efficiency through user-friendly design. The project collaborates with industry leaders including LayerZero, Arbitrum, and Optimism to implement cutting-edge Layer 2 solutions. LNDX emphasizes seamless smart contract design and intuitive web applications that set new standards for blockchain user experience while improving operational efficiency in decentralized finance.
Answer: As of December 31, 2025, LNDX is trading at $0.02496 with a market capitalization of $328,891.63 and a fully diluted valuation of $1,747,528.22. The token has experienced significant price decline, falling 91.41% over the past year and approximately 99.68% from its all-time high of $7.14676 (December 15, 2023). Current 24-hour trading volume is approximately $13,409.26 with 2,431 token holders. The circulating supply represents 16.47% of the maximum supply of 80 million tokens, with 83.53% still unlocked.
III. What are the main investment risks associated with LNDX?
Answer: Key investment risks include: (1) severe price depreciation of 91.41% annually and 99.68% from all-time highs; (2) extremely limited trading liquidity at approximately $13,400 daily volume, restricting entry and exit opportunities; (3) small market capitalization of $328,891.63 making the asset susceptible to rapid price movements; (4) significant unlocked token supply (83.53% not yet in circulation) creating potential dilution pressure; (5) concentrated holder base of only 2,431 addresses; (6) bearish technical indicators; and (7) project remains in early maturity cycle with unproven mainstream adoption.
IV. What are the price forecasts for LNDX in the mid to long-term?
Answer: According to available forecasts, LNDX price projections include: Short-term (2025): $0.0157-$0.0379; Mid-term: 2026 ($0.0165-$0.0387 with 16% potential growth), 2027 ($0.0291-$0.0487 with 35% potential growth), 2028 ($0.0375-$0.0532 with 65% potential growth); Long-term (2030): Base scenario $0.0455-$0.0770, Optimistic scenario $0.0770-$0.1200. These forecasts assume factors such as increased Layer 2 integration, expanded DeFi accessibility adoption, and growing user engagement on Arbitrum and Optimism ecosystems, though past performance does not guarantee future results.
V. Is LNDX suitable for retail investors and what allocation strategy is recommended?
Answer: LNDX represents a high-risk, speculative asset suitable only for investors with substantial risk tolerance and the ability to afford potential total capital loss. Retail and new investors should exercise extreme caution; if considering exposure, allocations should be minimal and viewed as speculative positions with capital preservation as priority. The token's limited liquidity ($13,400 daily volume), extreme volatility, and severe historical price depreciation make it unsuitable for significant portfolio allocation. Risk management strategies should include conservative position sizing, use of stop-loss orders, and portfolio diversification to mitigate concentration risk.
VI. What is the technological foundation and cross-chain capability of LNDX?
Answer: LNDX operates on the Ethereum mainnet utilizing the ERC-20 token standard with contract address 0x08A1C30BBB26425c1031ee9E43FA0B9960742539. The project implements cutting-edge Layer 2 solutions through partnerships with LayerZero for interoperability protocols and integrations with Arbitrum and Optimism for improved scalability. The platform emphasizes user experience through intelligently designed smart contracts and web applications providing seamless blockchain interaction. Open-source code is available on GitHub, enabling community review and development oversight.
VII. What factors should investors research before making LNDX investment decisions?
Answer: Prospective investors should conduct comprehensive independent research including: (1) detailed review of the Whitepaper available at https://landx.gitbook.io/landx/whitepaper/download-whitepaper; (2) examination of GitHub smart contract code at https://github.com/LandXit/land-x-smart-contracts for security assessment; (3) evaluation of Layer 2 partnership effectiveness with LayerZero, Arbitrum, and Optimism; (4) analysis of community engagement through official Twitter (@landxfinance) and project developments; (5) assessment of token economics and supply dynamics; (6) comparison with competing DeFi accessibility solutions; and (7) consultation with qualified financial advisors. This diligence is essential given the project's high-risk profile and speculative nature.
Disclaimer: This FAQ content is provided for informational purposes only and does not constitute investment advice, financial recommendation, or solicitation to purchase. Cryptocurrency markets are highly volatile and unpredictable. Investors should conduct independent research and consult qualified financial advisors before making investment decisions. Past performance does not guarantee future results. Total loss of capital is possible.
* The information is not intended to be and does not constitute financial advice or any other recommendation of any sort offered or endorsed by Gate.