# NAOS Finance (NAOS) Investment Guide: Comprehensive Risk and Return Analysis
## Introduction
NAOS Finance is a decentralized lending protocol connecting DeFi lenders with SME borrowers through automated on-chain and off-chain mechanisms. This comprehensive analysis examines NAOS's investment viability, evaluating its 94.88% historical depreciation from $3.44 peak, current $0.0017653 valuation, extreme illiquidity ($12,334 daily volume), and significant supply dilution risks. Designed for investors, traders, and institutions, this guide provides market performance assessment, risk frameworks, price forecasts through 2031, and security best practices via Gate exchange platforms. Whether exploring recovery potential or assessing high-risk opportunities, readers gain data-driven insights into NAOS's market positioning, structural challenges, and investment suitability across conservative to aggressive portfolio allocations.
---
**Article Structure Overview:**
**Market Assessment** — Current valuation metri
Introduction: NAOS Finance (NAOS) Investment Position and Market Prospects
NAOS Finance is an important asset in the cryptocurrency sector. As of January 2026, NAOS has a market capitalization of approximately $386,913, with a circulating supply of around 84,222,893 tokens. The current price is maintained at approximately $0.0017653. Positioned as a DeFi lending bridge connecting lenders and small-to-medium enterprise borrowers on the blockchain, NAOS Finance has gradually become a focal point when investors discuss the investment potential of decentralized lending solutions. The token operates across multiple blockchain networks including Ethereum and Binance Smart Chain, demonstrating its infrastructure flexibility.
NAOS Finance facilitates permissionless interaction between DeFi lenders and SME borrowers on the blockchain, enabling loan issuance and financing. The protocol combines on-chain and off-chain mechanisms to provide lenders with stable recurring income streams while working toward the full automation of real-world assets as part of an end-to-end lending process.
This article provides a comprehensive analysis of NAOS's investment value, historical price performance, future price forecasting, and investment risks to offer investors an informed perspective on this emerging DeFi lending protocol.
NAOS Finance (NAOS) Cryptocurrency Research Report
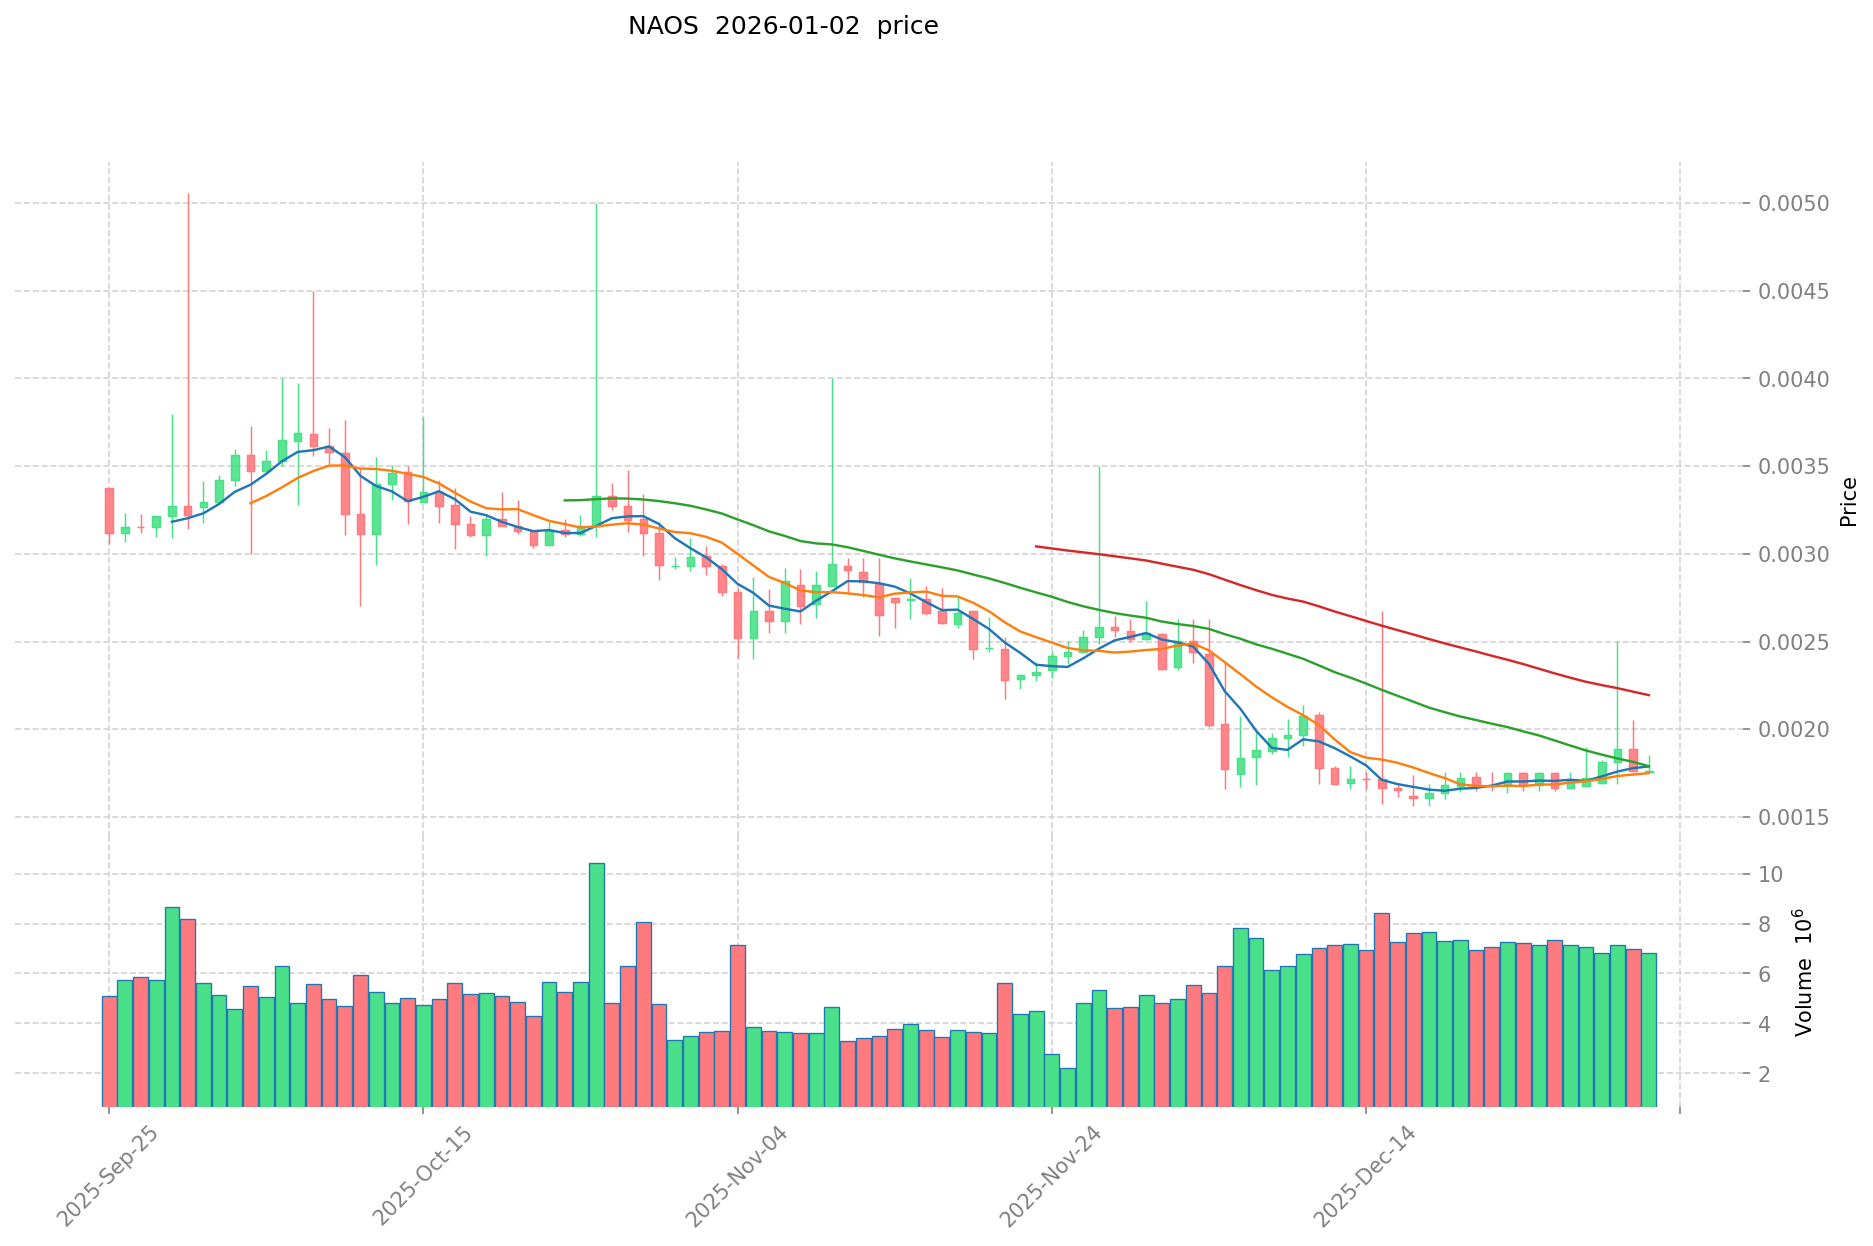
NAOS Historical Price Trends and Investment Returns
- May 13, 2021: All-Time High (ATH) reached at $3.44 per token, representing peak market valuation during the 2021 DeFi boom cycle
- April 9, 2025: All-Time Low (ATL) recorded at $0.00104796 per token, indicating significant depreciation from peak valuations
- Long-term Performance: From ATH to current levels represents a -94.88% decline from historical peak, reflecting substantial capital losses for early investors
Current NAOS Market Status (January 2, 2026)
| Metric |
Value |
| Current Price |
$0.0017653 |
| 24-Hour Change |
-2.44% |
| 7-Day Change |
+3.59% |
| 30-Day Change |
-30.36% |
| 1-Year Change |
-53.54% |
| Market Capitalization |
$386,913.41 |
| Circulating Supply |
84,222,892.66 NAOS |
| Total Supply |
219,177,144.66 NAOS |
| Maximum Supply |
300,000,000 NAOS |
| Fully Diluted Valuation |
$386,913.41 |
| 24-Hour Trading Volume |
$12,334.35 |
| Market Ranking |
#4462 |
| Holder Count |
2,265 addresses |
| Circulating Supply Ratio |
28.07% |
Circulating supply represents approximately 28% of total supply, with significant dilution potential from remaining unminted tokens.
II. Project Overview
Core Protocol Description
NAOS Finance is a decentralized finance (DeFi) lending protocol designed to facilitate permissionless interactions between DeFi lenders and small-to-medium enterprise (SME) borrowers on the blockchain. The protocol bridges on-chain and off-chain finance by automating end-to-end loan issuance and financing processes.
Key Protocol Functions
- Permissionless Lending: Enables DeFi participants to interact directly without intermediaries or permission requirements
- Stable Income Generation: Provides lenders with consistent and predictable income streams from lending activities
- Real-World Asset Integration: Aims to fully automate and tokenize real-world assets as components of the loan origination workflow
- Cross-Chain Deployment: NAOS token operates on multiple blockchain networks including Ethereum (ETH) and Binance Smart Chain (BSC)
Smart Contract Addresses
| Network |
Contract Address |
Explorer Link |
| Ethereum (ETH) |
0x4a615bb7166210cce20e6642a6f8fb5d4d044496 |
Etherscan |
| Binance Smart Chain (BSC) |
0x758d08864fb6cce3062667225ca10b8f00496cc2 |
BscScan |
III. Token Distribution and Supply Dynamics
Supply Structure Analysis
| Supply Metric |
Value |
Percentage |
| Circulating Supply |
84,222,892.66 |
28.07% |
| Total Supply |
219,177,144.66 |
73.06% |
| Maximum Supply |
300,000,000 |
100.00% |
| Remaining Unminted |
80,822,855.34 |
26.94% |
Key Supply Observations
- Significant Dilution Risk: Over 71% of maximum supply remains unissued, creating potential for substantial token dilution upon future minting events
- Circulating Supply Ratio: Only 28.07% of total supply currently in circulation
- Vesting Schedule: The substantial gap between circulating and total supply suggests ongoing token release mechanisms
IV. Recent Price Action and Market Sentiment
Short-Term Price Dynamics
| Time Period |
Price Change |
Status |
| 1-Hour |
+0.10% |
Slight upward pressure |
| 24-Hour |
-2.44% |
Mild downward pressure |
| 7-Day |
+3.59% |
Modest recovery |
| 30-Day |
-30.36% |
Significant deterioration |
| 1-Year |
-53.54% |
Substantial underperformance |
Valuation Metrics
- Market Dominance: 0.000012% of total cryptocurrency market capitalization
- Market Cap to FDV Ratio: 28.07% (significant variance between current and fully diluted valuations)
- 24-Hour High: $0.001854
- 24-Hour Low: $0.0017561
Market emotion indicator: 1 (on specified scale)
V. On-Chain Distribution
Token Holder Concentration
- Total Holders: 2,265 unique addresses
- Holder Base Size: Relatively small distribution compared to major DeFi protocols, suggesting limited retail adoption
Network Activity
- Primary Exchanges: NAOS is listed on Gate and potentially other exchanges
- Cross-Chain Presence: Token deployed on both Ethereum and BSC networks to maximize liquidity and accessibility
Official Channels
VII. Risk Considerations
Market and Liquidity Risks
- Extremely Low Trading Volume: 24-hour volume of $12,334.35 indicates severe liquidity constraints and wide bid-ask spreads
- High Volatility: -53.54% annual decline demonstrates substantial price depreciation
- Small Holder Base: Only 2,265 token holders suggests concentrated ownership and limited market depth
- Extreme Valuation Decline: 94.88% loss from all-time high reflects significant loss of market confidence
Supply and Dilution Risks
- Unissued Token Supply: 80.8 million unminted tokens (26.94% of maximum supply) create future dilution potential
- Supply Inflation: Additional token releases could further depress prices given current trading volumes
VIII. Summary
As of January 2, 2026, NAOS Finance operates as a small-cap DeFi protocol with limited liquidity and market presence. The project has experienced substantial value depreciation from its 2021 peak, with significant technical and fundamental challenges including minimal trading activity, limited holder distribution, and substantial unissued token supply. The protocol's core permissionless lending functionality remains theoretically viable, but practical adoption and market traction remain to be demonstrated.
Last Updated: January 2, 2026, 14:19:38 UTC
NAOS Finance (NAOS) Investment Analysis Report
I. Executive Summary
NAOS Finance is a decentralized finance protocol designed to facilitate lending interactions between DeFi lenders and small-to-medium enterprise borrowers on the blockchain. As of January 2, 2026, NAOS trades at $0.0017653 with a market capitalization of $148,678.67 and a fully diluted valuation of $386,913.41. The token demonstrates significant challenges, with a 53.54% decline over the past year and a 30.36% decline over the past month.
II. Core Factors Influencing NAOS Finance as an Investment
Supply Mechanism and Scarcity
The NAOS token operates under a defined supply structure:
- Current circulating supply: 84,222,892.66 NAOS
- Total supply: 219,177,144.66 NAOS
- Maximum supply: 300,000,000 NAOS
- Circulation ratio: 28.07%
The token maintains significant room for supply expansion, with circulating tokens representing only 28.07% of maximum supply. This dilution potential presents a structural headwind for price appreciation, as future token releases could pressure valuations.
Market Positioning and Adoption
NAOS Finance ranks 4,462nd by market capitalization among cryptocurrencies, with only 2,265 token holders. This limited holder base reflects weak institutional and retail adoption relative to established DeFi protocols. The project's adoption metrics suggest nascent market penetration and limited ecosystem integration.
- All-time high: $3.44 (May 13, 2021)
- All-time low: $0.00104796 (April 9, 2025)
- Current price represents a 99.9% decline from peak
- 24-hour price change: -2.44%
- 7-day price change: +3.59%
- 30-day price change: -30.36%
- 1-year price change: -53.54%
The severe historical drawdown from peak valuations indicates substantial value destruction since the 2021 bull market. Recent price volatility demonstrates ongoing downward pressure despite modest intra-week rebounds.
Trading Liquidity
- 24-hour trading volume: $12,334.35
- Market cap to volume ratio indicates limited liquidity depth
Low trading volumes relative to market capitalization suggest potential challenges in executing large position changes without significant price impact. This liquidity constraint may deter institutional participation and increase execution costs.
III. Technical Infrastructure
NAOS Finance operates on multiple blockchain networks:
| Blockchain |
Contract Address |
Network |
| Ethereum (ETH) |
0x4a615bb7166210cce20e6642a6f8fb5d4d044496 |
Primary |
| Binance Smart Chain (BSC) |
0x758d08864fb6cce3062667225ca10b8f00496cc2 |
Secondary |
Cross-chain deployment provides accessibility across major DeFi ecosystems, though utilization metrics suggest limited ecosystem integration.
IV. Project Overview
NAOS Finance aims to facilitate permissionless lending between DeFi participants and real-world borrowers by combining on-chain and off-chain elements. The protocol targets automated real-world asset (RWA) integration as part of end-to-end lending processes.
Community Resources:
V. Risk Assessment
Negative Indicators
- Extreme price depreciation from historical peaks suggests market consensus regarding valuation concerns
- Minimal holder concentration (2,265 addresses) creates vulnerability to liquidity shocks
- Bearish technical forecasts cited in market analysis
- Declining 30-day and annual performance metrics
Volatility Patterns
The token exhibits high volatility with minimal directional bias, as evidenced by contradictory short-term movements (1-hour: +0.10%, 24-hour: -2.44%, 7-day: +3.59%).
VI. Conclusion
NAOS Finance presents significant structural and performance headwinds for potential investors. The project combines limited market adoption, substantial historical value destruction, minimal liquidity, and bearish technical sentiment. The undefined timeline for protocol revenue generation and ecosystem adoption creates prolonged uncertainty regarding fundamental value drivers.
Report Date: January 2, 2026
Data Source: Gate Crypto Research
Disclaimer: This analysis is provided for informational purposes only and does not constitute investment advice.
III. NAOS Finance Future Investment Predictions and Price Outlook (Is NAOS Finance(NAOS) worth investing in 2026-2031)
Short-term Investment Prediction (2026, short-term NAOS investment outlook)
- Conservative forecast: $0.001041 - $0.001765
- Neutral forecast: $0.001765 - $0.002365
- Optimistic forecast: $0.002365 and above
Mid-term Investment Outlook (2027-2029, mid-term NAOS Finance(NAOS) investment forecast)
- Market stage expectation: Token entering recovery phase with gradual adoption expansion in DeFi lending sector
- Investment return predictions:
- 2027: $0.001631 - $0.002581 (17% potential upside)
- 2028: $0.002184 - $0.003090 (31% potential upside)
- 2029: $0.002544 - $0.003464 (53% potential upside)
- Key catalysts: Ecosystem development progress, DeFi lending market adoption, strategic partnerships, and protocol upgrades
Long-term Investment Outlook (Is NAOS Finance a good long-term investment?)
- Base case: $0.003085 - $0.004227 (2030-2031 horizon, assuming steady market conditions and moderate adoption growth)
- Optimistic case: $0.004278 - $0.005000+ (assuming accelerated DeFi ecosystem adoption and expanded real-world asset tokenization)
- Risk case: $0.001500 - $0.002000 (under adverse market conditions, regulatory headwinds, or competitive pressures)
Click to view NAOS long-term investment and price forecast: Price Prediction
2026-2031 Long-term Outlook
- Base case: $0.002365 - $0.004227 USD (corresponding to steady adoption and mainstream application growth)
- Optimistic case: $0.004227 - $0.005500 USD (corresponding to large-scale adoption and favorable market environment)
- Transformative case: $0.006000 USD and above (if ecosystem achieves breakthrough progress and mainstream adoption)
- 2031-12-31 predicted high: $0.004278 USD (based on optimistic development assumptions)
Disclaimer: This analysis is based on historical data and market trends without guarantees of accuracy. Past performance does not indicate future results. Investors should conduct independent research and consult financial advisors before making investment decisions.
| 年份 |
预测最高价 |
预测平均价格 |
预测最低价 |
涨跌幅 |
| 2026 |
0.002365502 |
0.0017653 |
0.001041527 |
0 |
| 2027 |
0.00258175125 |
0.002065401 |
0.00163166679 |
17 |
| 2028 |
0.00309035624625 |
0.002323576125 |
0.0021841615575 |
31 |
| 2029 |
0.0034649167176 |
0.002706966185625 |
0.002544548214487 |
53 |
| 2030 |
0.004227739788709 |
0.003085941451612 |
0.001851564870967 |
74 |
| 2031 |
0.004278503525588 |
0.00365684062016 |
0.003144882933338 |
107 |
NAOS Finance (NAOS) Crypto Investment Report
Report Date: January 2, 2026
Data Source: Gate Crypto Research
Asset: NAOS Finance (NAOS)
I. Project Overview
NAOS Finance is a decentralized finance (DeFi) platform designed to facilitate interactions between DeFi lenders and small and medium-sized enterprise (SME) borrowers on the blockchain without permission requirements. The platform enables loan issuance and financing while combining on-chain and off-chain mechanisms.
The core objective of NAOS Finance is to fully automate real-world assets and integrate them as part of an end-to-end lending process, providing stable and regular income flows for lenders.
Token Specifications
| Metric |
Value |
| Token Symbol |
NAOS |
| Current Price |
$0.0017653 |
| Market Cap Rank |
4,462 |
| Circulating Supply |
84,222,892.66 NAOS |
| Total Supply |
219,177,144.66 NAOS |
| Maximum Supply |
300,000,000 NAOS |
| Circulating Ratio |
28.07% |
| Market Cap |
$148,678.67 |
| Fully Diluted Valuation (FDV) |
$386,913.41 |
Blockchain Networks
NAOS token operates on multiple blockchain networks:
- Ethereum (ETH): Contract Address: 0x4a615bb7166210cce20e6642a6f8fb5d4d044496
- Binance Smart Chain (BSC): Contract Address: 0x758d08864fb6cce3062667225ca10b8f00496cc2
Price Dynamics
Current Price Movement:
- 1-Hour Change: +0.10%
- 24-Hour Change: -2.44%
- 7-Day Change: +3.59%
- 30-Day Change: -30.36%
- 1-Year Change: -53.54%
Historical Price Levels:
- All-Time High (ATH): $3.44 (May 13, 2021)
- All-Time Low (ATL): $0.00104796 (April 9, 2025)
- 24-Hour High: $0.001854
- 24-Hour Low: $0.0017561
Trading Metrics
| Metric |
Value |
| 24-Hour Trading Volume |
$12,334.35 |
| Market Dominance |
0.000012% |
| Total Holders |
2,265 |
| Market Emotion Index |
Neutral (1) |
Price Depreciation Context
NAOS has experienced significant depreciation from its peak. The token has declined approximately 99.95% from its all-time high of $3.44, and notably dropped 30.36% over the past month, indicating substantial downward price pressure.
III. Investment Strategy and Risk Management
Investment Methodology
Long-term Holding (HODL NAOS):
- Suitable for investors with high risk tolerance
- Requires conviction in platform development and adoption
- Appropriate for those believing in real-world asset automation and DeFi lending mechanisms
Active Trading:
- Dependent on technical analysis and price volatility patterns
- Given the highly volatile price history, traders should employ strict stop-loss mechanisms
- Short-term price swings may present tactical opportunities
Risk Management Framework
Asset Allocation Proportions:
- Conservative Investors: Limit NAOS allocation to <1% of overall portfolio due to extremely high volatility and low market cap
- Aggressive Investors: 1-3% allocation with appropriate risk hedging
- Institutional Investors: Requires comprehensive due diligence on project fundamentals, team background, and regulatory status
Risk Mitigation Strategies:
- Portfolio Diversification: Combine with established cryptocurrencies and traditional assets
- Position Sizing: Limit exposure given the token's small market cap ($148K) and illiquidity
- Hedging Instruments: Consider inverse positions or stablecoins for protection
Secure Storage Recommendations:
- Hot Wallets: MetaMask or Trust Wallet for small, frequently-traded amounts
- Cold Storage: Hardware wallets (Ledger, Trezor) recommended for long-term holdings
- Best Practice: Multi-signature wallets for larger positions to prevent unauthorized access
IV. Investment Risks and Challenges
Market Risk
- Extreme Volatility: 99.95% depreciation from ATH demonstrates severe price instability
- Illiquidity Risk: Low 24-hour trading volume ($12K) creates significant slippage for large trades
- Small Market Cap: $148K market cap indicates susceptibility to price manipulation and sudden value loss
Regulatory Risk
- Varying regulatory frameworks across jurisdictions where NAOS operates
- Potential restrictions on DeFi lending activities in certain markets
- Uncertainty regarding classification of tokenized real-world assets
Technology Risk
- Smart contract vulnerabilities on both Ethereum and BSC networks
- Platform adoption and scaling challenges for real-world asset integration
- Competition from established DeFi lending platforms with stronger network effects
Project Execution Risk
- Limited information on team credentials and development progress
- Unclear roadmap for achieving platform objectives
- Challenges in bridging on-chain and off-chain asset automation
V. Conclusion: Is NAOS Finance a Good Investment?
Investment Value Assessment
NAOS Finance operates in the high-risk, high-reward segment of the cryptocurrency market. The platform's concept of automating real-world assets for DeFi lending presents theoretical long-term value, yet the project faces substantial headwinds:
- Significant price depreciation (-53.54% year-over-year) reflects market skepticism
- Minimal market capitalization and trading volume indicate limited adoption
- Concentration among 2,265 holders suggests limited distribution
Investor Recommendations
✅ Beginner Investors:
- If considering NAOS, limit allocation to <0.5% of portfolio
- Employ dollar-cost averaging over extended periods rather than lump-sum investment
- Prioritize secure storage via reputable hardware wallets
- Focus on learning project fundamentals before committing capital
✅ Experienced Investors:
- Implement strict technical analysis-based entry and exit signals
- Maintain tight stop-losses given historical volatility
- Consider tactical positions during significant support level tests
- Ensure positions represent only 1-2% of overall crypto holdings
✅ Institutional Investors:
- Conduct comprehensive due diligence on core team, technological architecture, and legal structure
- Evaluate regulatory compliance status across target markets
- Assess competitive positioning against established DeFi lending platforms
- Consider position sizing relative to illiquidity and price impact
Risk Warning
⚠️ Important Disclaimer: Cryptocurrency investments carry substantial risk. NAOS Finance specifically demonstrates extreme volatility, limited liquidity, and uncertain project development trajectory. This report provides information for educational purposes only and does not constitute investment advice, financial recommendation, or endorsement of NAOS as an investment vehicle. Investors must conduct independent research and consult with qualified financial advisors before making investment decisions.
Last Updated: January 2, 2026
Data Accuracy: As of report date; market conditions subject to rapid change
NAOS Finance (NAOS) Cryptocurrency Investment Report - FAQ
I. Project Overview and Fundamentals
Q1: What is NAOS Finance and what problem does it solve in the DeFi ecosystem?
A: NAOS Finance is a decentralized finance (DeFi) lending protocol that bridges on-chain and off-chain finance by facilitating permissionless interactions between DeFi lenders and small-to-medium enterprise (SME) borrowers. The protocol enables automated loan issuance and financing while working toward full automation of real-world assets (RWA) as part of end-to-end lending processes. It provides lenders with stable, recurring income streams while addressing the gap between traditional finance and decentralized lending markets.
Q2: On which blockchain networks does NAOS operate, and how do I access the token?
A: NAOS operates on two major blockchain networks: Ethereum (ETH) with contract address 0x4a615bb7166210cce20e6642a6f8fb5d4d044496, and Binance Smart Chain (BSC) with contract address 0x758d08864fb6cce3062667225ca10b8f00496cc2. You can access NAOS through major cryptocurrency exchanges including Gate, or by directly interacting with smart contracts through Web3 wallets such as MetaMask or Trust Wallet.
Q3: What is the current market status of NAOS, and how has its price performed historically?
A: As of January 2, 2026, NAOS trades at approximately $0.0017653 with a market capitalization of $148,678.67 and a fully diluted valuation of $386,913.41. Historically, NAOS reached an all-time high of $3.44 on May 13, 2021, and an all-time low of $0.00104796 on April 9, 2025. The token has declined 94.88% from its peak, demonstrating significant value destruction. Recent performance shows a 53.54% decline over the past year and a 30.36% decline over the past month, indicating sustained downward pressure.
Q4: Why is NAOS's trading volume so low, and what does this mean for investors?
A: NAOS exhibits extremely limited trading volume at approximately $12,334.35 in 24-hour volume, reflecting minimal market liquidity and adoption. This low volume indicates challenges in executing large position changes without significant price impact, creates wide bid-ask spreads, and suggests weak institutional and retail interest. For investors, low liquidity means potential difficulties entering or exiting positions at favorable prices, increased execution costs, and vulnerability to price volatility from relatively small trades.
III. Token Supply and Dilution Risk
Q5: What is the supply structure of NAOS, and what dilution risks should investors consider?
A: NAOS has a defined maximum supply of 300,000,000 tokens. Current circulating supply stands at 84,222,892.66 NAOS (28.07% of maximum supply), with total supply at 219,177,144.66 NAOS. This means approximately 80.8 million tokens (26.94% of maximum supply) remain unminted, creating significant dilution potential. Future token releases could substantially depress prices given current low trading volumes. The circulating supply ratio of only 28% suggests ongoing token release mechanisms and vesting schedules that may negatively impact token valuations.
IV. Investment Analysis and Risk Assessment
Q6: Is NAOS Finance a good investment for 2026, and what price targets should I consider?
A: NAOS presents significant risks for most investors given its extreme volatility, minimal market adoption, and substantial historical depreciation. Conservative 2026 price forecasts range from $0.001041 to $0.002365, representing modest upside scenarios. Mid-term forecasts (2027-2029) suggest potential recovery to $0.002581-$0.003464, while long-term outlooks (2030-2031) project $0.003085-$0.005500 under various adoption scenarios. However, these forecasts carry substantial uncertainty given the project's limited market traction and execution risks. Only investors with extremely high risk tolerance and conviction in real-world asset automation should consider positions.
Q7: What are the primary risks associated with investing in NAOS, and how should I manage them?
A: Key risks include extreme price volatility (99.95% depreciation from all-time high), severe illiquidity creating execution challenges, minimal market capitalization susceptible to manipulation, regulatory uncertainty around DeFi lending and tokenized assets, technology risks related to smart contract vulnerabilities, and project execution risks given limited team visibility and unclear development roadmaps. Risk management strategies include: limiting NAOS allocation to less than 1% of overall portfolio, employing dollar-cost averaging rather than lump-sum investment, implementing strict stop-loss orders for trading positions, using secure cold storage for holdings, and diversifying across established cryptocurrencies and traditional assets.
Q8: Should I use a hardware wallet to store NAOS, and what are the security best practices?
A: Yes, hardware wallets (Ledger or Trezor) are recommended for long-term NAOS holdings due to their superior security against hacking and malware. For active trading or small amounts, hot wallets like MetaMask or Trust Wallet provide acceptable convenience-security tradeoffs. Best practices include: using multi-signature wallets for larger positions, enabling two-factor authentication on exchange accounts, never sharing private keys or seed phrases, storing backup seed phrases in secure physical locations, and regularly updating wallet software. Given NAOS's small holder base (2,265 addresses), individual security practices become even more critical as concentrated holdings make attractive targets for cybercriminals.
Report Date: January 2, 2026
Data Source: Gate Crypto Research
Disclaimer: This analysis is provided for informational purposes only and does not constitute investment advice. Cryptocurrency investments carry substantial risk. Investors must conduct independent research and consult qualified financial advisors before making investment decisions.
* The information is not intended to be and does not constitute financial advice or any other recommendation of any sort offered or endorsed by Gate.