# Article Overview: Is Sakai Vault (SAKAI) a Good Investment?
**Sakai Vault (SAKAI) Investment Analysis** examines whether this decentralized perpetual exchange token represents a viable investment opportunity in 2026-2031. This comprehensive guide analyzes SAKAI's price history, market fundamentals, tokenomics, and risk factors to help investors make informed decisions. The article addresses critical questions: Can SAKAI recover from its 96.19% annual decline? What investment returns are realistic? How should different investor profiles approach SAKAI exposure? Through detailed market performance metrics, price projections, and risk assessments, this analysis provides evidence-based reference material for cryptocurrency investors evaluating SAKAI on Gate. Suitable for beginner, experienced, and institutional investors seeking to understand micro-cap DeFi opportunities and perpetual exchange platforms.
Introduction: Sakai Vault (SAKAI) Investment Status and Market Prospects
Sakai Vault (SAKAI) is a decentralized asset in the cryptocurrency market that has established itself as a spot and perpetual exchange platform. As of January 2026, SAKAI maintains a market capitalization of $229,440 with approximately 3.59 million tokens in circulation and a current price of $0.02868. Since its launch in March 2023 at an initial price of $0.503, the token has experienced significant market volatility, reaching an all-time high of $8.8 in January 2024 before declining substantially to its current levels. With 143,015 token holders and a market ranking of 4,867, SAKAI is positioned as a decentralized exchange solution offering low transaction fees and zero price impact trading capabilities.
Sakai Vault distinguishes itself by providing comprehensive market insights ranging from cryptocurrency fundamentals to detailed market analyses, thereby enabling investors to gain valuable perspectives on emerging trends and market developments through its integrated decentralized perpetual exchange infrastructure. As investors increasingly question whether Sakai Vault (SAKAI) represents a viable investment opportunity, this analysis becomes particularly relevant. This article will comprehensively examine SAKAI's investment value proposition, historical price dynamics, future price forecasts, and associated investment risks to provide investors with evidence-based reference material for their decision-making processes.
Sakai Vault (SAKAI) Comprehensive Research Report
I. SAKAI Price History Review and Current Investment Value Assessment
SAKAI Historical Price Trends and Investment Returns
- 2024: January 26 marked the all-time high of $8.8 → Early investors achieved substantial returns
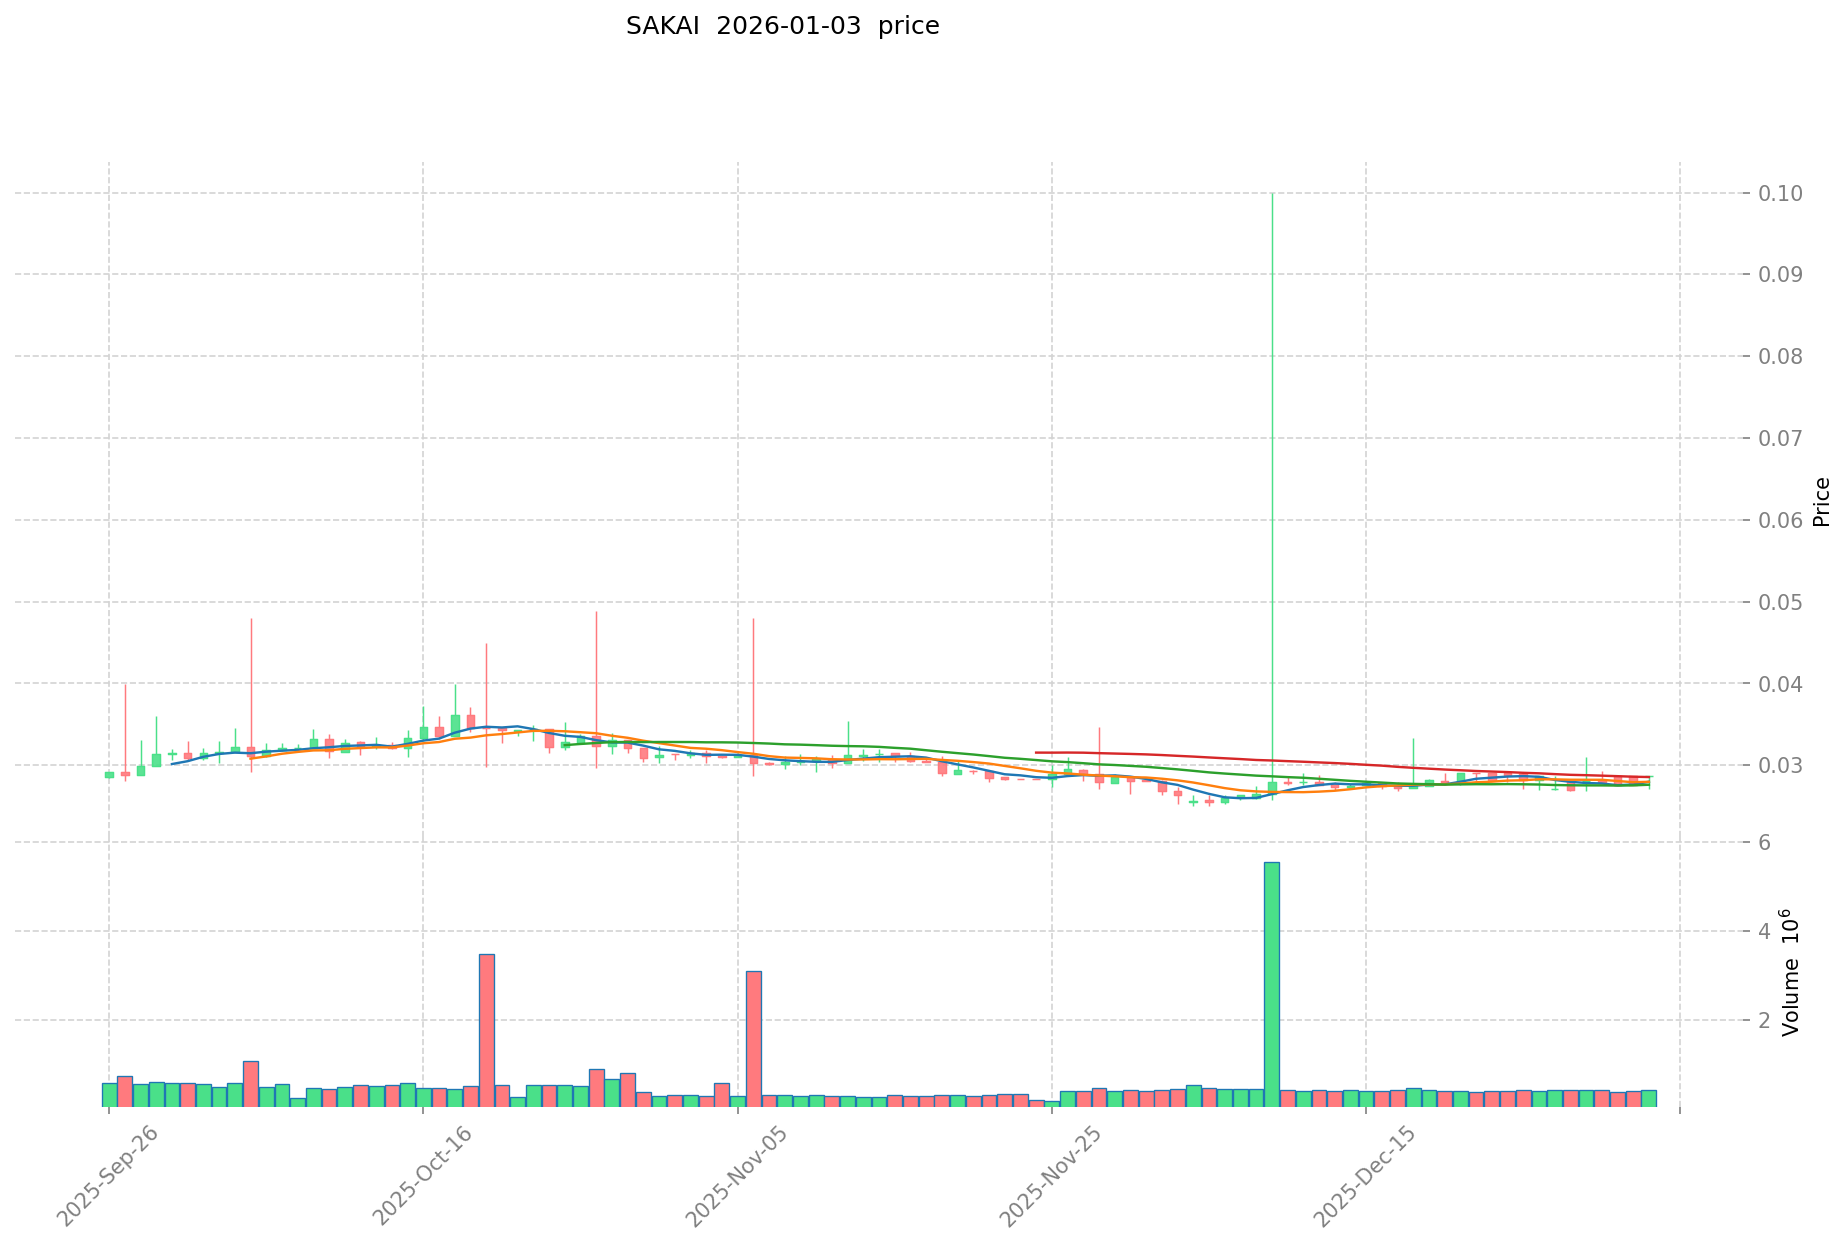
- 2025: Market correction phase → SAKAI price declined from its peak to a low of $0.025 on December 5, 2025
- Current period: Price stabilization near historical lows → From peak to present represents a 99.67% decline over approximately one year
Current SAKAI Investment Market Status (January 3, 2026)
- Current SAKAI Price: $0.02868 (as of January 3, 2026 at 12:20:10 UTC)
- Market Sentiment: Positive (+1 on sentiment index scale)
- 24-Hour Trading Volume: $11,838.58
- Price Movement Indicators:
- 1-hour change: -3.84%
- 24-hour change: +0.03%
- 7-day change: +5.52%
- 30-day change: +11.64%
- 1-year change: -96.19%
Current real-time SAKAI market prices available at Gate SAKAI Price
II. Project Overview and Fundamental Characteristics
Project Description
Sakai Vault is a decentralized spot and perpetual exchange platform that supports low swap fees and zero price impact trades. The protocol offers in-depth coverage of topics ranging from cryptocurrency fundamentals to market analyses, helping investors gain insights on trends and developments through an integrated decentralized perpetual exchange infrastructure.
Token Supply and Circulation Metrics
| Metric |
Value |
| Total Supply |
8,000,000 SAKAI |
| Circulating Supply |
3,593,687.16 SAKAI |
| Circulation Ratio |
44.92% |
| Total Market Capitalization |
$229,440 |
| Circulating Market Value |
$103,066.95 |
| Fully Diluted Valuation |
$229,440 |
| Market Dominance |
0.0000070% |
| Total Token Holders |
143,015 |
Network and Infrastructure
- Blockchain Network: Binance Smart Chain (BSC)
- Contract Address: 0x43b35e89d15b91162dea1c51133c4c93bdd1c4af
- Launch Date: March 13, 2023 (per blockchain records)
- Initial Price: $0.503
- Current Market Ranking: #4,867 by market capitalization
Historical Price Extremes:
- All-Time High (ATH): $8.8 on January 26, 2024
- All-Time Low (ATL): $0.025 on December 5, 2025
- Distance from ATH: 99.67% decline
- Recovery from ATL: 14.72% increase
Short-Term Price Dynamics:
- The 7-day positive momentum of 5.52% indicates recent stabilization following the December low
- 30-day performance of 11.64% reflects gradual recovery trajectory
- 1-hour volatility of -3.84% suggests intraday fluctuations within normal parameters
Market Liquidity Assessment
- 24-Hour Trading Volume: $11,838.58 USD
- Exchange Listings: Available on 1 exchange platform
- Market Liquidity Status: Relatively low trading volume relative to market capitalization, indicating limited liquidity depth
IV. Community and Ecosystem Presence
Official Channels and Resources
Blockchain Explorer
V. Risk Factors and Market Considerations
Significant Price Volatility
The 96.19% negative return over the 1-year period demonstrates extreme price volatility. The token experienced a peak-to-trough decline of 99.67% from its historical high, which represents substantial downside risk exposure for investors.
Liquidity Constraints
With daily trading volume of $11,838.58 relative to a fully diluted market capitalization of $229,440, the asset exhibits limited trading liquidity. This liquidity limitation may result in wider bid-ask spreads and reduced execution certainty during trading operations.
Market Capitalization and Adoption
The project maintains a negligible market dominance of 0.0000070% within the broader cryptocurrency market, indicating minimal mainstream recognition and adoption relative to established protocols.
VI. Disclaimer
This report is provided for informational and research purposes only. The analysis does not constitute investment advice, financial recommendations, or guidance on trading decisions. Cryptocurrency markets are characterized by extreme volatility and substantial risk. Investors should conduct independent research, consult qualified financial advisors, and carefully evaluate their risk tolerance before making any investment decisions.
Report Generated: January 3, 2026
Data Source: Gate Cryptocurrency Database
Sakai Vault (SAKAI) Research Report
Date: January 3, 2026
I. Executive Summary
Sakai Vault (SAKAI) is a decentralized spot and perpetual exchange that supports low swap fees and zero price impact trades. The project provides in-depth analysis ranging from cryptocurrency fundamentals to market analyses, helping investors gain insights on trends and developments through an integrated decentralized perpetual exchange. As of January 3, 2026, SAKAI is trading at $0.02868 with a market capitalization of approximately $103,066.95, representing a market dominance of 0.0000070%.
II. Core Factors Influencing SAKAI as an Investment
Supply Mechanism and Scarcity (SAKAI Investment Scarcity)
Sakai Vault has a maximum supply of 8,000,000 tokens with a current circulating supply of 3,593,687.16 tokens, representing a circulation ratio of 44.92%. The token was published at $0.503 on March 13, 2023. The defined supply cap creates a deflationary structure over time as circulation approaches maximum supply, which historically supports long-term value retention. The scarcity mechanics serve as a foundational element for sustained investment appeal, particularly as adoption of the platform expands.
The historical price trajectory demonstrates significant volatility, with an all-time high of $8.8 achieved on January 26, 2024, and an all-time low of $0.025 recorded on December 5, 2025. The year-over-year performance shows a decline of -96.19%, reflecting substantial downward pressure over the trailing twelve-month period. Recent short-term performance indicates:
- 1-hour change: -3.84%
- 24-hour change: +0.03%
- 7-day change: +5.52%
- 30-day change: +11.64%
Technical Analysis and Market Sentiment
Current technical indicators present mixed signals. The 14-day Relative Strength Index (RSI) indicates overbought conditions at 100, suggesting potential for short-term corrections. Conversely, analysis indicates SAKAI/USDT is part of a strong bullish trend in the 1-hour timeframe, with price currently trading above the 0.027974 USDT support level. The next resistance levels are identified at 0.028454 USDT and 0.028913 USDT.
Trading volume over the past 24 hours totaled $11,838.58, with the current trading pair showing high volatility (ATR14: 0). The token maintains presence on one exchange and has accumulated 143,015 unique holders, indicating moderate community engagement.
Price Prediction Outlook
Market forecasts for SAKAI present divergent scenarios:
- Short-term (2026): Predictions suggest potential movement toward $0.029058
- Medium-term (2028): Some forecasts indicate a potential increase of 193.94%, reaching approximately $0.0963
- Long-term (2030): Optimistic projections suggest rises of 218.72%, potentially reaching $0.091353 in favorable scenarios
However, contrasting bearish forecasts indicate current technical indicators suggest caution, with some analysts projecting prices as low as $0.02692 for end-of-year scenarios.
III. Project Infrastructure and Accessibility
Sakai Vault maintains active development channels through multiple platforms:
- Official Website: https://sakaivault.io/
- Blockchain Explorer: BSC network at 0x43b35e89d15b91162dea1c51133c4c93bdd1c4af
- Documentation: https://docs.sakaivault.io/
- Community Channels: GitHub (https://github.com/SakaiVault), Twitter (@SakaiVault), Telegram (@SakaiVaultAnnounce)
The project operates on the Binance Smart Chain (BSC) network, leveraging this established infrastructure for transaction efficiency and cost optimization.
IV. Risk Considerations
Investors should note several material risk factors:
- Extreme Volatility: The 96.19% annual decline and price fluctuations between $0.025 and $8.8 historically demonstrate exceptional volatility
- Conflicting Forecasts: Technical analysis produces contradictory signals, with both bullish and bearish scenarios presented by different analytical frameworks
- Market Liquidity: Trading volume of approximately $11,838 daily represents relatively modest liquidity on a single exchange
- Market Position: Ranking of 4,867 among cryptocurrencies indicates a micro-cap asset with limited market prominence
V. Disclaimer
This report presents factual information and market analysis based on available data as of January 3, 2026. This analysis does not constitute investment advice, financial guidance, or a recommendation to buy or sell SAKAI tokens. Cryptocurrency markets are highly volatile and subject to significant risks including total loss of capital. Investors should conduct independent research and consult qualified financial advisors before making investment decisions. All price predictions referenced are third-party forecasts with inherent uncertainty and should not be relied upon as reliable indicators of future performance.
III. SAKAI Future Investment Prediction and Price Outlook (Is Sakai Vault(SAKAI) worth investing in 2026-2031)
Short-term Investment Prediction (2026, short-term SAKAI investment outlook)
- Conservative forecast: $0.0152 - $0.0238
- Neutral forecast: $0.0276 - $0.0381
- Optimistic forecast: $0.0381 - $0.0463
Mid-term Investment Outlook (2027-2029, mid-term Sakai Vault(SAKAI) investment forecast)
-
Market phase expectation: SAKAI enters a consolidation and gradual recovery phase with increased volatility. The decentralized exchange sector shows incremental adoption growth, with potential for expanded market participation.
-
Investment return predictions:
- 2027: $0.0167 - $0.0463
- 2028: $0.0300 - $0.0443
- 2029: $0.0239 - $0.0591
-
Key catalysts: Protocol upgrades and ecosystem expansion; mainstream adoption of decentralized perpetual exchanges; integration of advanced trading features; market sentiment shifts in the broader cryptocurrency sector
Long-term Investment Outlook (Is SAKAI a good long-term investment?)
-
Base case scenario: $0.0450 - $0.0646 USD (assuming steady ecosystem development and moderate market expansion through 2031)
-
Optimistic scenario: $0.0646 - $0.0846 USD (corresponding to widespread DeFi adoption and favorable regulatory developments)
-
Risk scenario: $0.0238 - $0.0381 USD (under conditions of market downturn, reduced trading volume, or competitive pressures)
Click to view SAKAI long-term investment and price forecasts: Price Prediction
2026-01-03 to 2031 Long-term Outlook
-
Base case: $0.0505 - $0.0646 USD (corresponding to steady progress in ecosystem adoption and stable platform growth)
-
Optimistic case: $0.0646 - $0.0846 USD (corresponding to large-scale DeFi adoption and favorable market environment)
-
Transformative case: $0.0846 USD and above (reflecting breakthrough ecosystem developments and mainstream market penetration)
-
2031-12-31 Predicted high: $0.0846 USD (based on optimistic development assumptions)
Disclaimer
This analysis is provided for informational purposes only and should not be construed as investment advice. Cryptocurrency markets exhibit significant volatility and unpredictability. Price predictions are based on historical data and analytical models but carry substantial uncertainty. All investors should conduct thorough independent research and consult with qualified financial advisors before making investment decisions. Past performance does not guarantee future results, and actual outcomes may differ materially from projections.
| 年份 |
预测最高价 |
预测平均价格 |
预测最低价 |
涨跌幅 |
| 2026 |
0.0380466 |
0.02757 |
0.0151635 |
-3 |
| 2027 |
0.046259703 |
0.0328083 |
0.016732233 |
14 |
| 2028 |
0.04427808168 |
0.0395340015 |
0.03004584114 |
37 |
| 2029 |
0.0590875186419 |
0.04190604159 |
0.0238864437063 |
46 |
| 2030 |
0.064635878548416 |
0.05049678011595 |
0.045447102104355 |
76 |
| 2031 |
0.084622504118309 |
0.057566329332183 |
0.050082706518999 |
100 |
Sakai Vault (SAKAI) Investment Analysis Report
I. Executive Summary
Sakai Vault is a decentralized spot and perpetual exchange that supports low swap fees and zero price impact trades. The platform provides in-depth analysis ranging from cryptocurrency fundamentals to market trends, helping investors gain insights through an integrated decentralized perpetual trading exchange.
Key Metrics (As of January 3, 2026):
- Current Price: $0.02868
- Market Capitalization: $103,066.95
- Fully Diluted Valuation: $229,440
- 24-Hour Volume: $11,838.58
- Circulating Supply: 3,593,687.16 SAKAI (44.92% of total supply)
- Total Supply: 8,000,000 SAKAI
- Market Ranking: #4867
Price Trends
| Time Period |
Price Change |
Change Amount |
| 1 Hour |
-3.84% |
-$0.001145 |
| 24 Hours |
+0.03% |
+$0.000009 |
| 7 Days |
+5.52% |
+$0.001500 |
| 30 Days |
+11.64% |
+$0.002990 |
| 1 Year |
-96.19% |
-$0.724076 |
Historical Price Levels
- All-Time High: $8.80 (January 26, 2024)
- All-Time Low: $0.025 (December 5, 2025)
- 24-Hour Range: $0.02713 - $0.02869
The token has experienced significant depreciation over the one-year period, with a 96.19% decline from historical highs, indicating substantial volatility and market challenges.
III. Token Economics & On-Chain Metrics
Supply Distribution
- Circulating Supply: 3,593,687.16 SAKAI
- Total Supply: 8,000,000 SAKAI
- Max Supply: 8,000,000 SAKAI
- Circulation Ratio: 44.92%
- Token Holders: 143,015
Blockchain & Technical Details
- Blockchain: Binance Smart Chain (BSC)
- Contract Address: 0x43b35e89d15b91162dea1c51133c4c93bdd1c4af
- Market Share: 0.0000070%
IV. Investment Strategy and Risk Management
Investment Methodology
Long-term Holding (HODL SAKAI)
- Suitable for conservative investors seeking exposure to decentralized exchange platforms
- Requires patience through volatile market cycles
Active Trading
- Relies on technical analysis and short-term price movements
- Appropriate for experienced traders familiar with perpetual exchange dynamics
Risk Management
Asset Allocation Ratios
- Conservative Investors: 1-2% of portfolio allocation
- Aggressive Investors: 3-5% of portfolio allocation
- Institutional Investors: Strategic allocation based on risk tolerance and due diligence
Risk Hedging Solutions
- Multi-asset portfolio diversification with uncorrelated assets
- Utilizing stablecoins for downside protection
- Dollar-cost averaging to mitigate entry price risk
Secure Storage
- Hot wallets: For active trading and liquidity
- Cold Wallets: For long-term holdings and security
- Hardware Wallets: Ledger or Trezor for maximum security for substantial holdings
V. Investment Risks and Challenges
Market Risks
- Extreme Price Volatility: 96.19% year-over-year decline demonstrates significant downside exposure
- Low Trading Volume: $11,838.58 24-hour volume indicates limited liquidity
- Market Manipulation Risk: Low market capitalization increases susceptibility to price manipulation
Regulatory Risks
- Decentralized Exchange Regulatory Uncertainty: Evolving global regulatory frameworks for DEX platforms
- Jurisdictional Compliance Challenges: Varying regulatory treatment across different countries
- Policy Changes: Potential impact on perpetual trading mechanisms and derivative products
Technical Risks
- Smart Contract Vulnerabilities: Risks associated with decentralized platform security
- Network Security: BSC network-level security considerations
- Platform Adoption Risk: User base dependency and competitive landscape pressures
VI. Conclusion: Is SAKAI a Good Investment?
Investment Value Summary
Sakai Vault operates in the decentralized exchange sector with focus on low-cost trading and zero price impact mechanisms. However, the token has experienced severe depreciation (96.19% over one year), declining from $8.80 to current levels near $0.03. This indicates significant market challenges, limited adoption, or fundamental business concerns. The low trading volume and market capitalization present substantial liquidity constraints.
Investor Recommendations
✅ Beginner Investors
- Dollar-cost averaging with minimal portfolio allocation (1-2%)
- Secure storage using reputable hardware wallet solutions
- Focus on understanding the platform fundamentals before increasing exposure
✅ Experienced Traders
- Short-term trading opportunities based on technical support/resistance levels
- Portfolio diversification to limit concentration risk
- Active monitoring of platform developments and trading volume trends
✅ Institutional Investors
- Strategic allocation only after comprehensive due diligence on platform traction
- Assessment of competitive positioning against established DEX platforms
- Monitoring of regulatory developments affecting perpetual trading
Additional Resources
⚠️ Disclaimer: Cryptocurrency investments carry substantial risk, including potential total loss of capital. This report is provided for informational purposes only and does not constitute investment advice, financial recommendation, or solicitation to buy or sell. Investors should conduct independent research and consult with qualified financial advisors before making investment decisions. Past performance does not guarantee future results.
Sakai Vault (SAKAI) Frequently Asked Questions
Q1: What has been SAKAI's historical price performance since launch?
A: Sakai Vault was launched on March 13, 2023, at an initial price of $0.503. The token reached an all-time high of $8.80 on January 26, 2024, representing a 1,650% gain from launch. However, the token subsequently experienced significant depreciation, declining to an all-time low of $0.025 on December 5, 2025. As of January 3, 2026, SAKAI trades at $0.02868, representing a 99.67% decline from its peak and a 96.19% decline over the trailing twelve-month period. This extreme volatility demonstrates the substantial price fluctuations characteristic of micro-cap cryptocurrency assets.
Q2: What does SAKAI's current market position indicate about its adoption and viability?
A: SAKAI maintains a market capitalization of approximately $103,066.95 with a fully diluted valuation of $229,440, ranking 4,867th among cryptocurrencies. The token possesses 143,015 holders with a market dominance of only 0.0000070%. The 24-hour trading volume of $11,838.58 indicates relatively limited liquidity. These metrics collectively suggest SAKAI remains a micro-cap asset with modest mainstream adoption. The low trading volume relative to market capitalization presents challenges for executing large orders without significant price impact.
Q3: Is SAKAI experiencing a recovery trend or continued decline?
A: Recent short-term price movements suggest potential stabilization following the December 2025 low. The 7-day change of +5.52% and 30-day change of +11.64% indicate gradual recovery from the all-time low. However, the 1-hour change of -3.84% reflects intraday volatility. Technical analysis presents mixed signals, with bullish indicators suggesting potential movement toward $0.029058 in the near term, while bearish projections caution of potential decline to $0.02692. Investors should monitor trading volume trends and ecosystem developments as indicators of sustained recovery momentum.
II. Investment Prospects and Risk Assessment
Q4: What are the projected price targets for SAKAI in 2026-2031?
A: Market forecasts present multiple scenarios. Short-term projections for 2026 range from $0.0152 (conservative) to $0.0463 (optimistic). Mid-term forecasts for 2028 suggest potential prices between $0.0300 and $0.0443, representing potential gains of 5% to 54% from current levels. Long-term projections through 2031 under base case scenarios suggest prices between $0.0505 and $0.0646, with optimistic scenarios reaching $0.0846. However, these predictions carry substantial uncertainty and should not be relied upon as reliable indicators of actual future performance.
Q5: What are the primary risk factors investors should consider before investing in SAKAI?
A: Investors should evaluate multiple risk categories. Market risks include extreme price volatility (demonstrated by the 96.19% annual decline), low trading liquidity that may result in unfavorable execution prices, and susceptibility to price manipulation due to low market capitalization. Regulatory risks encompass evolving frameworks governing decentralized exchanges and perpetual trading mechanisms. Technical risks involve potential smart contract vulnerabilities on the BSC network and platform adoption challenges in a competitive DEX landscape. Additionally, the concentration of remaining token supply (55.08% unlocked) presents potential dilution risk if circulating supply increases substantially.
III. Project Fundamentals and Ecosystem
Q6: What distinguishes Sakai Vault's platform offerings and competitive positioning?
A: Sakai Vault operates as a decentralized spot and perpetual exchange platform emphasizing low transaction fees and zero price impact trading mechanisms. The protocol provides comprehensive market analysis ranging from cryptocurrency fundamentals to detailed market insights, helping investors identify emerging trends. The platform operates on the Binance Smart Chain (BSC) network, leveraging established infrastructure for transaction efficiency. However, SAKAI's market performance suggests limited user adoption or competitive differentiation relative to established DEX platforms such as Uniswap, PancakeSwap, or specialized perpetual exchanges like dYdX.
Q7: What is the tokenomics structure and supply mechanism of SAKAI?
A: SAKAI possesses a maximum supply of 8,000,000 tokens with a current circulating supply of 3,593,687.16 tokens, representing 44.92% circulation. This structure creates a supply cap that theoretically supports long-term scarcity dynamics. However, the 55.08% of tokens remaining in the supply pool present potential dilution concerns if significant portions are released to the market. The defined supply cap creates deflationary characteristics as circulation approaches maximum supply, which may theoretically support long-term value retention. Token distribution metrics suggest moderate community participation with 143,015 unique holders across a single exchange listing.
IV. Investment Suitability and Recommendations
Q8: What investment approach is most appropriate for different investor profiles considering SAKAI?
A: Conservative investors should consider minimal allocation (1-2% of portfolio) using dollar-cost averaging strategies with secure hardware wallet storage, suitable only for those understanding potential total capital loss. Experienced traders may pursue short-term tactical positions based on technical analysis of support levels at $0.027 and resistance levels at $0.0284-$0.0289, while maintaining strict risk management protocols. Institutional investors should conduct comprehensive due diligence on platform traction and competitive positioning before any strategic allocation. All investors should recognize SAKAI qualifies as a speculative, high-risk micro-cap asset and should not represent a significant portfolio concentration. Independent research and consultation with qualified financial advisors remain essential before any investment commitment.
Disclaimer: This FAQ is provided for informational purposes only and does not constitute investment advice, financial recommendation, or solicitation to buy or sell SAKAI tokens. Cryptocurrency investments carry substantial risk, including potential total loss of capital. Past performance does not guarantee future results. Investors should conduct independent research, evaluate personal risk tolerance, and consult qualified financial advisors before making investment decisions.
* The information is not intended to be and does not constitute financial advice or any other recommendation of any sort offered or endorsed by Gate.