# Is U2U Network (U2U) a Good Investment? — Article Overview
## Introduction
This comprehensive U2U Network investment analysis examines whether U2U presents viable investment opportunities through detailed technical architecture review, tokenomics assessment, and market performance evaluation. The article addresses critical investment questions for diverse investor profiles—from conservative portfolio managers to experienced crypto traders—by analyzing DAG technology foundations, 83.21% annual price depreciation, severe dilution risks, and long-term growth catalysts through 2030. Structured across market performance metrics, risk frameworks, and price projections, this guide helps investors determine appropriate allocation strategies. Whether seeking speculative opportunities or assessing Layer 1 blockchain fundamentals, readers gain actionable insights on U2U's Subnet technology potential balanced against substantial execution and regulatory uncertainties. Access real-time U2U pricing and detailed forecas
Introduction: Investment Position and Market Prospects of U2U Network (U2U)
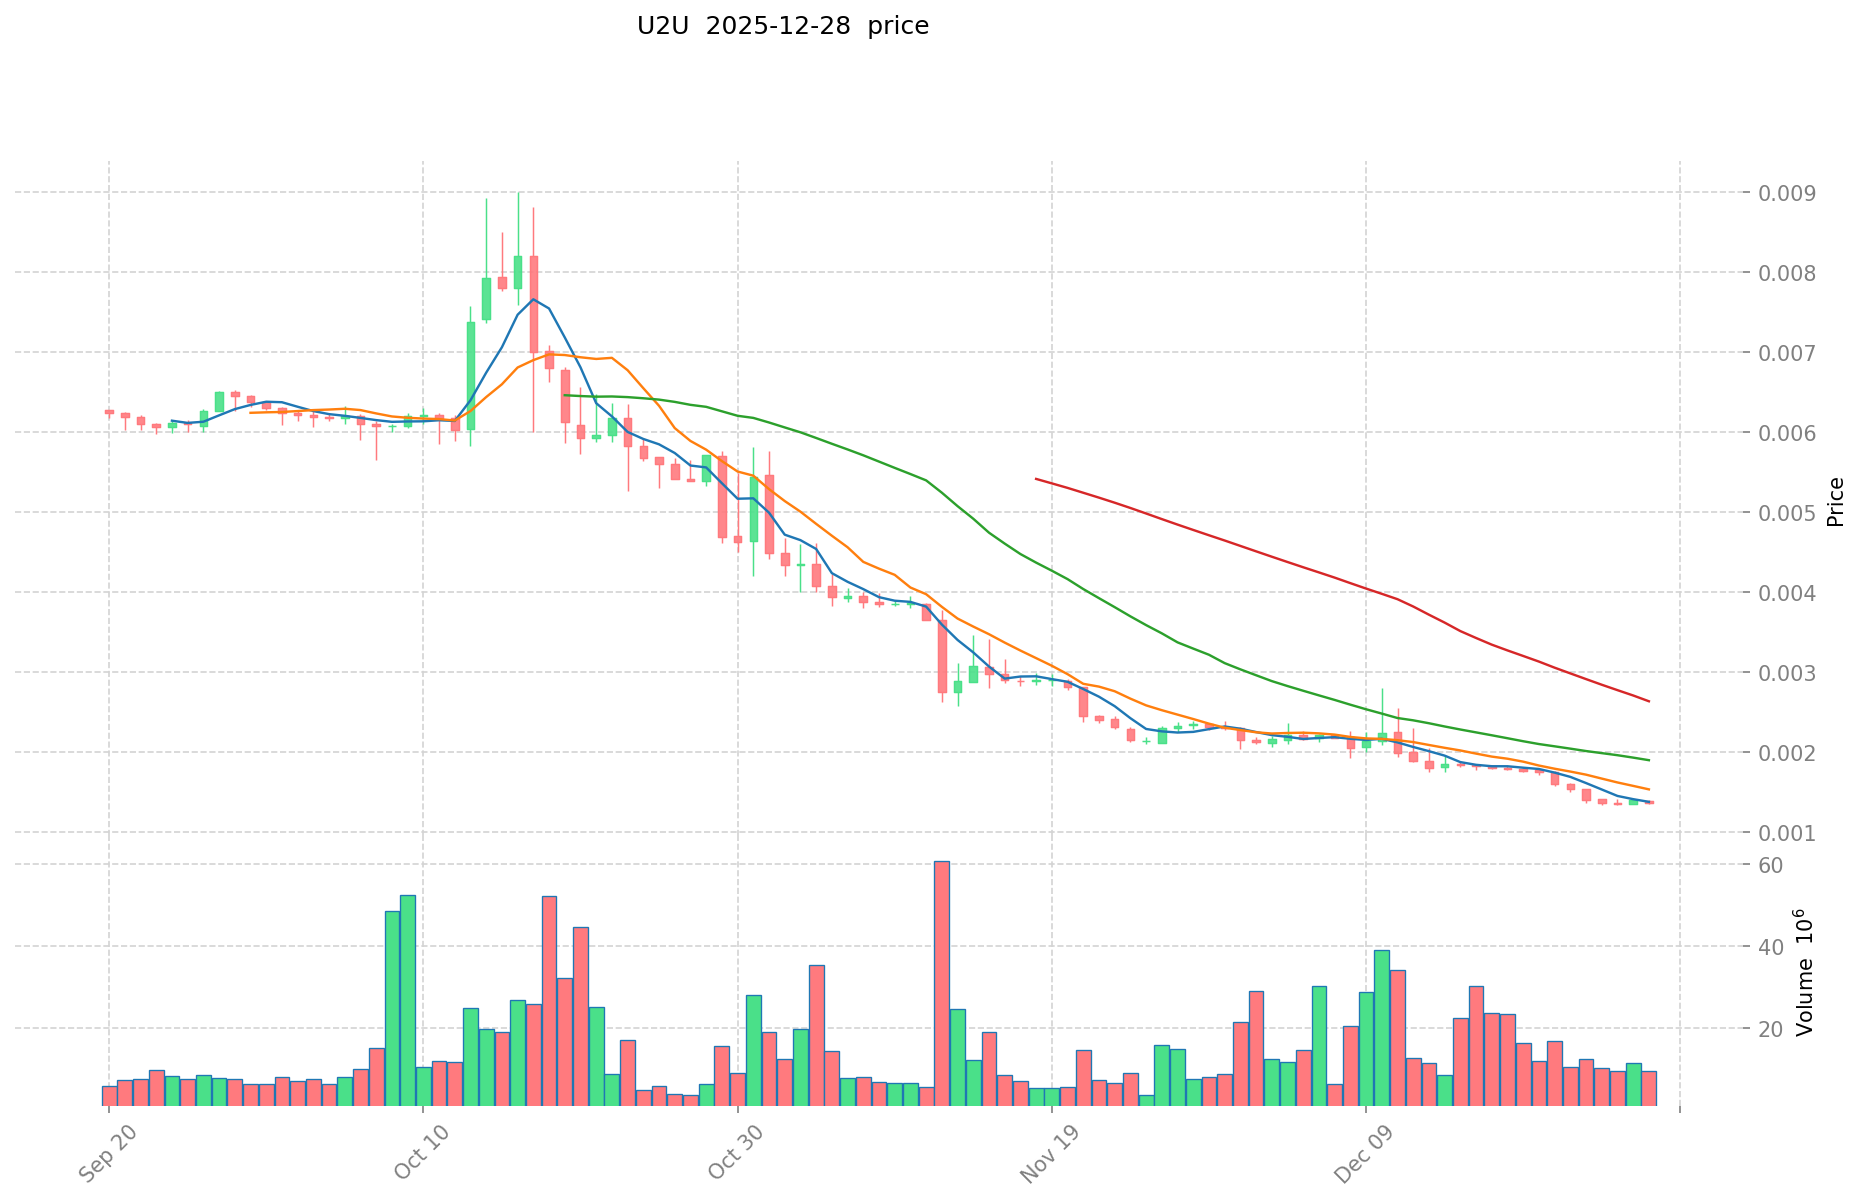
U2U Network is an important asset in the cryptocurrency field. As of December 28, 2025, U2U maintains a market capitalization of approximately $13.62 million, with a circulating supply of around 534.85 million tokens and a current price hovering near $0.001362. As a modular Layer 1 network leveraging DAG technology and EVM compatibility, U2U Network has positioned itself distinctly within the blockchain ecosystem through its innovative Subnet technology for DePIN applications. The token, which published at an initial price of $0.007, has experienced significant price volatility, reaching an all-time high of $0.0255 on December 10, 2024, and subsequently declining to an all-time low of $0.001331 on December 24, 2025. This dramatic price movement has made U2U a focal point in discussions regarding "Is U2U Network a good investment?" among market participants. This article will provide a comprehensive analysis of U2U's investment value, historical price performance, future price predictions, and associated investment risks to serve as a reference for investors.
U2U Network (U2U) Crypto Asset Research Report
I. U2U Price History Review and Current Investment Value Status
Based on available data, the following key price movements have been recorded:
- December 10, 2024: All-time high (ATH) reached at $0.0255 → Peak valuation period
- December 24, 2025: All-time low (ATL) recorded at $0.001331 → Significant correction phase
- Current Period (December 28, 2025): Price recovered slightly to $0.001362 → Stabilization attempt after extreme low
The token has experienced a substantial decline of 83.21% over the past year, indicating significant downward pressure since its peak valuation.
Current U2U Investment Market Status (December 28, 2025)
- Current U2U Price: $0.001362
- 24-Hour Price Change: +0.66% ($0.000009 change)
- 24-Hour Trading Volume: $12,409.40 USD
- Market Capitalization: $728,467.34 USD
- Fully Diluted Valuation (FDV): $13,620,000.00 USD
- Market Cap to FDV Ratio: 5.35%
- Current Market Ranking: #2,878
Price Performance Across Timeframes:
| Timeframe |
Change |
| 1 Hour |
+0.67% |
| 24 Hours |
+0.66% |
| 7 Days |
-21.09% |
| 30 Days |
-41.47% |
| 1 Year |
-83.21% |
Market Emotion Indicator: Neutral (Value: 1)
For real-time U2U market price updates, visit Gate U2U Price Page
II. Project Overview and Technical Architecture
Project Description
U2U Network is a modular Layer 1 blockchain network that combines cutting-edge technologies to deliver enhanced performance and scalability:
- Core Technology Stack: DAG (Directed Acyclic Graph) technology combined with EVM compatibility
- Key Differentiator: Innovative Subnet technology enabling creation of customizable, independent subnetworks
- Target Use Case: Designed to provide unparalleled scalability and flexibility for DePIN (Decentralized Physical Infrastructure Network) applications
Token Economics
| Parameter |
Value |
| Total Supply |
10,000,000,000 U2U |
| Circulating Supply |
534,851,207 U2U |
| Circulating Supply Ratio |
5.35% |
| Maximum Supply |
10,000,000,000 U2U |
| Launch Price |
$0.007 |
III. Market Analysis and Current Valuation
Market Position
- Market Dominance: 0.00042% of total cryptocurrency market
- Exchange Listings: Available on 4 exchanges
- Market Capitalization Rank: #2,878
Valuation Assessment
The significant gap between current price ($0.001362) and launch price ($0.007) indicates a 80.6% decline from initial offering, with the token currently trading at approximately 19.5% of its all-time high price of $0.0255 recorded on December 10, 2024.
The low ratio of market cap to FDV (5.35%) suggests that the majority of tokens remain unlocked or not yet circulating, which may present dilution concerns as supply increases over time.
Official Website: https://u2u.xyz/
Blockchain Explorer: https://u2uscan.xyz
Social Media:
Technical Documentation:
Data Last Updated: December 28, 2025, 14:17:48 UTC
Disclaimer: This report is based on available market data as of the stated date. Past performance does not indicate future results. Investors should conduct their own due diligence before making any investment decisions.
U2U Network (U2U) Investment Analysis Report
I. Executive Summary
U2U Network is a modular Layer 1 blockchain leveraging Directed Acyclic Graph (DAG) technology and EVM compatibility. As of December 28, 2025, U2U is trading at $0.001362, with a market capitalization of approximately $728,467 and a fully diluted valuation of $13.62 million. The token has experienced significant price volatility, declining 83.21% over the past year from its initial listing price of $0.007.
Key Metrics:
- Current Price: $0.001362
- Market Cap Rank: 2878
- 24H Trading Volume: $12,409.40
- Circulating Supply: 534.85M U2U (5.35% of total supply)
- Total Supply: 10B U2U
II. Core Factors Influencing U2U Investment Viability
Supply Mechanism and Scarcity (U2U Investment Scarcity)
Token Supply Structure:
- Total Supply: 10 billion U2U tokens
- Current Circulating Supply: 534.85 million U2U (5.35% of total supply)
- Maximum Supply: 10 billion U2U
The extremely low circulating supply ratio (5.35%) indicates substantial token inflation potential as additional tokens enter circulation. This represents a significant dilution risk for existing investors, as the circulating supply could increase by nearly 1,770% once all tokens are released to market.
Investment Implications:
- The majority of tokens remain in reserve or vesting schedules
- Long-term price appreciation faces headwinds from supply expansion
- Scarcity cannot currently support elevated valuations given the high inflation potential
Technology and Ecosystem Development (Technology & Ecosystem for U2U Investment)
Core Technology Features:
-
DAG Technology Implementation:
- U2U Network employs Directed Acyclic Graph architecture to enhance transaction throughput and network efficiency
- DAG-based consensus mechanisms can theoretically support higher transaction volumes compared to traditional blockchain structures
- Impact on investment: Improved network performance may attract developer adoption and DePIN (Decentralized Physical Infrastructure Network) applications
-
EVM Compatibility:
- Full Ethereum Virtual Machine compatibility enables seamless migration of Ethereum-based applications
- Reduces developer friction and accelerates ecosystem growth
- Investment benefit: Existing Ethereum DApps can deploy on U2U with minimal modification
-
Subnet Technology:
- Innovative subnet architecture enables creation of customizable, independent sub-networks
- Particular focus on DePIN applications, offering scalability and operational flexibility
- Ecosystem expansion: Allows for specialized chain deployments tailored to specific use cases
Ecosystem Status:
- Listed on 4 cryptocurrency exchanges
- Active on-chain infrastructure: Block explorer (u2uscan.xyz) operational
- Community presence: Active Twitter account (@uniultra_xyz)
- Documentation available: Whitepaper published
Price Trends and Volatility
| Time Period |
Change Percentage |
Change Amount |
| 1 Hour |
+0.67% |
+$0.000009 |
| 24 Hours |
+0.66% |
+$0.000009 |
| 7 Days |
-21.09% |
-$0.000364 |
| 30 Days |
-41.47% |
-$0.000965 |
| 1 Year |
-83.21% |
-$0.006750 |
Key Price Metrics:
- All-Time High: $0.0255 (December 10, 2024)
- All-Time Low: $0.001331 (December 24, 2025)
- Current Price vs ATH: -94.65% decline
- Current Price vs ATL: +2.33% above recent low
The token has experienced catastrophic price deterioration since its peak, losing approximately 94.65% of its all-time high value. The recent stabilization near all-time lows suggests limited near-term upside momentum.
Market Position
- Market Dominance: 0.00042% of total cryptocurrency market
- Market Cap to FDV Ratio: 5.35% (indicates substantial potential dilution)
- 24H Price Range: $0.001351 - $0.001394 (minimal volatility in recent trading)
IV. Investment Risk Assessment
Primary Risk Factors
-
Severe Dilution Risk:
- Only 5.35% of total supply currently circulating
- Potential 1,870% supply inflation poses substantial downward price pressure
- Future token releases may significantly impact token valuations
-
Established Market Competition:
- Operating in highly competitive Layer 1 blockchain space
- Competing with established networks with superior liquidity and ecosystem maturity
- Market rank of 2878 indicates limited institutional or mainstream recognition
-
Limited Liquidity:
- 24-hour trading volume of only $12,409.40 reflects minimal market activity
- Thin liquidity creates vulnerability to price manipulation and sharp volatility
- Difficult exit opportunities for larger investors
-
Price Performance Deterioration:
- Consistent multi-timeframe losses (7D: -21.09%, 30D: -41.47%, 1Y: -83.21%)
- Momentum indicators remain negative
- Limited evidence of recovery catalysts
V. Resources and Community Engagement
VI. Conclusion
U2U Network presents a technologically innovative approach to Layer 1 blockchain design through DAG technology and subnet architecture. However, the investment case faces significant structural challenges:
- Negative factors: Extreme dilution potential, severe price depreciation, minimal market liquidity, and low trading volume
- Positive factors: Differentiated technical architecture, EVM compatibility, and focus on underserved DePIN use cases
The token's current valuation reflects substantial risk premia. Prospective investors should thoroughly research tokenomics, unlock schedules, and development progress before making investment decisions.
Data Current As Of: December 28, 2025, 14:17:48 UTC
III. U2U Network Future Investment Predictions and Price Outlook (Is U2U Network(U2U) worth investing in 2025-2030)
Short-term Investment Prediction (2025, short-term U2U investment outlook)
- Conservative prediction: $0.000967 - $0.001362
- Neutral prediction: $0.001362 - $0.001416
- Optimistic prediction: $0.001416 - $0.001500
Mid-term Investment Outlook (2026-2028, mid-term U2U Network(U2U) investment forecast)
- Market stage expectation: Gradual recovery and network development phase with increasing adoption of modular Layer 1 and DePIN applications
- Investment return prediction:
- 2026: $0.000834 - $0.001500
- 2027: $0.001286 - $0.002066
- 2028: $0.001668 - $0.002177
- Key catalysts: Subnet technology expansion, DePIN ecosystem growth, EVM compatibility adoption, increased exchange listings
Long-term Investment Outlook (Is U2U Network a good long-term investment?)
- Base scenario: $0.001513 - $0.002251 (stable network development and moderate ecosystem adoption)
- Optimistic scenario: $0.002251 - $0.002536 (accelerated DePIN application deployment and mainstream recognition)
- Risk scenario: $0.001285 or below (regulatory headwinds or diminished competitive advantage)
Click to view U2U long-term investment and price predictions: Price Prediction
2025-12-28 to 2030 Long-term Outlook
- Base scenario: $0.001809 - $0.002251 USD (corresponding to steady progress and mainstream application enhancement)
- Optimistic scenario: $0.002251 - $0.002536 USD (corresponding to large-scale adoption and favorable market conditions)
- Transformative scenario: $0.002536 USD and above (if ecosystem achieves breakthrough progress and mainstream proliferation)
- 2030-12-31 predicted high point: $0.002904 USD (based on optimistic development assumptions)
Disclaimer: This analysis is for informational purposes only and should not be construed as investment advice. Cryptocurrency markets are highly volatile and subject to regulatory, technical, and market risks. Past performance does not guarantee future results. Investors should conduct thorough research and consult with financial professionals before making investment decisions.
| 年份 |
预测最高价 |
预测平均价格 |
预测最低价 |
涨跌幅 |
| 2025 |
0.00141648 |
0.001362 |
0.00096702 |
0 |
| 2026 |
0.0015003792 |
0.00138924 |
0.000833544 |
2 |
| 2027 |
0.002066077728 |
0.0014448096 |
0.001285880544 |
6 |
| 2028 |
0.00217675014336 |
0.001755443664 |
0.0016676714808 |
28 |
| 2029 |
0.002536265005747 |
0.00196609690368 |
0.001513894615833 |
44 |
| 2030 |
0.00290402343158 |
0.002251180954713 |
0.00180094476377 |
65 |
U2U Network (U2U) Investment Analysis Report
I. Executive Summary
U2U Network is a modular Layer 1 blockchain that leverages Directed Acyclic Graph (DAG) technology and EVM compatibility to deliver high performance, scalability, and security. The project features innovative Subnet technology enabling customizable, independent sub-networks tailored for DePIN (Decentralized Physical Infrastructure Network) applications.
Key Metrics (as of December 28, 2025):
- Current Price: $0.001362
- Market Capitalization: $728,467.34
- Fully Diluted Valuation: $13,620,000
- Circulating Supply: 534,851,207 U2U
- Total Supply: 10,000,000,000 U2U
- Market Rank: #2,878
II. Technical Foundation & Core Features
Modular Layer 1 Architecture
U2U Network operates as a modular Layer 1 blockchain designed to address scalability and performance constraints inherent in traditional blockchain systems. The architecture emphasizes flexibility through modularity, allowing developers to customize network parameters according to specific application requirements.
DAG Technology Implementation
The network leverages Directed Acyclic Graph technology to enhance transaction throughput and reduce confirmation latency. DAG-based systems typically enable parallel transaction processing, improving overall network efficiency compared to linear blockchain structures.
EVM Compatibility
Full Ethereum Virtual Machine compatibility ensures seamless integration with existing Ethereum-based applications and developer tools, lowering barriers to entry for projects migrating to or building upon U2U Network.
Subnet Technology
The innovative Subnet feature enables creation of independent, customizable sub-networks operating within the U2U ecosystem. This design particularly targets DePIN applications requiring specialized infrastructure configurations and enhanced scalability.
Current Market Position
- 24-Hour Change: +0.66%
- 7-Day Change: -21.09%
- 30-Day Change: -41.47%
- 1-Year Change: -83.21%
- 24-Hour Trading Volume: $12,409.40
- Market Dominance: 0.00042%
Price History
- All-Time High: $0.0255 (December 10, 2024)
- All-Time Low: $0.001331 (December 24, 2025)
- 24-Hour Range: $0.001351 - $0.001394
- Circulating Supply Ratio: 5.35% of total supply in circulation
Market Observations
The token exhibits significant downward pressure over extended timeframes, with a one-year decline of 83.21% indicating substantial depreciation from peak valuations. Recent short-term metrics show marginal recovery (+0.66% in 24 hours) but remain within a depressed price range relative to historical highs.
IV. Investment Strategy & Risk Management
Investment Methodologies
Long-Term HODL Strategy (for Conservative Investors)
- Suitable for investors believing in long-term Layer 1 adoption and DePIN ecosystem growth
- Requires conviction in technical fundamentals and Subnet innovation
- Minimal active management required
Active Trading Strategy (for Experienced Traders)
- Relies on technical analysis given the asset's high volatility
- Wave-trading opportunities exist between support and resistance levels
- Requires active monitoring of market sentiment and trading volumes
Risk Management Framework
Asset Allocation Recommendations
- Conservative Portfolio: U2U represents <1% of total crypto allocation; majority allocated to established Layer 1s
- Aggressive Portfolio: U2U represents 2-5% of crypto allocation, balanced against higher market cap alternatives
- Professional Allocation: Strategic position-sizing based on risk-adjusted return metrics
Portfolio Diversification
- Combine U2U holdings with diversified Layer 1 exposure (Ethereum, Solana, Polkadot)
- Maintain stablecoin reserves for market downturns and rebalancing opportunities
- Consider uncorrelated asset classes to reduce systematic risk
Security Considerations
- Use non-custodial wallets for long-term holdings
- Hardware wallet storage recommended for amounts exceeding personal risk tolerance thresholds
- Enable multi-signature protocols for institutional positions
V. Investment Risks & Challenges
Market Risk
- High Volatility: 83.21% one-year decline demonstrates extreme price fluctuations
- Low Trading Volume: $12,409 daily volume indicates thin liquidity, potentially amplifying price movements
- Liquidity Risk: Limited exchange availability (4 exchanges) constrains exit opportunities
Technology Risk
- Network Maturity: DAG-based Layer 1 implementations remain relatively nascent in production environments
- Adoption Uncertainty: Subnet technology requires validation through real-world DePIN application deployment
- Competitive Pressure: Multiple Layer 1 competitors offer established track records and larger developer ecosystems
Regulatory Risk
- Jurisdiction-Specific Uncertainty: Cryptocurrency regulatory frameworks vary significantly across jurisdictions
- Compliance Classification: Regulatory treatment of Layer 1 tokens and DePIN infrastructure remains fluid in many markets
- Policy Evolution: Future regulatory changes could materially impact market demand and token valuation
Execution Risk
- Development Milestones: Success depends on timely execution of technical roadmap
- Ecosystem Adoption: Limited current adoption in DePIN applications creates chicken-and-egg dynamics
- Market Sentiment: Recovering from 83.21% annual decline requires sustained positive developments
VI. Conclusion: Is U2U Network a Good Investment?
Investment Value Summary
U2U Network presents a speculative investment opportunity within the modular Layer 1 category. The technical architecture emphasizing DAG technology and Subnet customization addresses legitimate scalability requirements. However, the extreme price depreciation (83.21% annually) and low trading volumes reflect current market skepticism regarding near-term adoption catalysts.
The token's potential value proposition depends critically on:
- Successful deployment of DePIN applications utilizing Subnet infrastructure
- Demonstrated performance advantages over competing Layer 1 solutions
- Growth in decentralized physical infrastructure market segment
- Achievement of meaningful network adoption metrics
Investor Recommendations
✅ New Investors: If participating, implement dollar-cost averaging over extended timeframes; prioritize secure non-custodial storage; limit allocation to <1% of portfolio
✅ Experienced Investors: Technical analysis of $0.001331 support level recommended; wave-trading viable given volatility; position-sizing critical given low liquidity
✅ Institutional Investors: Conduct detailed technical audit of DAG implementation and Subnet architecture; evaluate DePIN application pipeline; establish clear adoption metrics as investment thesis validation
Important Disclaimer
⚠️ Risk Notice: Cryptocurrency investments carry substantial risk, including potential total capital loss. U2U Network exhibits characteristics of early-stage, speculative digital assets. This analysis is provided solely for informational purposes and does not constitute investment advice, recommendation, or financial counsel. Conduct independent research, assess personal risk tolerance, and consult qualified financial advisors before making investment decisions. Past performance does not guarantee future results.
Report Date: December 28, 2025
Data Source: Gate cryptocurrency data (updated 14:17:48 UTC)
Disclaimer: This report reflects analysis of provided data and does not constitute financial advice or investment recommendations.
U2U Network (U2U) Crypto Asset FAQ
I. What is U2U Network and how does it differ from other Layer 1 blockchains?
U2U Network is a modular Layer 1 blockchain that leverages Directed Acyclic Graph (DAG) technology combined with EVM compatibility. Its key differentiator is innovative Subnet technology, which enables the creation of customizable, independent sub-networks tailored specifically for DePIN (Decentralized Physical Infrastructure Network) applications. Unlike traditional linear blockchain structures, U2U's DAG-based architecture supports parallel transaction processing, potentially improving throughput and confirmation speeds compared to conventional Layer 1 solutions.
As of December 28, 2025, U2U is trading at $0.001362 with a market capitalization of $728,467.34. The token has experienced significant price volatility: it reached an all-time high of $0.0255 on December 10, 2024, and declined to an all-time low of $0.001331 on December 24, 2025. Over the past year, U2U has declined 83.21% from its launch price of $0.007, representing substantial depreciation. In recent short-term trading, the token shows marginal recovery (+0.66% in 24 hours) but remains deeply depressed relative to historical highs.
III. What are the tokenomics and supply concerns for U2U?
U2U has a total supply of 10 billion tokens with only 534.85 million currently circulating, representing just 5.35% of total supply. This extremely low circulating supply ratio indicates substantial dilution potential as additional tokens enter circulation over time. Once all tokens are released, the circulating supply could increase by approximately 1,870%, creating significant downward price pressure and scarcity concerns. This represents one of the primary investment risks, as supply inflation typically constrains long-term price appreciation.
IV. Is U2U Network a good investment for conservative investors?
U2U Network is generally unsuitable for conservative investors due to extreme volatility, limited trading liquidity ($12,409 daily volume), and severe price depreciation. Conservative investors should maintain exposure to U2U below 1% of total portfolio allocation, if at all. The token exhibits characteristics of early-stage, speculative digital assets with unproven ecosystem adoption. Conservative strategies might employ dollar-cost averaging over extended timeframes with multi-year investment horizons, though the execution risk and regulatory uncertainty recommend prioritizing established Layer 1 alternatives with stronger fundamentals.
V. What are the primary risks associated with U2U investment?
Primary investment risks include: (1) Severe dilution risk from 94.65% of total supply remaining unreleased; (2) Extreme price volatility and declining momentum across all timeframes; (3) Minimal trading liquidity on only 4 exchanges, creating difficulty for exit strategies; (4) Technology execution risk dependent on successful DePIN application deployment; (5) Regulatory uncertainty surrounding Layer 1 tokens and decentralized infrastructure networks; (6) Intense competition from established Layer 1 blockchains with mature ecosystems and superior liquidity. These factors collectively present substantial downside risk for investors.
VI. What price predictions exist for U2U over the medium to long term?
Price forecasts from available analysis suggest: Short-term (2025) range of $0.000967 to $0.001500; Medium-term (2026-2028) progression toward $0.002177 under base case scenarios; Long-term (2030) optimistic projections of $0.002904 assuming accelerated DePIN adoption and mainstream recognition. However, these predictions carry substantial uncertainty and depend entirely on successful ecosystem development, application adoption, and favorable regulatory conditions. Risk scenarios project prices at $0.001285 or below if competitive advantages diminish or regulatory headwinds emerge.
Official U2U Network resources include: Website at https://u2u.xyz/; Block Explorer at https://u2uscan.xyz for on-chain transaction verification; Twitter/X account at https://x.com/uniultra_xyz for project updates and community engagement; and the technical whitepaper available via Google Drive at https://drive.google.com/file/d/1eGm-dHRtWaR5U5NxYPKn_HlCjkUyn4ac/view. These channels provide official project information, technical documentation, and real-time network data. Prospective investors should review whitepaper specifications and follow official channels for development updates before making investment decisions.
VIII. What investment strategy is appropriate for experienced cryptocurrency traders interested in U2U?
Experienced traders might employ active trading strategies leveraging technical analysis of U2U's high volatility, particularly wave-trading between $0.001331 support and $0.001500 resistance levels. Critical considerations include: strict position-sizing given thin liquidity; active monitoring of 7-day and 30-day momentum indicators; readiness to exit positions rapidly during adverse market sentiment shifts; and use of non-custodial wallets for security. Active traders should recognize that low daily volumes ($12,409) amplify price impact for larger transactions, and should implement defined stop-loss parameters to manage downside risk exposure effectively.
Disclaimer: This FAQ is for informational purposes only and does not constitute investment advice, financial recommendation, or counsel. Cryptocurrency markets are highly volatile and subject to substantial risk, including potential total capital loss. Conduct independent research, assess personal risk tolerance, and consult qualified financial professionals before making investment decisions. Past performance does not guarantee future results.
Report Date: December 28, 2025
Data Source: Gate cryptocurrency platform
Last Updated: 14:17:48 UTC
* The information is not intended to be and does not constitute financial advice or any other recommendation of any sort offered or endorsed by Gate.