# Vodra (VDR) Investment Analysis: A Comprehensive Guide to Price Potential, Tokenomics, and Market Opportunities
This comprehensive analysis examines whether Vodra (VDR) represents a viable investment opportunity through detailed examination of tokenomics, historical price performance, and market positioning. The report addresses critical questions for cryptocurrency investors: What drives VDR's value proposition in the creator economy segment? What are the realistic price scenarios through 2031? What risks threaten investment returns? Designed for experienced crypto investors and traders seeking speculative opportunities, this guide provides data-driven insights into VDR's micro-cap positioning on the Solana blockchain, evaluates supply dilution risks against adoption potential, and outlines practical investment frameworks. Structured across price analysis, tokenomics assessment, market sentiment evaluation, and risk management strategies, this resource enables informed decision-making regarding VDR alloca
Introduction: Vodra (VDR) Investment Position and Market Prospects
VDR is an important asset in the cryptocurrency field. As of January 2026, Vodra has achieved a market capitalization of $1,684,799.83 with a circulating supply of approximately 143,144,036 tokens, maintaining a current price around $0.0008424.
Vodra's mission centers on empowering content creators to pursue their passion while receiving fair remuneration. By leveraging blockchain technology, Vodra addresses a significant market gap in the creator economy where social media platforms have grown increasingly important in connecting and entertaining people, yet creators often face substantial obstacles in receiving equitable compensation for their creative contributions. The platform enables creators to receive direct compensation from their audience and establishes transparent market pricing for creator value participation.
With a market dominance of 0.000051% and positioned at rank 4,685 in the global cryptocurrency market, Vodra represents a micro-cap asset with unique positioning in the creator economy sector. This report will comprehensively analyze Vodra's investment value, historical price trends, future price expectations, and associated investment risks to provide investors with informed reference material.
Vodra (VDR) Cryptocurrency Research Report
I. VDR Price History Review and Current Investment Value Status
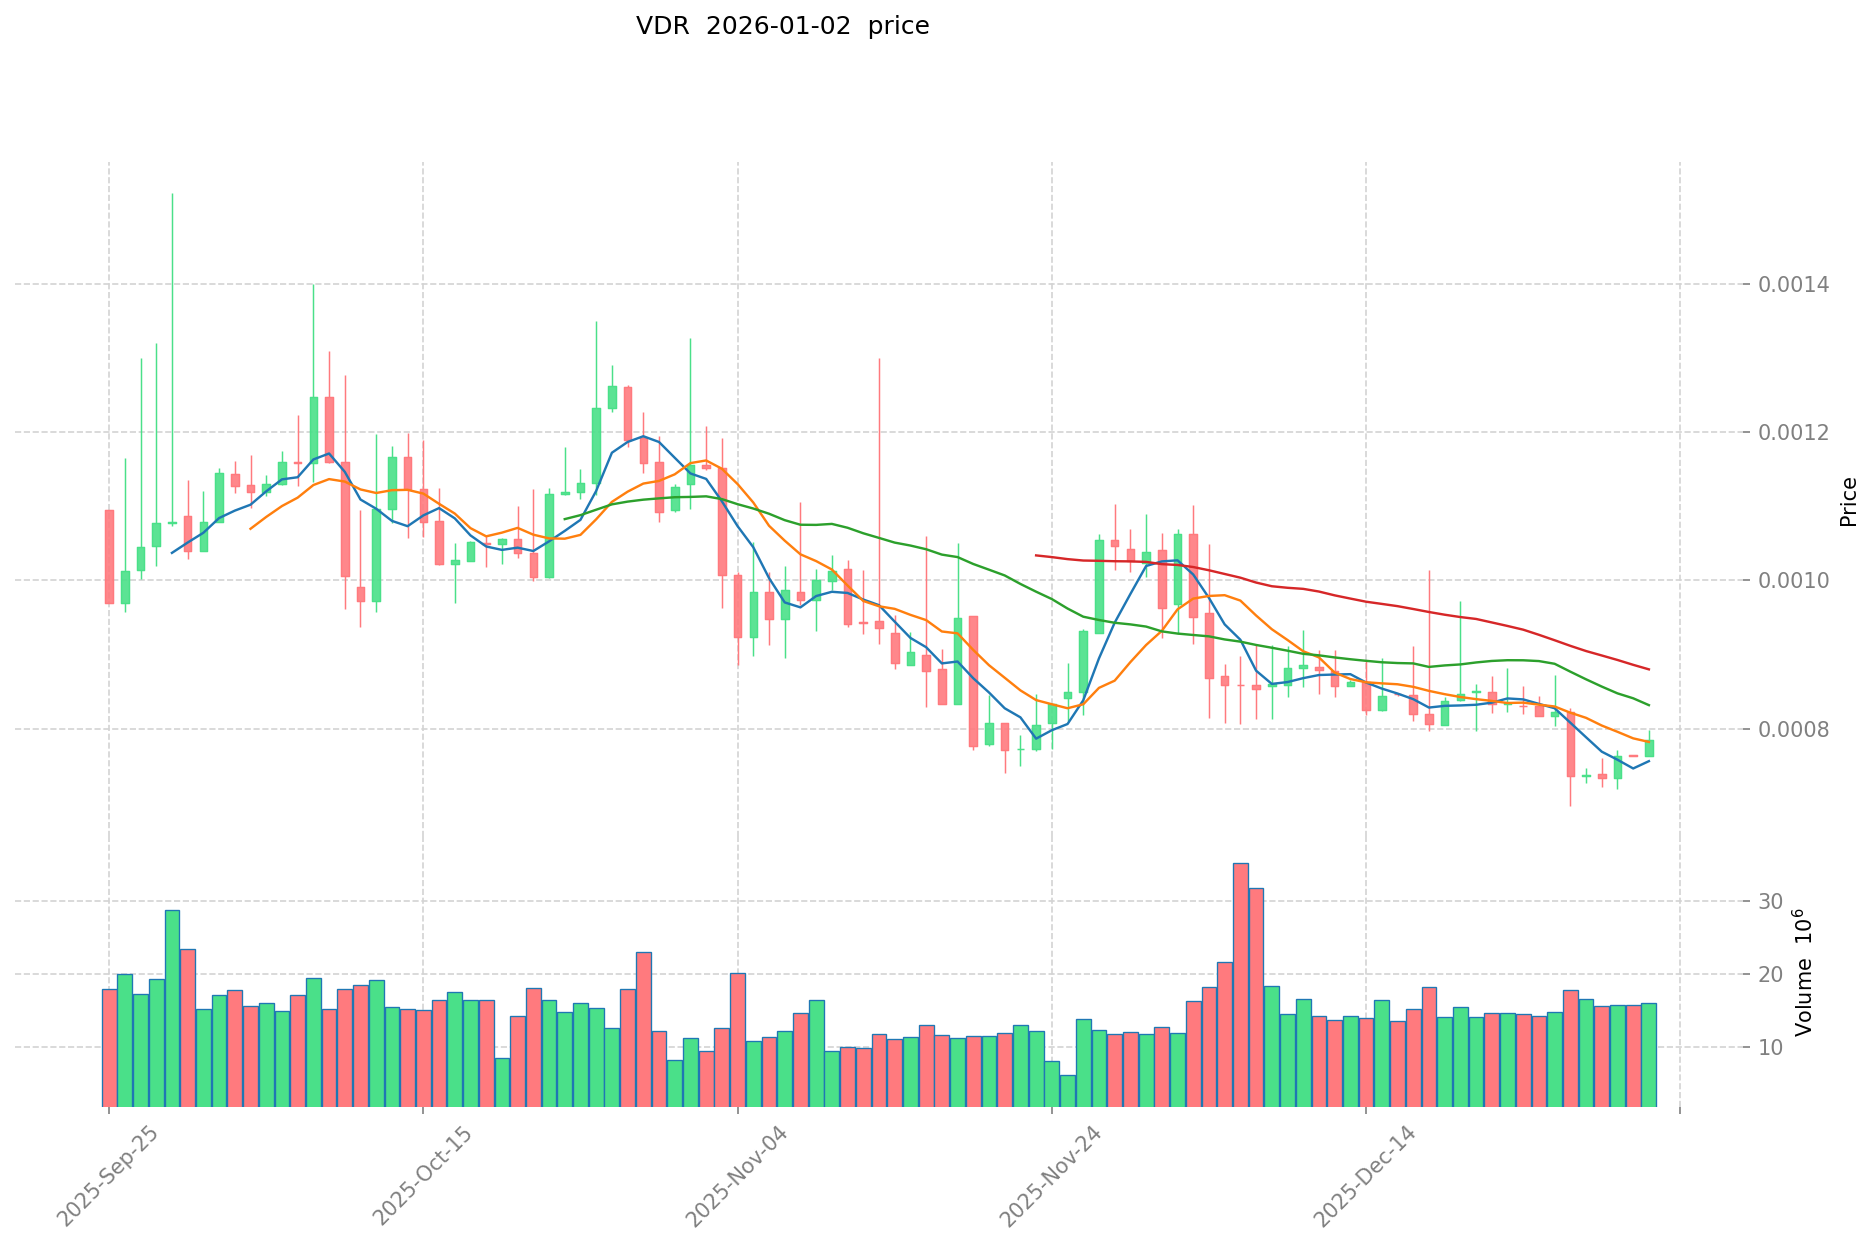
Based on available data, Vodra has experienced significant price volatility since its inception:
- November 2021: All-time high of $0.078702 reached, representing peak investor optimism during the cryptocurrency market expansion period.
- October 2023: All-time low of $0.00018002 recorded, reflecting extended market downturn and reduced investor confidence.
- 2021-2023 Period: Approximately 99.8% decline from historical peak to historical low, indicating substantial investor losses during this timeframe.
Current VDR Market Status (January 3, 2026)
Key Market Metrics:
| Metric |
Value |
| Current Price |
$0.0008424 |
| 24-Hour Change |
+8.48% |
| 7-Day Change |
+2.27% |
| 30-Day Change |
-13.35% |
| 1-Year Change |
-51.15% |
| 24-Hour Trading Volume |
$12,440.46 |
| Market Capitalization |
$120,584.54 |
| Fully Diluted Valuation |
$1,684,799.83 |
| Market Dominance |
0.000051% |
| Token Holders |
746 |
Market Sentiment: Positive (index value: 1), indicating a slight uptick in short-term trader interest, though overall market sentiment remains subdued given the token's significant decline from historical peaks.
II. Project Overview and Business Model
Project Mission and Core Value Proposition
Vodra's mission is to enable content creators to pursue their passion while receiving fair compensation. The project addresses structural inefficiencies in social media monetization by creating a direct compensation mechanism between creators and audiences.
Problem Statement: Social media platforms facilitate vast content consumption and entertainment value generation, yet face persistent challenges in equitably compensating the creative talent that produces this content.
Proposed Solution: Vodra enables creators to receive direct compensation from their audience members and establishes transparent market pricing for the value derived from creator participation.
Blockchain Infrastructure
III. Token Supply and Distribution
| Parameter |
Value |
| Total Supply |
2,000,000,000 VDR |
| Circulating Supply |
143,144,036 VDR |
| Circulation Ratio |
7.16% |
| Maximum Supply |
2,000,000,000 VDR |
The circulating-to-total supply ratio of 7.16% indicates that the majority of tokens remain in non-circulation, which may present both opportunity and dilution risk depending on vesting schedules and unlock mechanisms.
IV. Price Volatility Analysis
Recent Price Movement Summary:
| Timeframe |
Change |
Price Movement |
| 1 Hour |
-0.11% |
-$0.00000092764 |
| 24 Hours |
+8.48% |
+$0.00006585133 |
| 7 Days |
+2.27% |
+$0.00001869803 |
| 30 Days |
-13.35% |
-$0.00012978696 |
| 1 Year |
-51.15% |
-$0.00088206264 |
| All-Time High-to-Low |
-99.77% |
$0.07852 → $0.00018 |
The 24-hour positive movement (+8.48%) contrasts with longer-term weakness, suggesting recent speculative buying pressure without fundamental catalysts supporting sustained recovery.
V. Market Positioning and Competitive Landscape
Vodra operates within the creator economy and decentralized finance segment, competing against established social platforms and emerging blockchain-based creator compensation models. The project's Solana-based architecture positions it within the lower-cost transaction ecosystem, offering computational efficiency advantages.
Current Market Position: Ranked 4,685 by market capitalization among cryptocurrencies, indicating marginal market presence relative to larger cryptocurrency assets.
VI. Risk Considerations
- Extreme Historical Volatility: Token has experienced >99% decline from all-time high, indicating severe valuation risk.
- Low Liquidity: Daily trading volume of ~$12,440 relative to market cap suggests limited exit liquidity for larger positions.
- Small Holder Base: 746 total token holders indicates concentrated ownership risk.
- Regulatory Uncertainty: Creator economy tokenization faces evolving regulatory treatment across jurisdictions.
- Adoption Risk: Project success depends on significant creator platform adoption, which remains unproven at scale.
Report Generation Date: January 3, 2026 (02:17:39 UTC)
Data Source: Gate cryptocurrency data platform
Trading Availability: Available on Gate exchange
Disclaimer: This report presents factual market data and project information without providing investment recommendations. Cryptocurrency investments carry substantial risk including potential total loss of invested capital. Readers should conduct independent research and consult qualified financial advisors before making investment decisions.
Vodra (VDR) Investment Analysis Report
Report Date: January 3, 2026
I. Executive Summary
Vodra (VDR) is a blockchain-based platform designed to enable content creators to receive fair compensation directly from their audience on social media. As of January 3, 2026, VDR trades at $0.0008424 with a market capitalization of approximately $120,584.54 and a fully diluted valuation of $1,684,799.83. The token ranks 4,685 in the broader cryptocurrency market, indicating a relatively small market position.
II. Core Factors Influencing VDR Investment Viability
Supply Mechanism and Scarcity
- Total Supply: 2,000,000,000 VDR tokens (maximum supply)
- Circulating Supply: 143,144,036 tokens (7.16% of total supply)
- Supply Dynamics: The significant gap between circulating and total supply indicates substantial dilution risk. As more tokens enter circulation, downward pressure on price may intensify without corresponding demand growth.
- Investment Implications: Limited current scarcity coupled with significant future supply expansion creates headwinds for long-term price appreciation. Investors should monitor token unlock schedules and emission rates.
Market Position and Adoption
- Market Dominance: 0.000051% of the total cryptocurrency market
- Token Holders: 746 unique addresses
- Exchange Presence: Trading on one exchange (Gate)
- Adoption Status: Limited institutional adoption and relatively low trading volume ($12,440.46 in 24-hour volume) suggest early-stage market penetration.
Price Performance and Historical Context
- All-Time High: $0.078702 (November 18, 2021)
- All-Time Low: $0.00018002 (October 28, 2023)
- Current Price Decline: 89.3% below ATH; 367.6% above ATL
- Recent Performance Trends:
- 1-hour change: -0.11%
- 24-hour change: +8.48%
- 7-day change: +2.27%
- 30-day change: -13.35%
- 1-year change: -51.15%
The significant decline from historical peaks and mixed short-term price movements reflect high volatility and investor uncertainty regarding the project's fundamentals and market prospects.
Regulatory and Ecosystem Environment
The project operates on the Solana blockchain, benefiting from Solana's infrastructure but remaining dependent on the broader blockchain ecosystem's regulatory treatment. The lack of documented institutional partnerships or major enterprise adoption limits near-term catalysts for significant price appreciation.
III. Market Sentiment and Technical Indicators
Available market analysis presents conflicting signals:
- Bullish Perspectives: Some technical analysts suggest potential growth trajectory for 2025-2026
- Bearish Perspectives: Multiple quantitative technical indicators point to bearish trends
- Price Forecasts (Varying Projections):
- Conservative estimates: $0.0007350 by end of 2025
- Moderate projections: $0.0011091 by 2025
- Optimistic scenarios: Up to $0.00667 in medium-term timeframes
These divergent forecasts underscore the speculative nature of price prediction and the absence of consensus among analysts.
IV. Key Investment Considerations
Risks
- Extreme Dilution Risk: With only 7.16% of tokens currently in circulation, future supply increases pose substantial downside pressure
- Limited Adoption: Minimal exchange presence and low trading volume indicate restricted market liquidity
- Market Concentration: Only 746 token holders suggests high concentration risk
- Historical Volatility: 89% decline from ATH demonstrates severe price drawdown risk
- Competitive Landscape: Established social media and creator compensation platforms may present competitive challenges
Potential Opportunities
- Early-Stage Project: Position as an emerging platform within the creator economy segment
- Market Expansion: Untapped potential in the social media monetization space
- Blockchain Integration: Solana ecosystem participation provides access to a growing DeFi ecosystem
V. Project Overview
Mission: Vodra aims to establish fair compensation mechanisms for content creators, enabling direct audience payments and transparent market pricing for creator value.
Blockchain: Solana (SOL)
Official Channels:
VI. Conclusion
Vodra represents an early-stage cryptocurrency project within the creator economy segment. While the mission addresses a genuine market gap in content creator compensation, the investment case remains highly speculative. Key headwinds include massive supply dilution, minimal market adoption, extreme historical volatility, and divergent analyst forecasts.
The project lacks sufficient institutional backing, commercial adoption, or technological differentiation to provide confidence in investment returns. Potential investors should conduct thorough due diligence and consider this asset suitable only for high-risk tolerance portfolios with capital allocation appropriate for speculative ventures.
Disclaimer: This report presents factual market data and publicly available information. It does not constitute investment advice, and all forward-looking statements carry significant uncertainty. Past performance does not guarantee future results.
III. VDR Future Investment Prediction and Price Outlook (Is Vodra(VDR) worth investing in 2026-2031)
Short-term Investment Prediction (2026, short-term VDR investment outlook)
- Conservative forecast: $0.000632 - $0.000842
- Neutral forecast: $0.000842 - $0.001213
- Optimistic forecast: $0.001213 and above
Mid-term Investment Outlook (2027-2029, mid-term Vodra(VDR) investment forecast)
- Market stage expectation: VDR demonstrates gradual recovery trajectory with consistent growth momentum across the medium term, showing increasing price stability and market adoption progression.
- Investment return prediction:
- 2027: $0.000874 - $0.001089
- 2028: $0.000572 - $0.001154
- 2029: $0.000830 - $0.001184
- Key catalysts: Creator economy adoption expansion, platform user base growth, blockchain ecosystem development, and enhanced content monetization mechanisms.
Long-term Investment Outlook (Is Vodra a good long-term investment?)
- Base case scenario: $0.000721 - $0.001694 USD (assumes steady ecosystem expansion and moderate mainstream adoption of content creator compensation mechanisms)
- Optimistic scenario: $0.001400 - $0.002000 USD (assumes accelerated creator economy growth and significant integration with major social platforms)
- Risk scenario: $0.000300 - $0.000500 USD (under conditions of regulatory headwinds, competitive pressure from established platforms, or limited market traction)
Visit VDR Long-term Investment and Price Prediction: Price Forecast
2026-01-03 to 2031 Long-term Outlook
- Base case scenario: $0.000738 - $0.001462 USD (corresponding to steady growth in creator economy adoption and incremental platform expansion)
- Optimistic scenario: $0.001200 - $0.001694 USD (corresponding to large-scale adoption and favorable market environment for decentralized creator platforms)
- Transformative scenario: $0.002000 USD and above (contingent on breakthrough ecosystem progress and mainstream adoption of direct creator compensation models)
- 2031-12-31 predicted high point: $0.001462 USD (based on optimistic development assumptions)
Disclaimer: This analysis is provided for informational purposes only and does not constitute investment advice. Past performance does not guarantee future results. Cryptocurrency markets are highly volatile and speculative. Investors should conduct their own research and consult with qualified financial advisors before making investment decisions.
| 年份 |
预测最高价 |
预测平均价格 |
预测最低价 |
涨跌幅 |
| 2026 |
0.001213056 |
0.0008424 |
0.0006318 |
0 |
| 2027 |
0.00108939168 |
0.001027728 |
0.0008735688 |
22 |
| 2028 |
0.0011538302256 |
0.00105855984 |
0.0005716223136 |
25 |
| 2029 |
0.001183628685096 |
0.0011061950328 |
0.0008296462746 |
31 |
| 2030 |
0.001694469551243 |
0.001144911858948 |
0.000721294471137 |
35 |
| 2031 |
0.001462281426248 |
0.001419690705095 |
0.000738239166649 |
68 |
Vodra (VDR) Cryptocurrency Research Report
Report Date: January 3, 2026
I. Project Overview
Vodra (VDR) is a cryptocurrency project built on the Solana blockchain with the mission to enable content creators to pursue their passion while receiving fair compensation.
Key Metrics (as of January 3, 2026):
| Metric |
Value |
| Current Price |
$0.0008424 |
| Market Capitalization |
$120,584.54 |
| Fully Diluted Valuation |
$1,684,799.83 |
| Circulating Supply |
143,144,036 VDR |
| Total Supply |
1,999,999,794.48 VDR |
| Max Supply |
2,000,000,000 VDR |
| 24H Trading Volume |
$12,440.46 |
| Market Ranking |
#4685 |
| Market Dominance |
0.000051% |
| Number of Holders |
746 |
Project Mission
Vodra addresses barriers in fair compensation for content creators on social media platforms. The platform enables creators to receive direct compensation from their audience and establishes a market-based valuation system for creator participation value.
Price Trends
Current Price Performance:
| Period |
Change |
Absolute Change |
| 1 Hour |
-0.11% |
-$0.00000093 |
| 24 Hours |
+8.48% |
+$0.00006585 |
| 7 Days |
+2.27% |
+$0.00001870 |
| 30 Days |
-13.35% |
-$0.00012979 |
| 1 Year |
-51.15% |
-$0.00088206 |
Historical Price Range:
- All-Time High: $0.078702 (November 18, 2021)
- All-Time Low: $0.00018002 (October 28, 2023)
- 24H High: $0.000855
- 24H Low: $0.0007749
- Current Price vs ATH: Declined 98.93%
Trading Metrics
- Market Cap to FDV Ratio: 7.16% (indicating significant dilution potential)
- Circulation Ratio: 7.16% of maximum supply in circulation
- Average 24H Trading Volume: $12,440.46
- Market Sentiment: Neutral to Positive (Market Emotion: 1)
III. Risk Assessment
Market Risks
- Extreme Volatility: VDR exhibits substantial price fluctuations, with a decline of over 51% in the past year
- Low Liquidity: Daily trading volume of approximately $12,440 is relatively low for market movements
- Concentration Risk: Only 746 token holders indicates high concentration risk
- Market Cap Concerns: Limited market capitalization of ~$120,584 suggests vulnerability to price manipulation
Regulatory Risks
- Blockchain-Specific Regulation: As a Solana-based token, VDR is subject to evolving cryptocurrency regulations across different jurisdictions
- Uncertainty: Regulatory framework for content creator compensation platforms remains undefined in many regions
Technology Risks
- Blockchain Dependency: Project relies on Solana network stability and security
- Smart Contract Risk: Limited available information regarding security audits and code review status
- Network Risk: Solana blockchain vulnerabilities could directly impact VDR token security
Project-Specific Risks
- Limited Adoption: Relatively small holder base (746 addresses) suggests low current adoption
- Competitive Landscape: Faces competition from established content creator platforms and alternative blockchain solutions
- Token Dilution: Maximum supply has not been fully circulated; future emission could cause significant dilution
IV. Investment Strategy and Risk Management
Investment Methodology
Long-Term Holdings (HODL Strategy):
- Suitable for risk-tolerant investors with extended time horizons
- Requires conviction in Vodra's content creator compensation thesis
- Recommended only for portfolios that can absorb significant losses
Active Trading:
- Dependent on technical analysis given limited fundamental catalysts
- Suitable for experienced traders familiar with low-liquidity token dynamics
- High risk due to limited order book depth and potential slippage
Risk Management Framework
Asset Allocation Guidelines:
- Conservative Investors: Not recommended given extreme volatility and market cap size
- Aggressive Investors: Maximum 2-5% of portfolio allocation to experimental stage projects
- Institutional Investors: Requires thorough due diligence; position sizing should reflect illiquidity and concentration risks
Portfolio Diversification:
- Combine with established cryptocurrencies and traditional assets
- Avoid concentrated positions in low-liquidity tokens
- Maintain adequate stablecoin reserves for rebalancing
Wallet Security:
- Cold Storage: Hardware wallets (Ledger, Trezor) for long-term holdings
- Hot Wallets: Use reputable Solana-compatible wallets (Phantom, Marinade) for active trading only
- Security Practices: Enable multi-signature authentication; maintain offline backup of private keys
V. Investment Risks and Challenges
Market Risks
- High Volatility: 51% annual decline demonstrates severe price instability
- Low Trading Volume: Insufficient market depth creates execution challenges for significant trades
- Price Manipulation Potential: Small market capitalization increases vulnerability to coordinated trading activity
Regulatory Risks
- Jurisdictional Uncertainty: Content creator compensation mechanisms face potential regulatory classification challenges
- Compliance Changes: Future regulations could impact token utility and value proposition
Technology Risks
- Security Vulnerabilities: Smart contract risks and potential exploitation vectors remain unspecified
- Blockchain Dependency: Solana network incidents could directly impair token functionality
- Development Status: Limited available information regarding active development and maintenance
VI. Conclusion: Is Vodra a Good Investment?
Investment Value Summary
Vodra operates within an emerging niche—decentralized content creator compensation—that addresses real market inefficiencies. However, the project faces significant headwinds:
- Positive Factors: Innovative use case addressing creator economy; built on established Solana blockchain
- Negative Factors: Severe price decline (-51% annually); minimal market adoption (746 holders); low trading liquidity; substantial dilution risk (7.16% circulating)
Investment Verdict: Vodra represents a high-risk, speculative asset suitable only for investors capable of sustaining total loss.
Investor Recommendations
For Beginners:
❌ Not recommended. Extreme volatility and low liquidity make this unsuitable for retail investors without crypto trading experience.
For Experienced Investors:
⚠️ Limited allocation (1-2% maximum) if pursuing speculative plays. Implement strict stop-loss orders; monitor project development closely.
For Institutional Investors:
❌ Insufficient liquidity, market cap, and development clarity for institutional portfolio inclusion.
Disclaimer
⚠️ Important Notice: Cryptocurrency investments carry substantial risk, including potential total loss of capital. This report is provided for informational purposes only and does not constitute investment advice, financial recommendation, or solicitation to buy or sell securities. Investors must conduct independent research and consult qualified financial advisors before making investment decisions. Past performance does not guarantee future results. Vodra's volatility, low liquidity, and early-stage development status make it inappropriate for most investor profiles.
Last Updated: January 3, 2026
Data Source: Gate Cryptocurrency Database
Vodra (VDR) Frequently Asked Questions
I. What is Vodra (VDR) and what problem does it solve?
Answer: Vodra is a blockchain-based platform built on the Solana network designed to enable content creators to receive fair and direct compensation from their audiences. The project addresses a significant market gap where social media platforms facilitate massive content consumption and entertainment value generation, yet creators often struggle to receive equitable compensation for their creative contributions. Vodra establishes transparent market pricing mechanisms that allow creators to monetize their content directly without traditional intermediaries.
II. What is the current price and market position of VDR?
Answer: As of January 3, 2026, VDR trades at $0.0008424 with a market capitalization of approximately $120,584.54 and a fully diluted valuation of $1,684,799.83. The token ranks 4,685 in the global cryptocurrency market by market capitalization, representing a micro-cap asset with 0.000051% market dominance. VDR currently has only 746 token holders and maintains a 24-hour trading volume of approximately $12,440.46 on Gate exchange.
III. What are the major risks associated with VDR investment?
Answer: VDR presents multiple significant risks: (1) Extreme volatility—the token has declined 98.93% from its all-time high of $0.078702 and dropped 51.15% over the past year; (2) Low liquidity with minimal daily trading volume ($12,440) relative to market capitalization, creating execution challenges; (3) Supply dilution risk—only 7.16% of the maximum 2 billion tokens are currently circulating, presenting substantial downward pressure when additional tokens enter circulation; (4) Concentration risk with only 746 token holders; (5) Limited adoption with minimal institutional backing or mainstream market penetration; (6) Regulatory uncertainty regarding content creator compensation tokenization across jurisdictions.
IV. What is the token supply structure and dilution risk?
Answer: VDR has a maximum supply of 2,000,000,000 tokens with only 143,144,036 tokens currently in circulation, representing a 7.16% circulation ratio. This significant gap between circulating and total supply indicates substantial dilution potential. As additional tokens unlock according to vesting schedules and enter circulation, significant downward price pressure may occur without corresponding demand growth. Investors should carefully monitor token unlock schedules and emission rates, as future supply expansion could substantially impact long-term price appreciation prospects.
V. What are the price predictions for VDR through 2031?
Answer: Price forecasts vary considerably based on different scenarios: Short-term (2026): Conservative estimates range from $0.000632-$0.000842; neutral forecasts predict $0.000842-$0.001213; optimistic scenarios suggest $0.001213 and above. Mid-term (2027-2029): Predictions range between $0.000572-$0.001154. Long-term outlook (through 2031): Base case suggests $0.000738-$0.001462; optimistic scenario predicts $0.001200-$0.001694; transformative scenario (contingent on breakthrough adoption) suggests $0.002000 and above. However, these forecasts carry substantial uncertainty and should not be considered as investment recommendations given the speculative nature of price prediction.
VI. Is Vodra suitable for beginner cryptocurrency investors?
Answer: Vodra is not recommended for beginner investors. The token exhibits extreme volatility (51% annual decline), operates with minimal liquidity ($12,440 daily trading volume), maintains a small holder base (746 addresses) indicating concentration risk, and represents an early-stage project with unproven market adoption. These characteristics create execution challenges and substantial loss potential inappropriate for investors without extensive cryptocurrency trading experience. Beginners should focus on established cryptocurrencies with greater liquidity, larger market capitalizations, and documented adoption before considering speculative micro-cap assets like VDR.
VII. What blockchain infrastructure does Vodra use and what are the associated risks?
Answer: Vodra operates on the Solana blockchain, benefiting from Solana's lower transaction costs and computational efficiency compared to alternative networks. However, this positioning creates dependency risk—any vulnerabilities in the Solana network, network outages, or security incidents could directly impair VDR token functionality and value. Additionally, Solana network congestion or technical issues could impact trading and transaction execution. While Solana represents an established blockchain platform, investors should recognize that VDR's security and operability remain dependent on Solana's continued reliability and development.
VIII. What investment allocation strategy is recommended for VDR?
Answer: VDR should only be considered within aggressive, high-risk-tolerance portfolios with strict allocation limits: (1) Conservative investors—not recommended due to extreme volatility and limited adoption; (2) Experienced/aggressive investors—maximum 1-2% portfolio allocation with mandatory stop-loss orders and active monitoring of project development; (3) Institutional investors—generally unsuitable given insufficient liquidity, limited market capitalization, and early-stage development status. Any VDR position should be combined with diversified established cryptocurrencies and traditional assets. Maintain adequate stablecoin reserves for rebalancing and employ cold storage (hardware wallets) for long-term holdings with reputable Solana-compatible wallets for active trading only.
Disclaimer: This FAQ is provided for informational purposes only and does not constitute investment advice, financial recommendations, or solicitation to buy or sell securities. Cryptocurrency investments carry substantial risk including potential total loss of capital. Readers must conduct independent research and consult qualified financial advisors before making investment decisions. Past performance does not guarantee future results.
* The information is not intended to be and does not constitute financial advice or any other recommendation of any sort offered or endorsed by Gate.