The article provides a comprehensive comparison between MAIGA and HBAR, focusing on their historical price trends, consensus mechanisms, market statuses, and technical frameworks. It addresses questions of investment value, risk management, and technological differentiation, suitable for both conservative and aggressive investors. Through the analysis of MAIGA's AI-driven DeFi platform and HBAR's hashgraph consensus technology, the article evaluates which token offers better market performance and risk-adjusted returns. Key insights include liquidity metrics, market position, and macroeconomic factors influencing investment decisions. Data sourced from Gate enhances credibility and relevance.
Introduction: MAIGA vs HBAR Investment Comparison
In the cryptocurrency market, comparisons between MAIGA and HBAR are a topic that investors cannot overlook. The two assets exhibit notable differences in market capitalization ranking, application scenarios, and price performance, representing distinct positions within the crypto asset landscape.
MAIGA (MAIGA): Launched in 2025, it has gained market recognition through its AI-powered decentralized finance and crypto trading platform that combines advanced technologies such as Model Context Protocol (MCP), Trusted Execution Environments (TEE), and zero-knowledge proofs (ZK-proofs), with a core Proof of Trading (PoT) consensus model linking token distribution directly to verified trading activity.
HBAR (HBAR): Since its launch in 2020, it has been recognized as a public ledger network utilizing hashgraph consensus technology, designed for fast (>10,000+ TPS), secure (aBFT), and fair transactions, serving as the native cryptocurrency of the Hedera public network to support distributed applications and protect the network from malicious actors.
This article will provide a comprehensive analysis of the investment value comparison between MAIGA and HBAR across historical price trends, supply mechanisms, market adoption, and technical ecosystems, while attempting to address the question investors care most about:
"Which is the better buy right now?"
Comparative Analysis Report: MAIGA vs HBAR
I. Historical Price Comparison and Current Market Status
MAIGA and HBAR Historical Price Trends
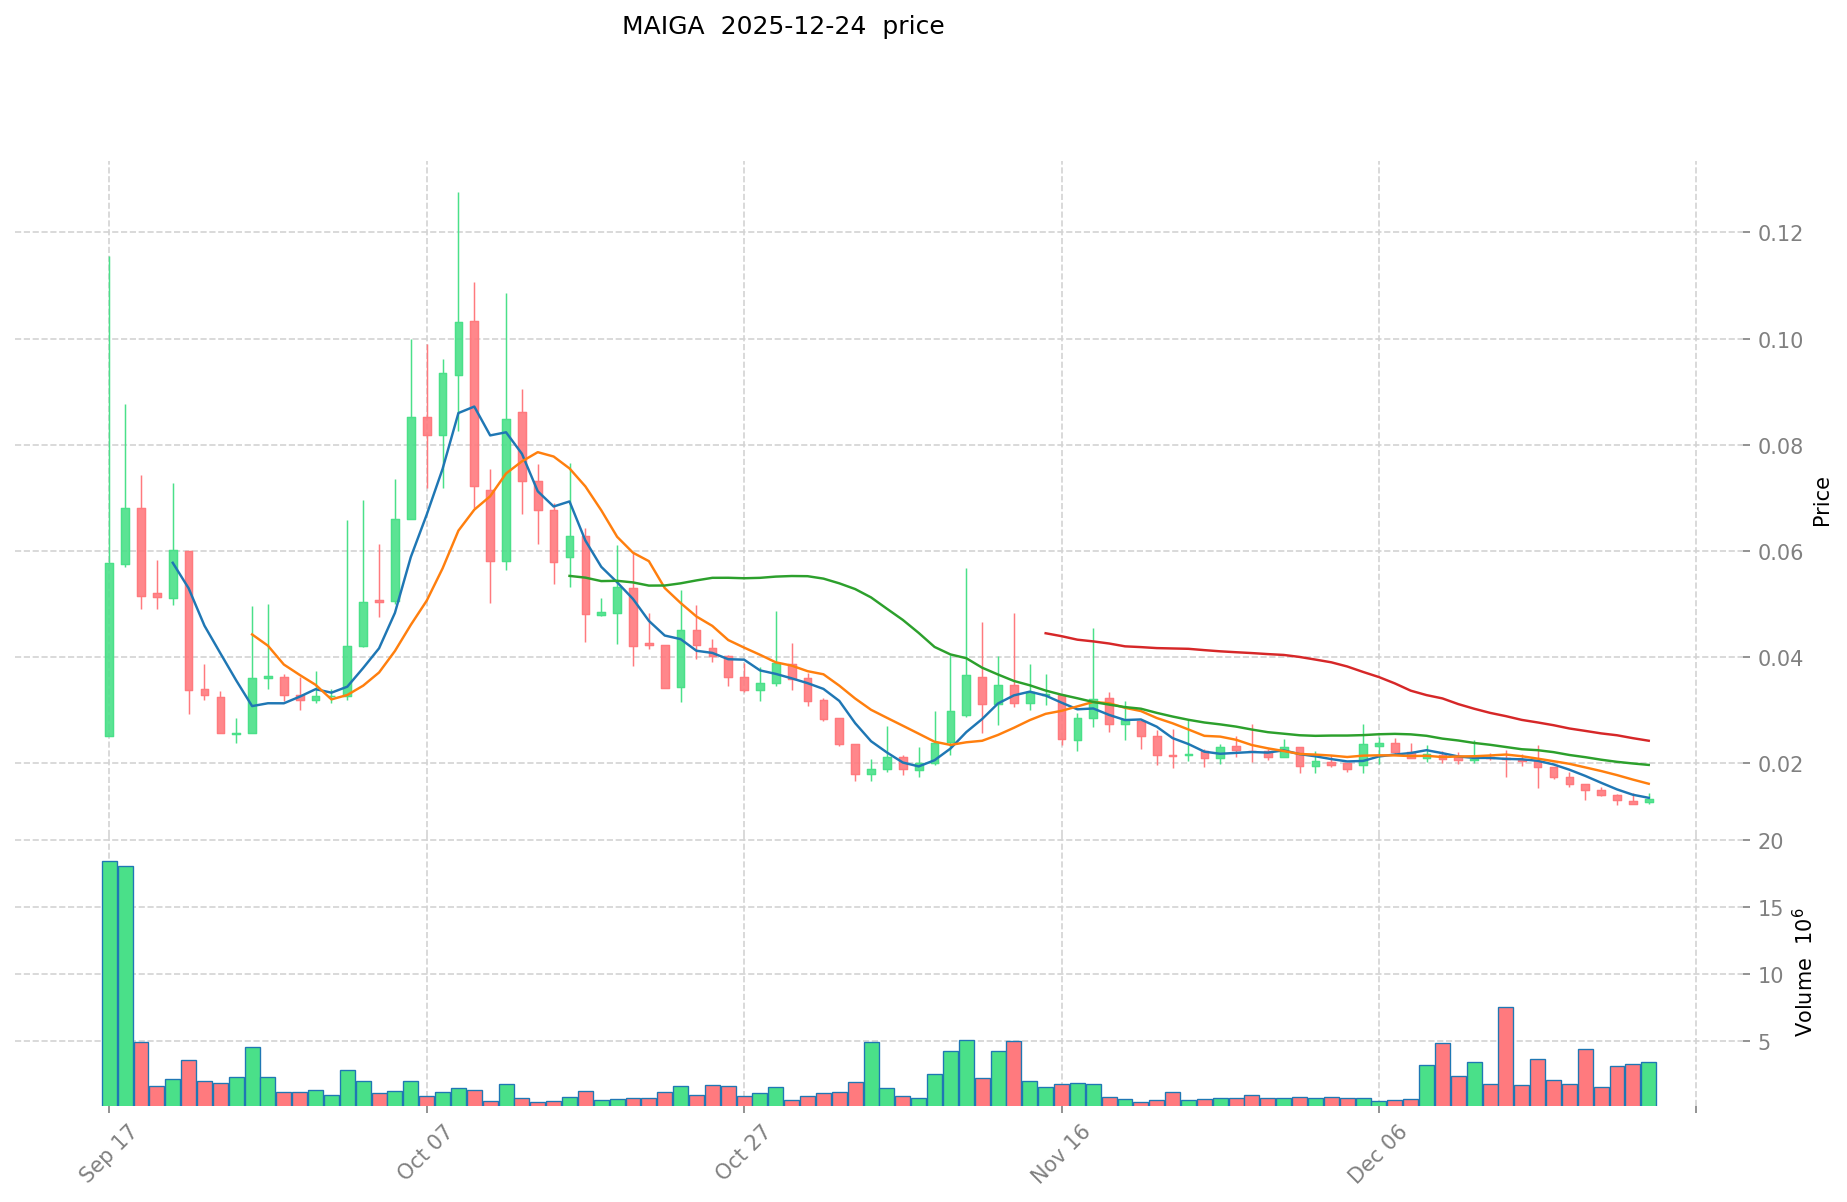
MAIGA Price Movement:
- All-time high: USD 0.12768 (October 9, 2025)
- All-time low: USD 0.012 (December 21, 2025)
- Historical decline from peak: approximately 90.5% depreciation over approximately 2.5 months
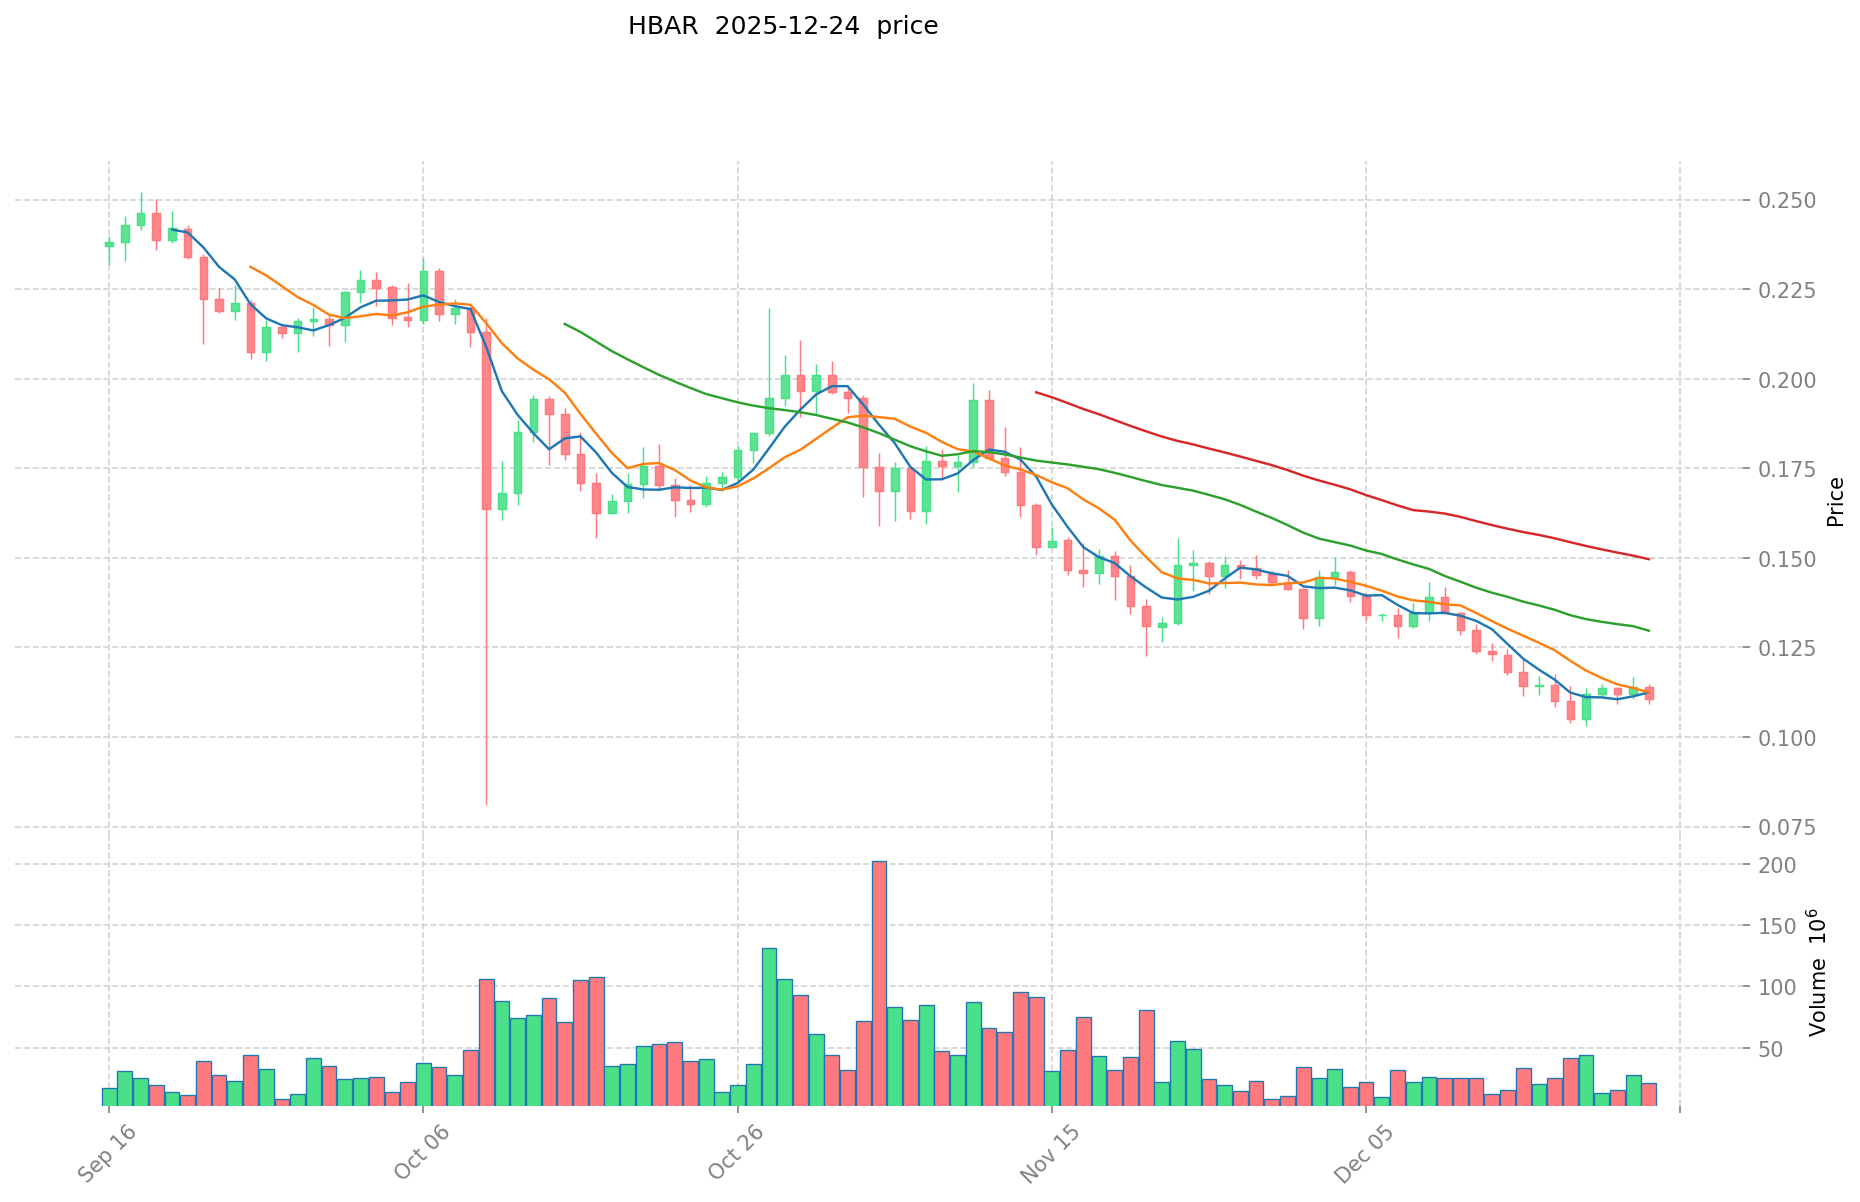
HBAR Price Movement:
- All-time high: USD 0.569229 (September 15, 2021)
- All-time low: USD 0.00986111 (January 3, 2020)
- Long-term perspective: HBAR has experienced significant volatility since its inception, with the current price representing a substantial recovery from its all-time low but significantly below its historical peak
Comparative Analysis:
MAIGA demonstrates extreme recent volatility within a compressed timeframe, declining 90.5% in approximately 2.5 months from its recent peak. In contrast, HBAR's historical data reflects longer-term market cycles typical of established blockchain projects, with its peak occurring in 2021 during the broader cryptocurrency market expansion phase.
Current Market Status (December 24, 2025)
MAIGA:
- Current price: USD 0.0132
- 24-hour change: +3.58%
- 24-hour trading volume: USD 43,019.46
- Market capitalization: USD 3,696,000.00
- Fully diluted valuation: USD 13,200,000.00
- Market dominance: 0.00041%
HBAR:
- Current price: USD 0.11054
- 24-hour change: -1.37%
- 24-hour trading volume: USD 2,220,716.18
- Market capitalization: USD 4,728,537,370.21
- Fully diluted valuation: USD 5,527,000,000.00
- Market dominance: 0.17%
Market Sentiment Index:
- Crypto Fear & Greed Index: 24 (Extreme Fear)
Current Price References:
II. Project Architecture and Technical Framework
Core Technology Stack:
- Model Context Protocol (MCP) integration for enhanced AI functionality
- Trusted Execution Environments (TEE) for secure computation
- Multimodal input capabilities
- Zero-knowledge proofs (ZK-proofs) for transaction privacy
Consensus Mechanism:
MAIGA operates on a proprietary Proof of Trading (PoT) consensus model, which represents a fundamental departure from traditional token distribution mechanisms. Under this model, token allocation and value accrual are directly linked to verified trading activity rather than passive holding or linear time-based unlock schedules.
Network Infrastructure:
- Blockchain: BSC (Binance Smart Chain)
- Contract address: 0xcd1679f117e81defc4f0009311ddc23fc1ae4a5e
- Total supply: 1,000,000,000 tokens
- Circulating supply: 280,000,000 tokens (28% circulation ratio)
- Token holders: 62,102
HBAR: Hashgraph Consensus Network
Core Technology Stack:
- Hashgraph consensus algorithm for distributed ledger operations
- Asynchronous Byzantine Fault Tolerance (aBFT) security model
- Transaction throughput: >10,000+ TPS (transactions per second)
- Public ledger with transparent time-stamping of all activities
Consensus Mechanism:
HBAR utilizes a hash graph consensus form, which creates a fast, secure, and fair public ledger network. The consensus process achieves high speed through a unique block addition system that does not require block discarding.
Network Infrastructure:
- Fully diluted token supply: 50,000,000,000 tokens
- Circulating supply: 42,776,708,614.14 tokens (85.55% circulation ratio)
- Governance structure: 39-member entity council including universities, industry institutions, and non-profit organizations
Price Volatility Metrics (7-Day and 30-Day Periods)
MAIGA Short-Term Performance:
- 7-day change: -28.98%
- 30-day change: -44.99%
- 1-year change: -85.83%
- 1-hour change: +0.84%
HBAR Short-Term Performance:
- 7-day change: -2.79%
- 30-day change: -26.55%
- 1-year change: -62.08%
- 1-hour change: +1.35%
Trading Liquidity and Exchange Distribution
MAIGA:
- Number of active exchanges: 8
- 24-hour trading volume: USD 43,019.46
- Market ranking: 1,726
HBAR:
- Number of active exchanges: 48
- 24-hour trading volume: USD 2,220,716.18
- Market ranking: 30
- Established exchange presence: Multiple tier-1 and tier-2 centralized exchanges
IV. Comparative Summary and Differentiation
Scale and Market Position
HBAR maintains significantly greater market capitalization (USD 4.73 billion vs USD 3.7 million), substantially higher trading volume, and broader exchange distribution. MAIGA represents an emerging project with considerably smaller market presence and liquidity.
Technology Differentiation
MAIGA emphasizes AI integration with activity-based token economics through its Proof of Trading model. HBAR focuses on consensus efficiency and scalability through its hashgraph algorithm, positioning itself as infrastructure-layer technology rather than application-specific protocol.
Risk Profile
Both assets exhibit elevated volatility. MAIGA's recent price compression combined with limited liquidity suggests heightened speculative risk. HBAR's established market position and broader adoption across exchanges provide comparatively greater liquidity, though price volatility remains significant relative to cryptocurrency market benchmarks.
Current Market Environment
The Crypto Fear & Greed Index reading of 24 (Extreme Fear) indicates widespread market pessimism. Under these conditions, both assets demonstrate downward pressure, with MAIGA experiencing more pronounced percentage declines despite positive 24-hour performance.
Report Date: December 24, 2025
Data Source: Gate, CoinGecko, Binance, and Referenced Market Data Aggregators
Disclaimer: This analysis is provided for informational purposes only and does not constitute investment advice, financial guidance, or recommendations for asset purchase or sale.
Investment Value Analysis: MAIGA vs HBAR
I. Executive Summary
Based on available research materials, this report examines the investment value drivers of MAIGA and HBAR through the lens of consensus mechanisms, technological architecture, and macroeconomic factors. MAIGA emphasizes transaction-based value creation through its Proof of Transaction (PoT) model, while HBAR's value proposition centers on Hedera Hashgraph's transaction efficiency and enterprise adoption capabilities.
II. Core Factors Affecting Investment Value of MAIGA vs HBAR
Consensus Mechanism & Token Economics
MAIGA: Proof of Transaction (PoT) Model
- Token allocation and value growth are directly linked to verified transaction activity rather than passive holding or linear time-based unlocking
- The MAIGA token operates within an AI agent economy ecosystem focused on DeFi, cryptocurrency, and prediction markets
- Value accrual mechanism is performance-driven rather than dilution-resistant
HBAR: Hedera Hashgraph Architecture
- Investment value depends on widespread adoption of Hedera Hashgraph and efficient transaction processing capabilities
- Pricing follows enterprise utility and network transaction volume
Historical Pattern: Transaction-based consensus models create direct incentives for ecosystem participation, potentially supporting stronger adoption curves compared to traditional proof-of-stake mechanisms.
Technology Architecture & Ecosystem Development
MAIGA Technology Stack
- Incorporates Trusted Execution Environment (TEE), Message Control Protocol (MCP), and Zero-Knowledge Proofs (ZK-proof)
- Builds AI agent launch platform on BNB Chain
- Ecosystem focus: DeFi protocols, cryptocurrency infrastructure, and prediction market applications
HBAR Technical Infrastructure
- High-efficiency transaction processing capabilities
- Enterprise-grade network infrastructure
- Value proposition: institutional-grade reliability and throughput
Ecosystem Comparison: MAIGA emphasizes AI-driven DeFi innovation on established Layer 1 infrastructure, while HBAR positions itself as an alternative consensus layer for enterprise applications.
Macroeconomic Environment & Market Conditions
Federal Reserve Policy Impact
- Macroeconomic environment—particularly the Federal Reserve's interest rate trajectory, dot plot expectations, and USD Index movements—determines shifts in risk appetite
- These factors constitute core signals for asset pricing
Market Sentiment & Risk Preferences
- Both assets are influenced by broader cryptocurrency market cycles
- Leverage liquidation events and derivative markets significantly impact short-term price discovery
- Institutional accumulation patterns during volatility periods affect medium-term valuations
Macroeconomic Factors Affecting Both Assets
- US dollar dominance in international trade and commodity pricing
- Global economic trends, regulatory policy, and technological innovation
- Market sentiment and investor risk tolerance
Report Date: December 24, 2025
Disclaimer: This analysis is based on available source materials and does not constitute investment advice. Cryptocurrency markets remain highly volatile and subject to regulatory uncertainty. Investors should conduct independent due diligence and consult with qualified financial advisors before making investment decisions.
III. 2025-2030 Price Forecast: MAIGA vs HBAR
Short-term Forecast (2025)
- MAIGA: Conservative $0.0111-$0.0133 | Optimistic $0.0133-$0.0142
- HBAR: Conservative $0.0654-$0.1109 | Optimistic $0.1109-$0.1286
Mid-term Forecast (2027-2028)
- MAIGA is expected to consolidate in the growth phase, with anticipated price range of $0.0100-$0.0193, showing a cumulative gain of approximately 17-31% from 2025 baseline.
- HBAR may enter an accumulation expansion phase, with anticipated price range of $0.1123-$0.1803, demonstrating resilience with 22-31% appreciation potential.
- Key drivers: Institutional capital inflows, ETF adoption, ecosystem development and utility expansion.
Long-term Forecast (2029-2030)
- MAIGA: Base case scenario $0.0175-$0.0186 | Optimistic scenario $0.0263-$0.0273
- HBAR: Base case scenario $0.1156-$0.1629 | Optimistic scenario $0.2245-$0.2052
For detailed MAIGA and HBAR price predictions and market analysis, please refer to professional crypto analytics platforms.
Disclaimer: This analysis is based on historical data patterns and statistical models. Cryptocurrency markets are highly volatile and unpredictable. Past performance does not guarantee future results. This forecast should not be considered as financial advice or investment recommendation. Please conduct thorough due diligence and consult qualified financial advisors before making investment decisions.
MAIGA:
| 年份 |
预测最高价 |
预测平均价格 |
预测最低价 |
涨跌幅 |
| 2025 |
0.0141989 |
0.01327 |
0.0111468 |
0 |
| 2026 |
0.0171680625 |
0.01373445 |
0.011536938 |
4 |
| 2027 |
0.0193140703125 |
0.01545125625 |
0.0100433165625 |
17 |
| 2028 |
0.019816236140625 |
0.01738266328125 |
0.015470570320312 |
31 |
| 2029 |
0.027341191075078 |
0.018599449710937 |
0.017483482728281 |
40 |
| 2030 |
0.026875274859819 |
0.022970320393007 |
0.016308927479035 |
74 |
HBAR:
| 年份 |
预测最高价 |
预测平均价格 |
预测最低价 |
涨跌幅 |
| 2025 |
0.128586 |
0.11085 |
0.0654015 |
0 |
| 2026 |
0.15084468 |
0.119718 |
0.09218286 |
8 |
| 2027 |
0.155573541 |
0.13528134 |
0.1122835122 |
22 |
| 2028 |
0.18033002622 |
0.1454274405 |
0.138156068475 |
31 |
| 2029 |
0.2052272040336 |
0.16287873336 |
0.1156439006856 |
47 |
| 2030 |
0.224544621810096 |
0.1840529686968 |
0.169328731201056 |
66 |
Comparative Investment Analysis Report: MAIGA vs HBAR
I. Historical Price Comparison and Current Market Status
MAIGA and HBAR Historical Price Trends
MAIGA Price Movement:
- All-time high: USD 0.12768 (October 9, 2025)
- All-time low: USD 0.012 (December 21, 2025)
- Historical decline from peak: approximately 90.5% depreciation over approximately 2.5 months
HBAR Price Movement:
- All-time high: USD 0.569229 (September 15, 2021)
- All-time low: USD 0.00986111 (January 3, 2020)
- Long-term perspective: HBAR has experienced significant volatility since its inception, with the current price representing a substantial recovery from its all-time low but significantly below its historical peak
Comparative Analysis:
MAIGA demonstrates extreme recent volatility within a compressed timeframe, declining 90.5% in approximately 2.5 months from its recent peak. In contrast, HBAR's historical data reflects longer-term market cycles typical of established blockchain projects, with its peak occurring in 2021 during the broader cryptocurrency market expansion phase.
Current Market Status (December 24, 2025)
MAIGA:
- Current price: USD 0.0132
- 24-hour change: +3.58%
- 24-hour trading volume: USD 43,019.46
- Market capitalization: USD 3,696,000.00
- Fully diluted valuation: USD 13,200,000.00
- Market dominance: 0.00041%
HBAR:
- Current price: USD 0.11054
- 24-hour change: -1.37%
- 24-hour trading volume: USD 2,220,716.18
- Market capitalization: USD 4,728,537,370.21
- Fully diluted valuation: USD 5,527,000,000.00
- Market dominance: 0.17%
Market Sentiment Index:
- Crypto Fear & Greed Index: 24 (Extreme Fear)
II. Project Architecture and Technical Framework
Core Technology Stack:
- Model Context Protocol (MCP) integration for enhanced AI functionality
- Trusted Execution Environments (TEE) for secure computation
- Multimodal input capabilities
- Zero-knowledge proofs (ZK-proofs) for transaction privacy
Consensus Mechanism:
MAIGA operates on a proprietary Proof of Trading (PoT) consensus model, which represents a fundamental departure from traditional token distribution mechanisms. Under this model, token allocation and value accrual are directly linked to verified trading activity rather than passive holding or linear time-based unlock schedules.
Network Infrastructure:
- Blockchain: BSC (Binance Smart Chain)
- Contract address: 0xcd1679f117e81defc4f0009311ddc23fc1ae4a5e
- Total supply: 1,000,000,000 tokens
- Circulating supply: 280,000,000 tokens (28% circulation ratio)
- Token holders: 62,102
HBAR: Hashgraph Consensus Network
Core Technology Stack:
- Hashgraph consensus algorithm for distributed ledger operations
- Asynchronous Byzantine Fault Tolerance (aBFT) security model
- Transaction throughput: >10,000+ TPS (transactions per second)
- Public ledger with transparent time-stamping of all activities
Consensus Mechanism:
HBAR utilizes a hashgraph consensus form, which creates a fast, secure, and fair public ledger network. The consensus process achieves high speed through a unique architecture that does not require block discarding.
Network Infrastructure:
- Fully diluted token supply: 50,000,000,000 tokens
- Circulating supply: 42,776,708,614.14 tokens (85.55% circulation ratio)
- Governance structure: 39-member entity council including universities, industry institutions, and non-profit organizations
Price Volatility Metrics
MAIGA Short-Term Performance:
- 7-day change: -28.98%
- 30-day change: -44.99%
- 1-year change: -85.83%
HBAR Short-Term Performance:
- 7-day change: -2.79%
- 30-day change: -26.55%
- 1-year change: -62.08%
Trading Liquidity and Exchange Distribution
MAIGA:
- Number of active exchanges: 8
- 24-hour trading volume: USD 43,019.46
- Market ranking: 1,726
HBAR:
- Number of active exchanges: 48
- 24-hour trading volume: USD 2,220,716.18
- Market ranking: 30
- Established exchange presence: Multiple tier-1 and tier-2 centralized exchanges
Scale and Market Position
HBAR maintains significantly greater market capitalization (USD 4.73 billion vs USD 3.7 million), substantially higher trading volume, and broader exchange distribution. MAIGA represents an emerging project with considerably smaller market presence and liquidity.
IV. Investment Strategy Comparison: MAIGA vs HBAR
Long-Term vs Short-Term Investment Strategies
MAIGA: Suitable for investors with high risk tolerance who focus on AI-driven DeFi ecosystem potential and early-stage technology adoption. The Proof of Trading model creates direct incentives for transaction participation, potentially supporting stronger adoption curves in emerging DeFi applications.
HBAR: Suitable for investors seeking more established infrastructure exposure with enterprise-grade reliability. HBAR's hashgraph technology and broader exchange distribution provide comparatively greater stability for investors prioritizing network infrastructure development and institutional adoption.
Risk Management and Asset Allocation
Conservative Investors:
- MAIGA: 5-10% (maximum exposure to emerging technology)
- HBAR: 15-25% (established infrastructure allocation)
- Stablecoin allocation: 60-75%
Aggressive Investors:
- MAIGA: 20-35% (higher-risk emerging project exposure)
- HBAR: 25-35% (core infrastructure layer)
- Diversified altcoin allocation: 25-40%
Hedging Tools: Stablecoin positioning to capture volatility, options strategies for downside protection during extreme fear periods (current index: 24), cross-asset diversification between infrastructure and application layers.
V. Potential Risk Comparison
Market Risk
MAIGA: Extreme price volatility within compressed timeframes (90.5% decline over 2.5 months), limited trading liquidity on only 8 exchanges, and small market capitalization create significant drawdown exposure. Early-stage projects face elevated risk of sustained bear market underperformance.
HBAR: Established project history since 2020 demonstrates broader market cycle experience. However, the asset remains substantially below its 2021 all-time high, indicating potential for extended consolidation periods. Broader exchange distribution mitigates extreme liquidity risk.
Technology Risk
MAIGA: Dependency on Binance Smart Chain ecosystem creates exposure to BSC network stability and smart contract vulnerability. The Proof of Trading model remains relatively untested at scale compared to traditional consensus mechanisms.
HBAR: Hashgraph consensus architecture has demonstrated operational stability since network inception. However, concentration within the 39-member council structure creates governance centralization risk relative to truly decentralized networks.
Regulatory Risk
Both assets operate within cryptocurrency markets subject to evolving regulatory frameworks globally. MAIGA's AI-driven platform and DeFi focus may face increased scrutiny from financial regulators examining algorithmic trading and privacy features. HBAR's enterprise positioning and governance council membership may facilitate clearer regulatory classification, though no assurances exist regarding future policy developments.
VI. Conclusion: Which Is the Better Buy?
📌 Investment Value Summary:
MAIGA Advantages:
- Innovative Proof of Trading consensus model linking token economics directly to ecosystem participation
- AI-driven DeFi platform integration with emerging privacy technologies (TEE, ZK-proofs)
- Potential for substantial appreciation from current depressed valuation levels
- Early-stage project in growth phase with limited market saturation
HBAR Advantages:
- Established project with 5-year operational history and proven network stability
- Superior transaction throughput (>10,000 TPS) and enterprise-grade consensus technology
- Significantly larger market capitalization (USD 4.73 billion) with lower concentration risk
- Broader exchange distribution and institutional recognition
- 85.55% circulation ratio providing clearer token economics clarity
✅ Investment Recommendations:
Beginner Investors:
Focus on HBAR as the primary position. Its established infrastructure, broader exchange availability, and enterprise adoption create comparatively lower technical complexity for understanding and monitoring. MAIGA exposure, if pursued, should be limited to 5-10% maximum portfolio allocation to manage early-stage project risk.
Experienced Investors:
Consider a blended approach with core HBAR position (60-70% of crypto allocation) to maintain infrastructure layer exposure, supplemented with tactical MAIGA allocation (15-25%) capturing emerging technology dynamics. Implement strict stop-loss discipline given current elevated volatility environment (Fear & Greed Index: 24).
Institutional Investors:
HBAR represents the more suitable allocation for institutional portfolios due to market depth, regulatory clarity potential, and alignment with infrastructure-layer investment thesis. MAIGA remains too nascent and illiquid (USD 43k daily volume) for meaningful institutional exposure without creating significant market impact risk.
⚠️ Risk Disclaimer: Cryptocurrency markets exhibit extreme volatility and remain subject to regulatory uncertainty. The Crypto Fear & Greed Index reading of 24 (Extreme Fear) indicates heightened market stress. Both MAIGA and HBAR have experienced substantial price declines over recent periods. This analysis is provided for informational purposes only and does not constitute investment advice, financial guidance, or recommendations for asset purchase or sale. Investors must conduct independent due diligence and consult qualified financial advisors before making investment decisions. Past performance does not guarantee future results.
Report Date: December 24, 2025
Data Sources: Gate, CoinGecko, market aggregators
Disclaimer: This analysis is based solely on provided reference materials and does not represent independent research or original forecasting.
None
Frequently Asked Questions: MAIGA vs HBAR Investment Comparison
I. What are the key differences between MAIGA and HBAR's consensus mechanisms?
Answer: MAIGA operates on a Proof of Trading (PoT) consensus model where token allocation and value accrual are directly linked to verified trading activity rather than passive holding. In contrast, HBAR utilizes hashgraph consensus technology with Asynchronous Byzantine Fault Tolerance (aBFT), designed to achieve transaction throughput exceeding 10,000 TPS with focus on network infrastructure efficiency rather than activity-based incentives.
II. Which asset demonstrates higher liquidity and market maturity?
Answer: HBAR significantly outpaces MAIGA in liquidity metrics. HBAR maintains USD 2.22 million in 24-hour trading volume across 48 active exchanges with a market capitalization of USD 4.73 billion, ranking 30th globally. MAIGA shows only USD 43,019 daily volume on 8 exchanges with a USD 3.7 million market cap, ranking 1,726th. HBAR's superior liquidity and broader exchange distribution indicate substantially greater market maturity and institutional adoption.
III. What explains MAIGA's extreme price volatility compared to HBAR?
Answer: MAIGA experienced a 90.5% price decline over 2.5 months (from USD 0.12768 to USD 0.012), while HBAR's volatility occurs within longer-term cycles typical of established blockchain projects. MAIGA's extreme volatility reflects characteristics of early-stage projects: limited liquidity depth, smaller market capitalization, concentrated token holder distribution (62,102 holders), and speculative positioning. HBAR's 5-year operational history demonstrates longer market cycle resilience, though it remains substantially below its 2021 peak of USD 0.569229.
IV. How do the token supply structures differ between these assets?
Answer: MAIGA operates with 1 billion total supply and 280 million circulating tokens (28% circulation ratio), suggesting significant future dilution potential from unlocked tokens. HBAR maintains 50 billion total supply with 42.78 billion circulating tokens (85.55% circulation ratio), indicating substantially advanced token distribution maturity and reduced future dilution pressure. HBAR's higher circulation ratio provides greater supply clarity for investors evaluating long-term tokenomics.
V. Which asset is more suitable for conservative vs aggressive investors?
Answer: Conservative investors should prioritize HBAR as the core position due to established infrastructure, enterprise adoption, and 85.55% token circulation providing supply predictability. Maximum MAIGA exposure should remain 5-10% for conservative portfolios. Aggressive investors may allocate 20-35% to MAIGA while maintaining 25-35% HBAR core position, though this requires strict stop-loss discipline given current extreme fear market conditions (Fear & Greed Index: 24).
VI. What are the primary technology differentiation factors between MAIGA and HBAR?
Answer: MAIGA emphasizes AI-driven DeFi innovation through Model Context Protocol (MCP) integration, Trusted Execution Environments (TEE), and zero-knowledge proofs on Binance Smart Chain infrastructure. HBAR focuses on providing enterprise-grade consensus layer technology with hashgraph architecture delivering security, speed, and fairness guarantees. MAIGA represents application-layer innovation while HBAR functions as infrastructure-layer technology for distributed applications.
VII. Given current market conditions, which asset presents better risk-adjusted returns?
Answer: Current market conditions (Crypto Fear & Greed Index: 24, indicating extreme fear) favor HBAR for risk-adjusted returns. HBAR's established market position, superior trading volume (51.6x higher), broader exchange distribution, and institutional recognition create comparatively lower volatility exposure within cryptocurrency risk parameters. While MAIGA may offer higher percentage appreciation potential from depressed valuations, the extreme liquidity constraints and recent 90.5% drawdown create uncompensated risk for most investor profiles. HBAR aligns better with disciplined risk management during extreme fear periods.
VIII. What macroeconomic factors should influence MAIGA vs HBAR investment decisions?
Answer: Federal Reserve interest rate policy, USD Index movements, and broader risk sentiment significantly impact both assets. During periods of tight monetary policy and elevated interest rates, investors typically reduce cryptocurrency allocation and migrate toward less volatile assets. The current extreme fear sentiment suggests institutional capital remains constrained. HBAR's enterprise adoption thesis may benefit from eventual normalization of monetary conditions and institutional accumulation patterns. MAIGA's early-stage profile creates higher dependency on speculative risk appetite recovery and specific AI-ecosystem narrative strength, making macroeconomic timing critical for tactical entry points.
Disclaimer: This FAQ is provided for informational purposes only and does not constitute investment advice, financial guidance, or asset purchase recommendations. Cryptocurrency markets exhibit extreme volatility and regulatory uncertainty. Both MAIGA and HBAR have experienced substantial recent price declines. Investors must conduct independent due diligence and consult qualified financial advisors before making investment decisions. Past performance does not guarantee future results.
Report Date: December 24, 2025
Data Sources: Gate, CoinGecko, market aggregators
* The information is not intended to be and does not constitute financial advice or any other recommendation of any sort offered or endorsed by Gate.