# Article Overview: NBOT vs XRP Investment Comparison
This comprehensive analysis compares NBOT and XRP across historical price performance, tokenomics, institutional adoption, and technical infrastructure to help investors determine which digital asset offers superior investment potential. The article addresses critical questions: how do these assets differ in market resilience, regulatory environment, and growth trajectory through 2031? Designed for beginner to institutional investors, it provides evidence-based investment strategies, risk assessments, and allocation recommendations tailored to different risk profiles. Structured through price analysis, core value factors, multi-year predictions, and actionable strategies, this guide clarifies that XRP suits conservative investors seeking established payment infrastructure, while NBOT attracts risk-tolerant investors targeting emerging DeFi opportunities. Real-time price data from Gate ensures informed decision-making.
Introduction: NBOT vs XRP Investment Comparison
In the cryptocurrency market, comparisons between NBOT and XRP have always been a topic that investors cannot avoid. The two assets exhibit significant differences in market cap ranking, application scenarios, and price performance, representing distinct positioning within the crypto asset landscape.
NBOT (NBOT): Launched in January 2019, it has gained market recognition through its decentralized finance ecosystem and synthetic asset trading platform capabilities, built on the Naka blockchain.
XRP (XRP): Established in 2011 as the native digital asset of the XRP Ledger, it has been recognized for its payment-focused infrastructure, featuring fast transaction speeds (approximately 3 seconds per transaction), low costs ($0.0002 per transaction), and high scalability (1,500+ tps).
This article will provide a comprehensive analysis of the investment value comparison between NBOT and XRP across historical price performance, supply mechanisms, market adoption, and technical ecosystems, attempting to answer the question investors care most about:
"Which is the better buy right now?"
I. Historical Price Comparison and Current Market Status
NBOT and XRP Historical Price Trends
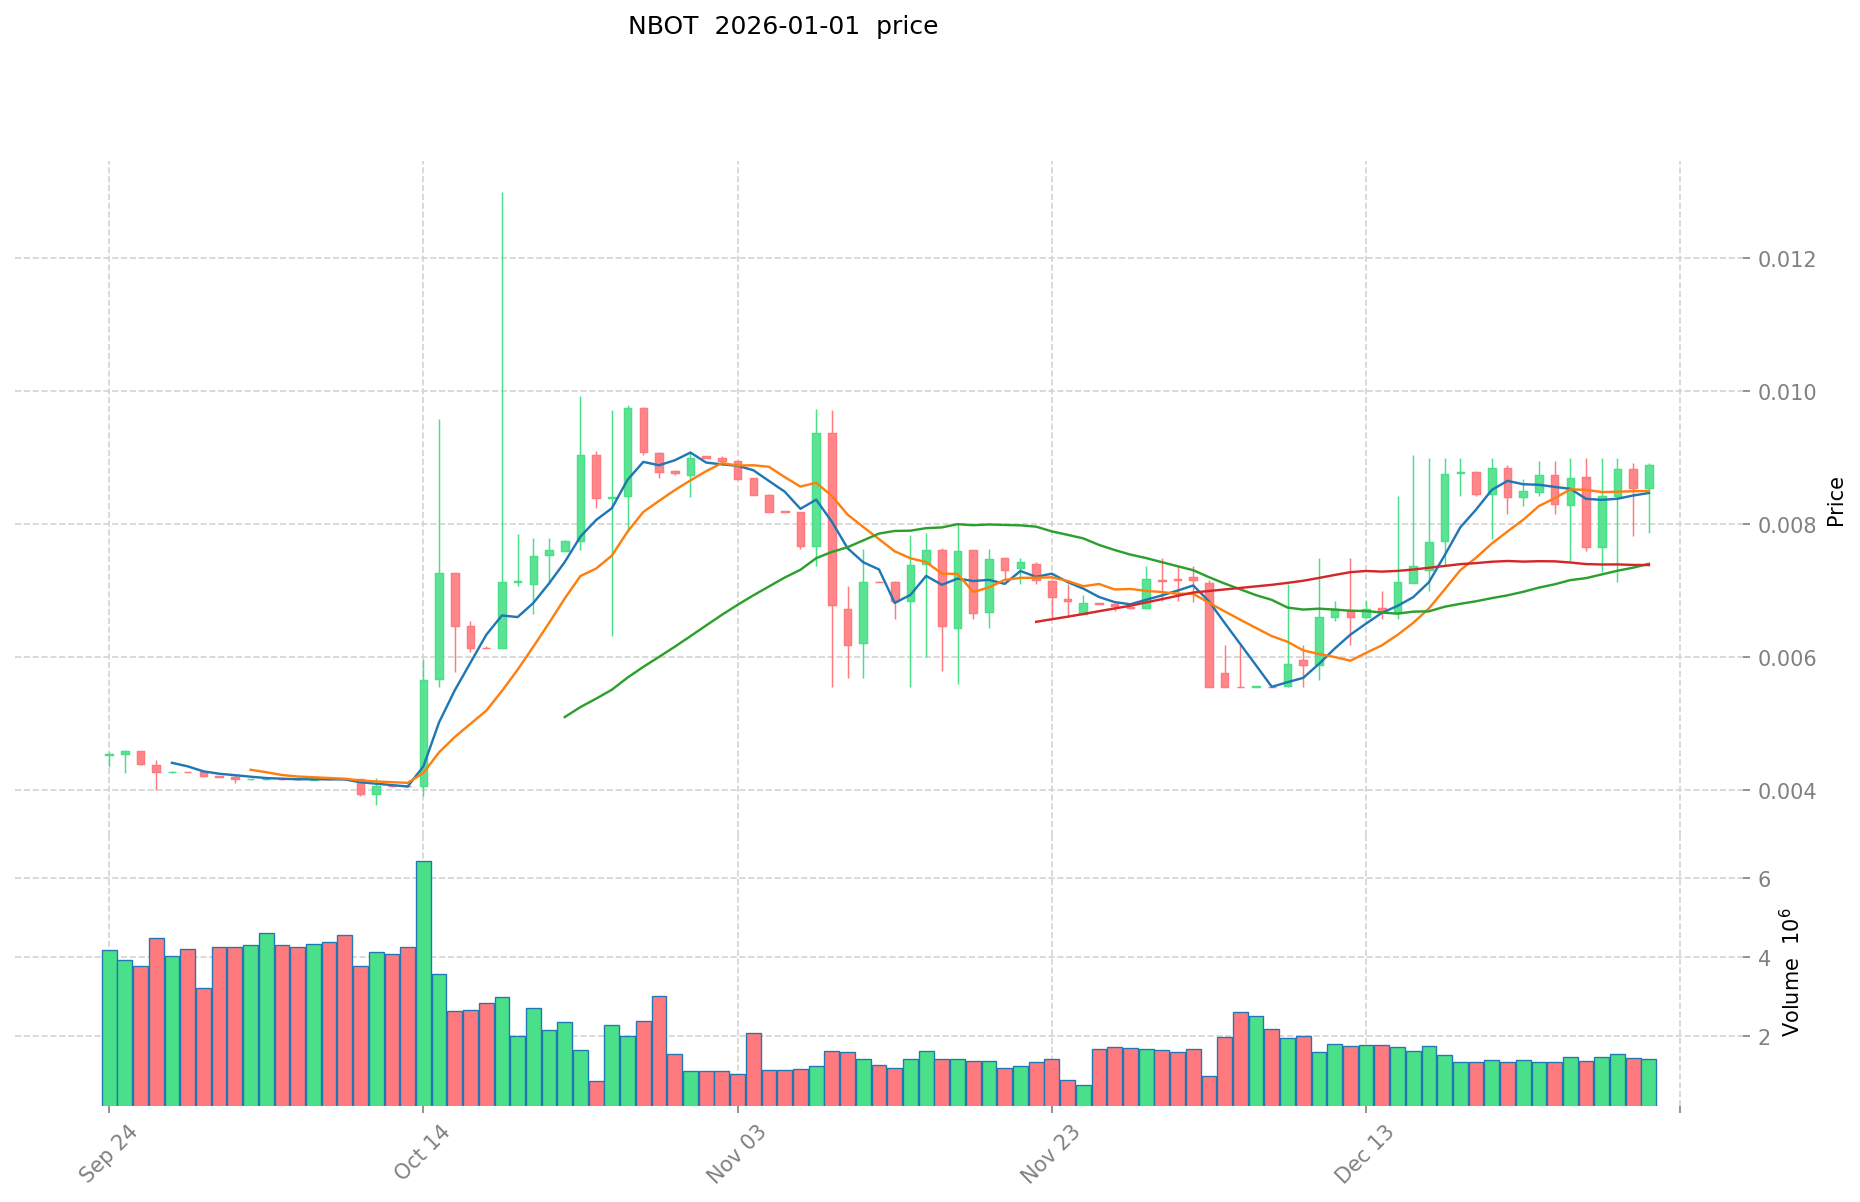
- June 2019: NBOT reached its all-time high of $0.076389, driven by the launch of the Naka chain independent blockchain platform by the Bodhi team in January 2019.
- March 2020: NBOT hit its all-time low of $0.00190929, coinciding with broader cryptocurrency market downturns.
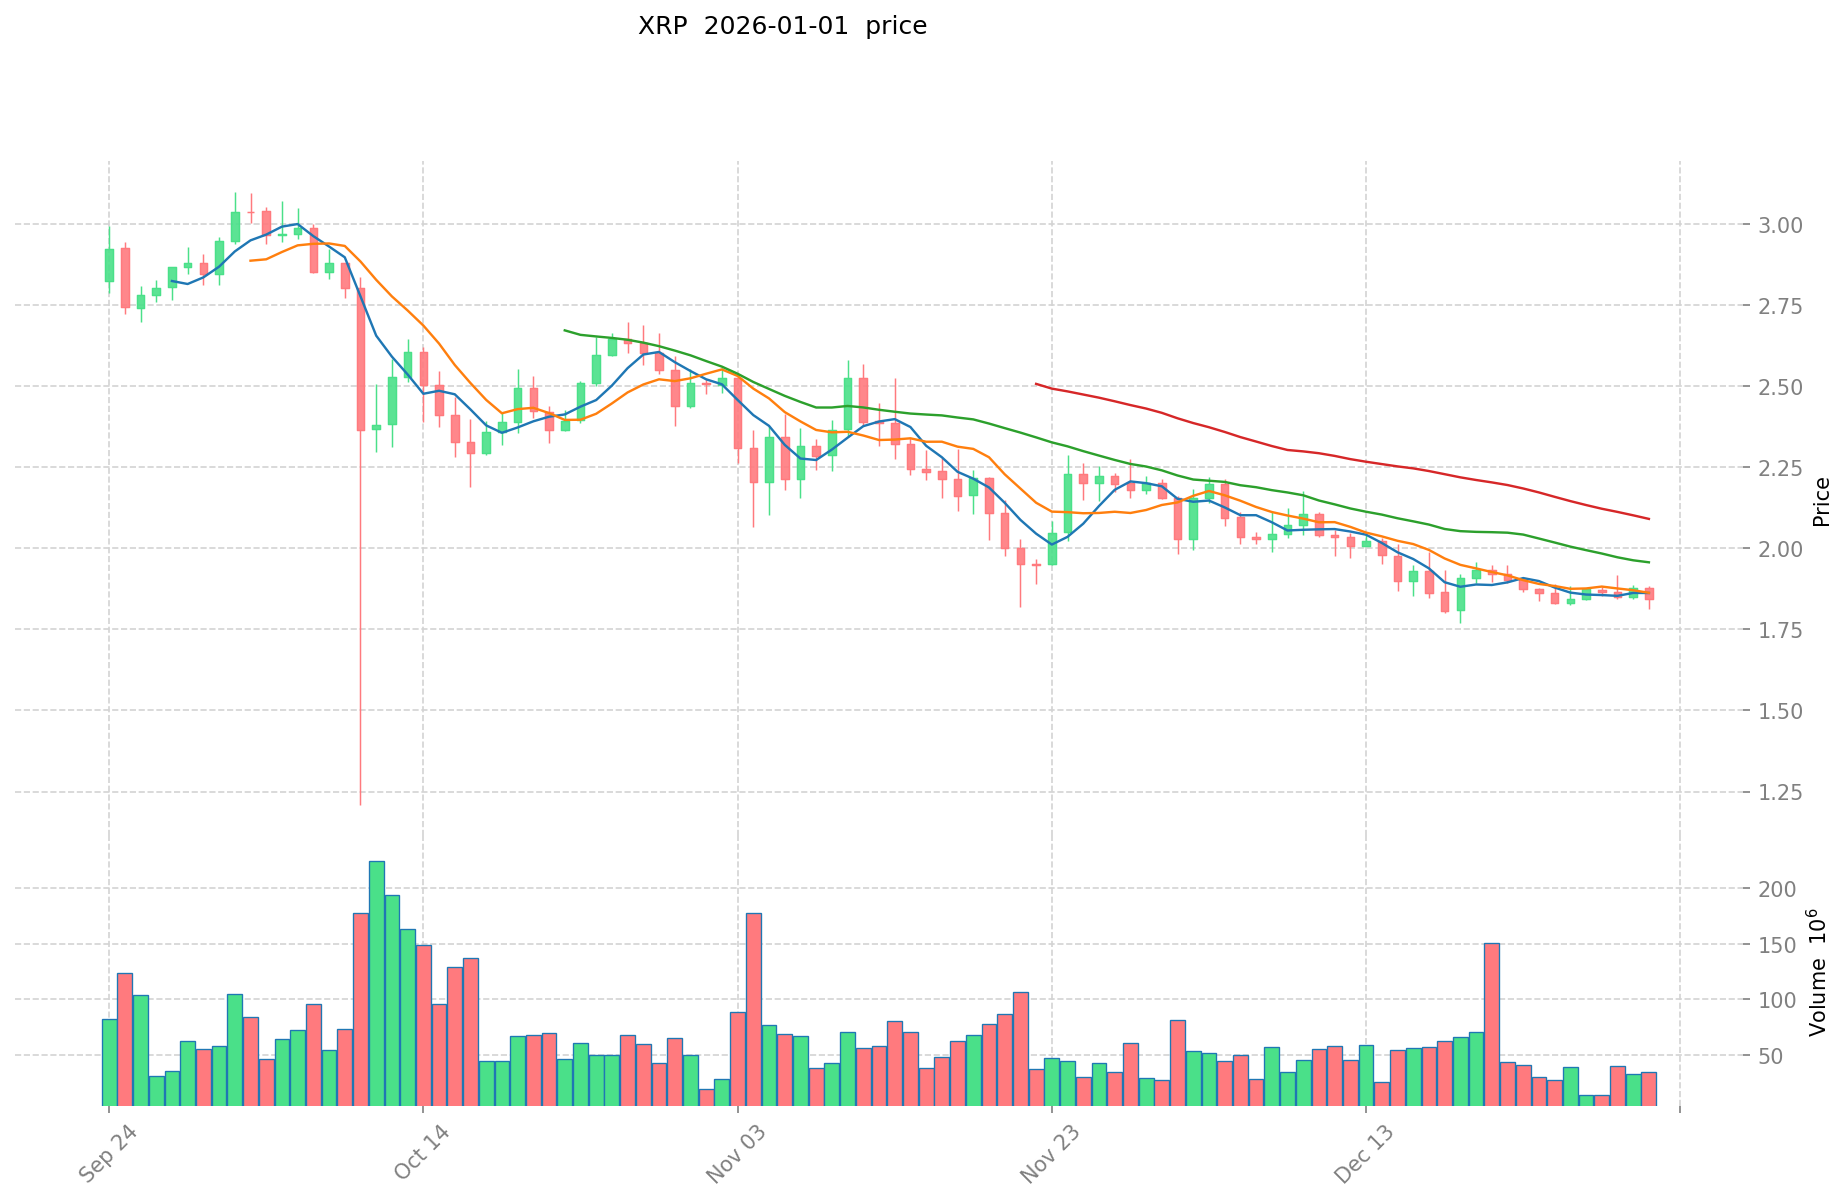
- July 2025: XRP reached its all-time high of $3.65, driven by improved regulatory sentiment and increased institutional interest.
- May 2014: XRP hit its all-time low of $0.00268621 during the early stages of cryptocurrency market development.
- Comparative analysis: Over the past seven years, NBOT declined from its peak of $0.076389 to its current price of $0.008452, representing an 89.0% depreciation. In contrast, XRP demonstrated greater resilience, declining from its 2025 high of $3.65 to the current price of $1.862, reflecting a 49.0% pullback from recent highs.
Current Market Status (02 January 2026)
- NBOT current price: $0.008452.
- XRP current price: $1.862.
- 24-hour trading volume: NBOT $12,009.39 vs XRP $60,398,863.05.
- Market sentiment index (Fear & Greed Index): 20 (Extreme Fear).
Click to view real-time prices:
XRP Investment Value Analysis
II. Core Factors Influencing NBOT vs XRP Investment Value
Supply Mechanism Comparison (Tokenomics)
-
XRP: XRP was launched in June 2012 with an initial supply model where 80% of XRP tokens were allocated to OpenCoin (later renamed Ripple). Ripple Labs maintains significant XRP holdings in escrow accounts and releases tokens periodically to the market. This controlled release mechanism helps stabilize prices while potentially enabling price appreciation or depreciation depending on market conditions and release schedules.
-
📌 Historical Pattern: Ripple's control over token supply has created periods of price stability, though periodic releases can exert downward pressure. The escrow management approach differs significantly from fixed-supply or deflationary models, creating unique price dynamics tied to corporate decisions rather than purely algorithmic mechanisms.
Institutional Adoption and Market Application
-
Institutional Holdings: XRP has attracted institutional interest primarily through ETF approval prospects. However, XRP's valuation remains heavily dependent on ETF approval timelines rather than fundamental adoption metrics. In contrast, some market participants have noted that valuations of competing assets are more closely tied to actual utility and ecosystem growth.
-
Enterprise Adoption: XRP is specifically designed for cross-border payment facilitation through the Ripple protocol. The platform targets collaboration with financial institutions to improve global payment systems. Strategic partnerships with entities like American Express and Banco Santander have historically driven demand. However, XRP ledger adoption rates remain limited, with most Ripple stablecoin growth occurring off-chain rather than on-chain.
-
Regulatory Environment: XRP's investment thesis has been significantly shaped by SEC litigation. In December 2020, the SEC sued Ripple Labs, alleging XRP was an unregistered security, causing exchange delistings and price declines. The 2023 court ruling that XRP sold through exchanges or automated methods is not a security provided positive momentum. However, ongoing regulatory uncertainty continues to influence investor confidence.
Technology Development and Ecosystem Building
-
XRP Technical Infrastructure: XRP uses the Ripple Consensus Protocol, which is neither Proof of Work (like Bitcoin) nor Proof of Stake (like Ethereum). This consensus mechanism differs fundamentally from traditional blockchain validation methods. XRP transactions are characterized by fast settlement speeds and extremely low transaction fees, positioning the network for cross-border payment applications.
-
Ecosystem Comparison: XRP's ecosystem remains focused primarily on payment infrastructure rather than DeFi, NFT, or smart contract development. Network activity metrics have shown decline, with transaction fees reaching multi-year lows and derivatives interest dropping sharply. This indicates weakening demand and suggests potential for further price correction without positive catalysts.
Macroeconomic Factors and Market Cycles
-
Inflation-Resistant Properties: XRP's utility as a cross-border payment settlement tool may provide some hedge characteristics during inflationary environments. However, its value proposition is more closely tied to international transaction demand and currency volatility rather than serving as a traditional inflation hedge like assets with fixed supplies or deflationary mechanisms.
-
Monetary Policy Impact: XRP has shown sensitivity to broader crypto market movements influenced by Federal Reserve policy. Bitcoin spot ETF inflows (exceeding $2.8 billion observed in certain periods) and general institutional asset allocation decisions affect XRP's price movements. Changes in interest rate environments and USD strength index fluctuations impact cross-border payment demand, which directly affects XRP utility.
-
Geopolitical Considerations: XRP's core value proposition—improving international remittance services and cross-border transaction efficiency—becomes more relevant during periods of heightened geopolitical tension or financial system stress. However, regulatory clarity from major jurisdictions remains critical for sustained institutional participation in cross-border payment applications.
III. 2026-2031 Price Prediction: NBOT vs XRP
Short-term Prediction (2026)
- NBOT: Conservative $0.0044-$0.0085 | Optimistic $0.0085-$0.0097
- XRP: Conservative $1.43-$1.86 | Optimistic $1.86-$2.51
Medium-term Prediction (2027-2029)
- NBOT may enter accumulation phase, expected price range $0.0073-$0.0178
- XRP may enter growth phase, expected price range $1.53-$4.86
- Key drivers: institutional capital inflows, ETF approvals, ecosystem development
Long-term Prediction (2030-2031)
- NBOT: Base scenario $0.0097-$0.0150 | Optimistic scenario $0.0150-$0.0179
- XRP: Base scenario $3.21-$5.13 | Optimistic scenario $5.13-$6.14
View detailed price prediction for NBOT and XRP
NBOT:
| 年份 |
预测最高价 |
预测平均价格 |
预测最低价 |
涨跌幅 |
| 2026 |
0.0096558 |
0.00847 |
0.0044044 |
0 |
| 2027 |
0.01178177 |
0.0090629 |
0.007794094 |
7 |
| 2028 |
0.0137574822 |
0.010422335 |
0.00614917765 |
23 |
| 2029 |
0.017772165642 |
0.0120899086 |
0.00725394516 |
43 |
| 2030 |
0.01537896823463 |
0.014931037121 |
0.00970517412865 |
76 |
| 2031 |
0.017882903159821 |
0.015155002677815 |
0.008789901553132 |
79 |
XRP:
| 年份 |
预测最高价 |
预测平均价格 |
预测最低价 |
涨跌幅 |
| 2026 |
2.5137 |
1.862 |
1.43374 |
0 |
| 2027 |
3.2598965 |
2.18785 |
1.531495 |
17 |
| 2028 |
4.03133241 |
2.72387325 |
1.6615626825 |
46 |
| 2029 |
4.8637480752 |
3.37760283 |
1.8914575848 |
81 |
| 2030 |
6.139806424374 |
4.1206754526 |
3.214126853028 |
121 |
| 2031 |
5.54066021356596 |
5.130240938487 |
4.71982166340804 |
175 |
IV. Investment Strategy Comparison: NBOT vs XRP
Long-term vs Short-term Investment Strategy
- NBOT: Suitable for investors focusing on emerging DeFi ecosystem potential and synthetic asset trading opportunities, with tolerance for higher volatility and longer accumulation phases
- XRP: Suitable for investors seeking exposure to established payment infrastructure with institutional adoption prospects and relatively lower volatility compared to smaller-cap altcoins
Risk Management and Asset Allocation
- Conservative Investors: NBOT 5-10% vs XRP 40-50%
- Aggressive Investors: NBOT 20-30% vs XRP 20-30%
- Hedging Tools: Stablecoin allocation (20-40%), options strategies for downside protection, cross-asset diversification with Bitcoin and Ethereum
V. Potential Risk Comparison
Market Risk
- NBOT: Extremely low trading volume ($12,009.39 daily) creates severe liquidity risk and potential slippage on large orders; 89% depreciation from all-time highs indicates sustained downward pressure; limited market recognition increases abandonment risk
- XRP: Price volatility tied heavily to regulatory developments and ETF approval timelines rather than fundamental adoption metrics; institutional interest dependency creates valuation fragility; recent 49% pullback from 2025 highs signals consolidation or potential further correction
Technology Risk
- NBOT: Network activity metrics unreported; ecosystem development status unclear; Naka blockchain adoption remains unverified; scalability and security benchmarks not established
- XRP: Ripple Consensus Protocol differs from industry-standard mechanisms, creating unique attack surface; limited smart contract capabilities restrict ecosystem expansion; declining transaction volumes and near-zero fee environment suggest network utilization stress
Regulatory Risk
- NBOT: Regulatory classification ambiguous; decentralized finance nature may face increased scrutiny in major jurisdictions; synthetic asset trading capabilities could trigger securities or derivatives regulations
- XRP: SEC litigation history created uncertainty; 2023 court ruling provided partial relief but ongoing regulatory ambiguity remains; different jurisdictions apply inconsistent classification standards; cross-border payment focus subject to evolving international money transmission regulations
VI. Conclusion: Which Is the Better Buy?
📌 Investment Value Summary
- NBOT Advantages: Emerging DeFi ecosystem potential; lower entry price enabling larger token accumulation; predicted 79% appreciation through 2031; focus on synthetic asset innovation represents underexplored market niche
- XRP Advantages: Established payment infrastructure with proven transaction capabilities (3-second settlement, $0.0002 fees, 1,500+ tps); institutional adoption pathway through ETF prospects; historical resilience with 49% pullback versus NBOT's 89% decline; predicted 175% appreciation through 2031; strategic partnerships with major financial institutions provide credibility
✅ Investment Recommendations
- Beginner Investors: Allocate 60-70% to XRP for established infrastructure exposure and lower volatility, reserve 30-40% in stablecoins for averaging into positions during market downturns; avoid NBOT due to extreme illiquidity and higher technical complexity
- Experienced Investors: Consider 40-50% XRP allocation for institutional adoption thesis; allocate 10-20% to NBOT as higher-risk/higher-reward position during accumulation phases; implement stop-loss orders at 15-20% below entry given market volatility; rebalance quarterly based on regulatory developments
- Institutional Investors: Focus on XRP given ETF approval prospects and established compliance frameworks; monitor NBOT ecosystem development for potential future institutional-grade opportunities; maintain liquidity buffers due to current extreme fear sentiment (Fear & Greed Index: 20)
⚠️ Risk Disclaimer: Cryptocurrency markets exhibit extreme volatility. NBOT shows severe liquidity constraints and unproven ecosystem fundamentals. XRP faces ongoing regulatory uncertainty despite recent positive developments. This analysis does not constitute investment advice. Investors must conduct independent research and consult qualified financial advisors before making investment decisions.
FAQ
NBOT和XRP分别是什么?它们的主要用途有什么区别?
NBOT是智能合约平台代币,用于自动化交易执行。XRP是瑞波币,主要用于跨境支付和银行汇款结算。两者用途不同:NBOT面向智能合约应用,XRP专注于国际转账。
NBOT和XRP在技术架构上有什么差异?
NBOT是去中心化区块链技术,采用分布式账本架构。XRP则是基于eBPF框架的内核级存储解决方案。两者技术方向完全不同,NBOT专注链上交易,XRP专注存储优化。
NBOT和XRP哪个更适合投资?风险和潜力分别如何?
XRP作为支付网络代币,基础稳定但增长空间有限。NBOT作为新兴项目,潜力大但波动性高。XRP适合保守投资者,NBOT适合风险承受能力强的投资者。
NBOT和XRP在交易速度和成本上如何对比?
NBOT基于优化的网络架构,交易速度更快、手续费更低。XRP虽然知名度高,但交易成本相对较高。NBOT在速度和成本效率上具有明显优势。
NBOT和XRP的应用场景分别是什么?
NBOT主要应用于智能合约和去中心化应用开发,支持复杂的链上计算。XRP主要用于跨境支付和高频交易额结算,可处理高达1500笔每秒的交易。
* The information is not intended to be and does not constitute financial advice or any other recommendation of any sort offered or endorsed by Gate.


