# Article Overview: NVIR vs ENJ Comprehensive Comparison
This article delivers an in-depth investment analysis comparing NvirWorld (NVIR) and Enjin Coin (ENJ), two leading blockchain gaming tokens with distinct market positioning. It addresses critical investor questions by examining historical price trends, tokenomics, ecosystem development, and 2026-2031 price forecasts for both assets. The guide suits beginner to institutional investors seeking data-driven allocation strategies within the gaming token sector. Structured across six core sections—price history, investment factors, price predictions, strategies, risks, and recommendations—this analysis on Gate provides actionable insights for portfolio construction. Whether evaluating NVIR's extreme recovery potential or ENJ's established liquidity advantages, readers gain comprehensive frameworks for informed decision-making in volatile cryptocurrency markets.
Introduction: NVIR vs ENJ Investment Comparison
In the cryptocurrency market, comparisons between NVIR and ENJ have always been a topic that investors cannot avoid. The two not only show significant differences in market cap ranking, application scenarios, and price performance, but also represent different positioning of crypto assets.
NvirWorld (NVIR): Since its launch in 2022, it has gained market recognition by focusing on next-generation Web3 game studios and marketplaces that build and distribute games ranging from hypercasual to AAA titles across web, desktop, and mobile platforms, with a mission to serve as a gateway for non-crypto native users to participate in the Web3 movement.
Enjin Coin (ENJ): Since its establishment in 2009 as the largest online game community creation platform headquartered in Singapore, it has been recognized for transforming the gaming community ecosystem through blockchain technology, allowing players, content creators, and game publishers to add virtual goods and provide value for games and communities.
This article will conduct a comprehensive analysis of the investment value comparison between NVIR and ENJ from the perspectives of historical price trends, supply mechanisms, community adoption, and technological ecosystems, and attempt to answer the question that investors care most about:
"Which is the better buy right now?"
I. Price History Comparison and Current Market Status
NvirWorld (NVIR) and Enjin Coin (ENJ) Historical Price Trends
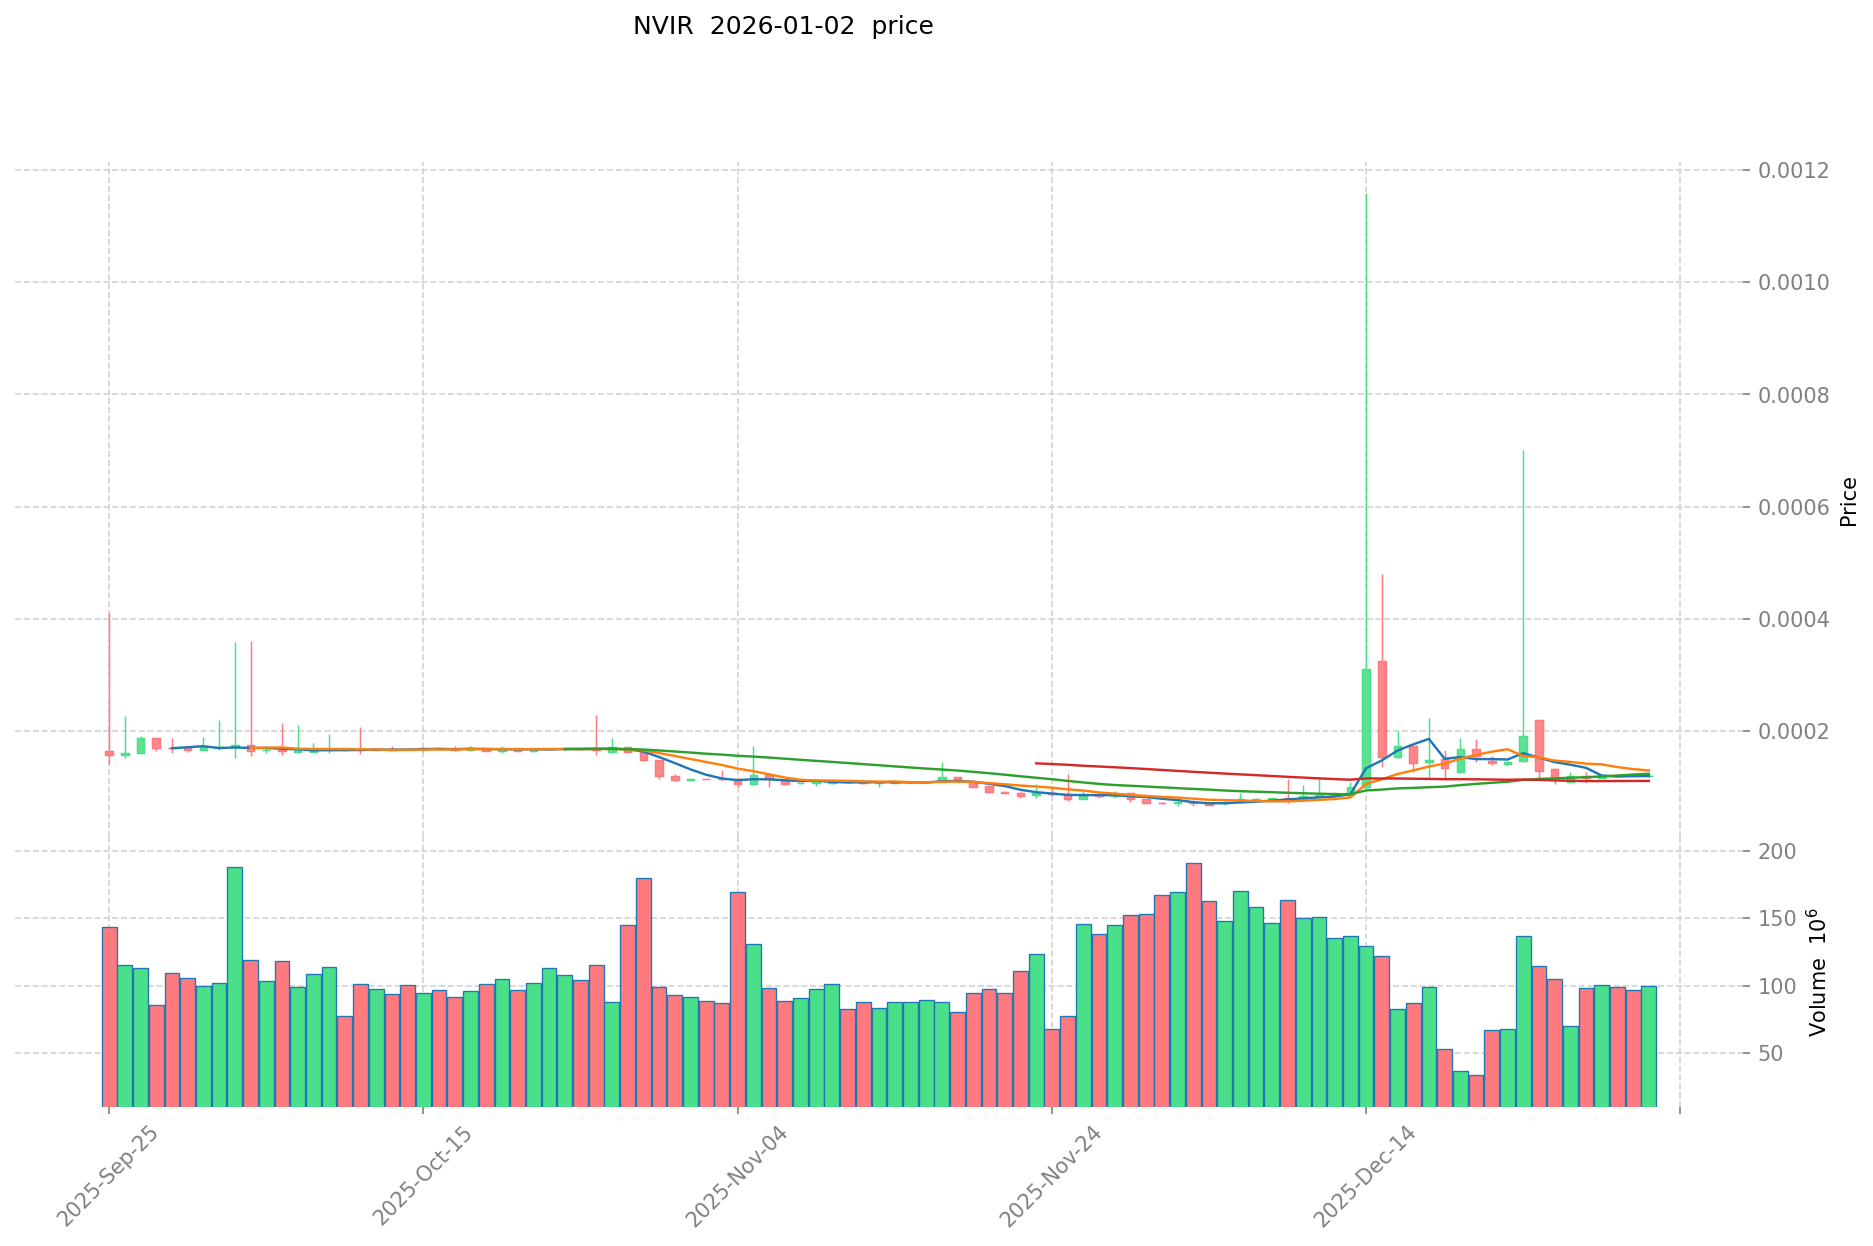
- March 2022: NvirWorld (NVIR) reached its all-time high of $1.67, driven by the initial momentum of the Web3 gaming platform narrative.
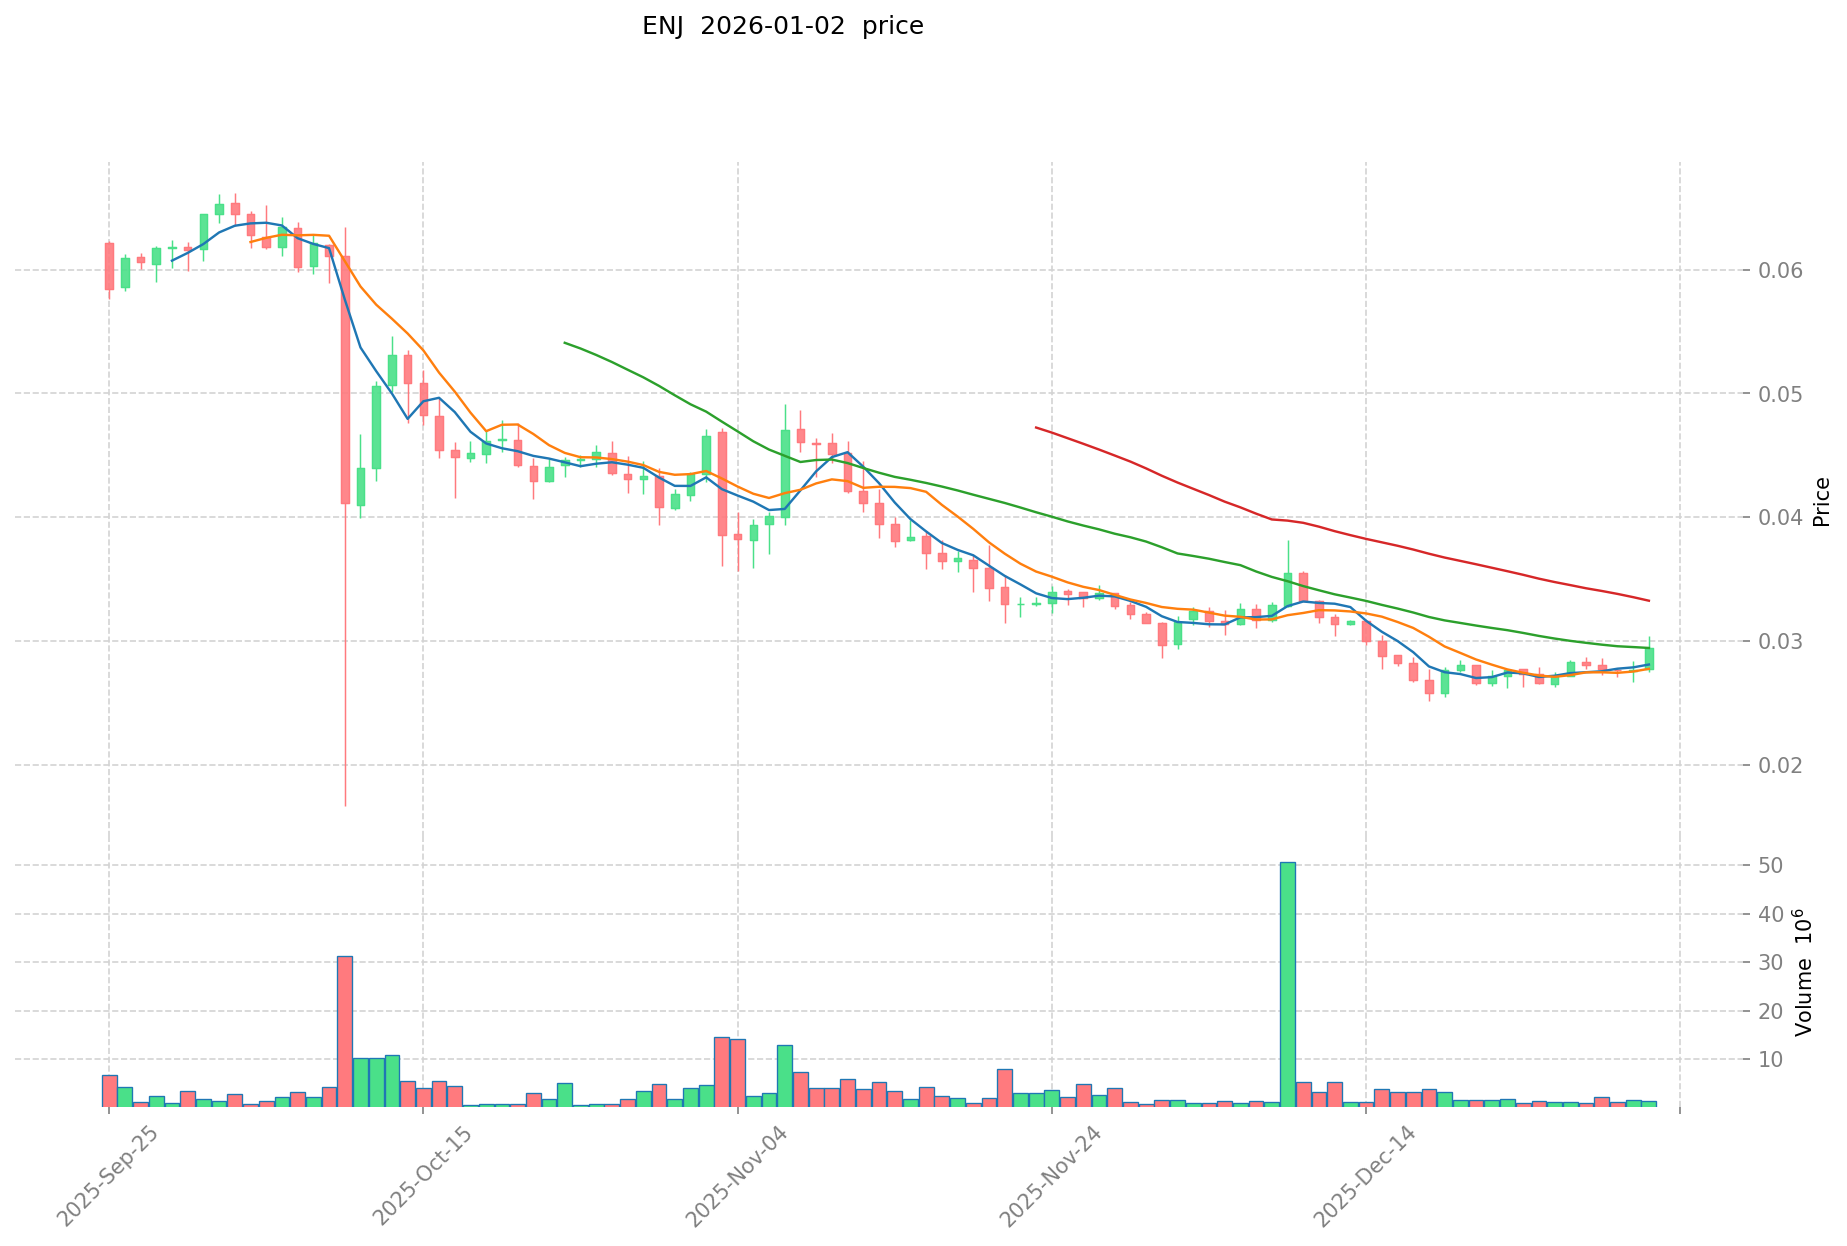
- November 2021: Enjin Coin (ENJ) achieved its all-time high of $4.82, reflecting peak market sentiment during the broader cryptocurrency bull market and NFT ecosystem expansion.
- Comparative analysis: From March 2022 to January 2026, NVIR declined from $1.67 to approximately $0.00012, representing a 99.99% loss. Over the same period, ENJ declined from $4.82 to approximately $0.0292, representing a 99.39% loss. Both tokens experienced significant downturns, though ENJ has demonstrated relatively greater price resilience in absolute percentage terms.
Current Market Status (January 2, 2026)
- NvirWorld (NVIR) current price: $0.00011963.
- Enjin Coin (ENJ) current price: $0.02924.
- 24-hour trading volume: NVIR $11,933.61 vs ENJ $47,032.01.
- Fear & Greed Index: 28 (Fear).
View real-time prices:
II. Core Factors Affecting NVIR vs ENJ Investment Value
Supply Mechanism Comparison (Tokenomics)
- NVIR: Total supply of 10,698,691,797 tokens with a fixed supply model that directly impacts price and investment value. Historical supply changes have triggered NVIR price volatility
- ENJ: Investment value depends on market demand and technological development
- 📌 Historical Pattern: Scarcity serves as core support for long-term investments. Supply mechanism changes drive price cycle fluctuations
Institutional Adoption and Market Application
The reference material does not provide sufficient information regarding institutional holdings, enterprise adoption in cross-border payments, settlement applications, or comparative policy stances by different countries for these two assets. This section is omitted pending additional data.
Technology Development and Ecosystem Building
The reference material does not contain specific details about NVIR's technical upgrades, ENJ's technology development roadmap, or comparative ecosystem metrics (DeFi, NFT, payment, and smart contract deployment). This section is omitted pending additional data.
Macroeconomic Environment and Market Cycles
The reference material indicates that NVIR price key factors include supply mechanisms, overall economic environment, and ecosystem construction. However, specific analysis regarding inflation resistance, monetary policy impacts (interest rates, USD index), geopolitical factors, and cross-border transaction demand is not available in the provided sources. This section is omitted pending additional data.
III. 2026-2031 Price Forecast: NVIR vs ENJ
Short-term Forecast (2026)
- NVIR: Conservative $0.0000636688-$0.00012244 | Optimistic $0.00012244-$0.0001616208
- ENJ: Conservative $0.0172457-$0.02923 | Optimistic $0.02923-$0.0385836
Mid-term Forecast (2027-2029)
- NVIR may enter accumulation phase, with predicted price range $0.000116464928-$0.000242360141946
- ENJ may enter growth phase, with predicted price range $0.019665944-$0.060107347263
- Key drivers: institutional capital inflows, ETF expansion, ecosystem development
Long-term Forecast (2030-2031)
- NVIR: Base scenario $0.000181973814337-$0.000242631752449 | Optimistic scenario $0.000280510971186-$0.000320273913233
- ENJ: Base scenario $0.042635718698645-$0.058046219433095 | Optimistic scenario $0.06472410308469-$0.069075001125383
View detailed price predictions for NVIR and ENJ
NVIR:
| 年份 |
预测最高价 |
预测平均价格 |
预测最低价 |
涨跌幅 |
| 2026 |
0.0001616208 |
0.00012244 |
0.0000636688 |
2 |
| 2027 |
0.000171856784 |
0.0001420304 |
0.000116464928 |
18 |
| 2028 |
0.00017734625896 |
0.000156943592 |
0.0000863189756 |
31 |
| 2029 |
0.000242360141946 |
0.00016714492548 |
0.000157116229951 |
39 |
| 2030 |
0.000280510971186 |
0.000204752533713 |
0.000108518842867 |
71 |
| 2031 |
0.000320273913233 |
0.000242631752449 |
0.000181973814337 |
102 |
ENJ:
| 年份 |
预测最高价 |
预测平均价格 |
预测最低价 |
涨跌幅 |
| 2026 |
0.0385836 |
0.02923 |
0.0172457 |
0 |
| 2027 |
0.04577418 |
0.0339068 |
0.019665944 |
15 |
| 2028 |
0.0454181586 |
0.03984049 |
0.031872392 |
36 |
| 2029 |
0.060107347263 |
0.0426293243 |
0.031971993225 |
45 |
| 2030 |
0.06472410308469 |
0.0513683357815 |
0.042635718698645 |
75 |
| 2031 |
0.069075001125383 |
0.058046219433095 |
0.040632353603166 |
98 |
IV. Investment Strategy Comparison: NVIR vs ENJ
Long-term vs Short-term Investment Strategy
- NVIR: Suitable for investors focused on early-stage Web3 gaming ecosystem participation and those betting on recovery from extreme price lows, with extended accumulation phases expected through 2029
- ENJ: Suitable for investors seeking relatively established gaming community infrastructure and those looking for tokens with demonstrated price resilience and stronger trading liquidity
Risk Management and Asset Allocation
- Conservative investors: NVIR 5% vs ENJ 15%
- Aggressive investors: NVIR 20% vs ENJ 25%
- Hedging tools: Stablecoin allocation for 60% of portfolio, options strategies for downside protection, cross-asset diversification including BTC/ETH correlation plays
V. Potential Risk Comparison
Market Risk
- NVIR: Extreme price volatility with 99.99% historical decline from all-time high; significantly lower trading volume ($11,933.61 daily) creates liquidity constraints and increased slippage risk for larger positions
- ENJ: Despite 99.39% historical decline, maintains relatively higher trading volume ($47,032.01 daily) and established market recognition, though still subject to broader cryptocurrency market cycles and sentiment shifts
Technology Risk
- NVIR: Unproven long-term technical sustainability for Web3 gaming platform infrastructure; limited ecosystem development data available for assessment
- ENJ: Dependency on continued blockchain gaming adoption rates and community creator platform engagement; potential obsolescence if gaming industry standards shift away from NFT-based models
Regulatory Risk
- Global regulatory policies present asymmetric impacts: stricter NFT and gaming asset regulations in major markets (EU, US) could disproportionately affect ENJ's community gaming model; NVIR's focus on Web3 game studios may face platform distribution restrictions on traditional app stores; both tokens face ongoing classification uncertainty regarding securities vs utility status across jurisdictions
VI. Conclusion: Which Is the Better Buy?
📌 Investment Value Summary
- NVIR advantages: Positioned at extreme valuation lows with 102% predicted upside by 2031; direct exposure to emerging Web3 gaming studio ecosystem; potential for significant absolute price recovery if platform adoption accelerates
- ENJ advantages: Established market presence since 2009 with recognized gaming community platform; demonstrated relative price resilience (99.39% vs 99.99% decline); higher trading liquidity reducing execution risk; clearer tokenomics tied to gaming ecosystem utility
✅ Investment Recommendations
- Beginner investors: Start with ENJ allocation (70-80% of gaming exposure) due to higher liquidity, established reputation, and lower technical risk; allocate remainder to NVIR only if comfortable with extreme volatility and extended recovery timelines
- Experienced investors: Implement tactical NVIR position sizing (10-20% of risk capital) for potential recovery play while maintaining ENJ core allocation (25-35%) for stability; use dollar-cost averaging strategy across 24-36 month accumulation phases to manage downside volatility
- Institutional investors: Conduct comprehensive due diligence on Web3 gaming ecosystem development before material NVIR allocation; consider ENJ for portfolio diversification within gaming/NFT sector allocations; maintain significant stablecoin hedges given market risk environment (Fear & Greed Index: 28)
⚠️ Risk Disclaimer: The cryptocurrency market exhibits extreme volatility. Both NVIR and ENJ have experienced severe price declines from historical highs. This analysis does not constitute investment advice. Investors should conduct independent research and consult financial advisors before making investment decisions.
FAQ
NVIR和ENJ分别是什么?各自的主要用途和应用场景是什么?
NVIR是Nviro Protocol,主要用于去中心化金融应用。ENJ是Enjin Coin,专注于游戏和数字资产领域。两者都是区块链生态中的重要代币,分别服务于DeFi和游戏产业。
NVIR和ENJ在技术架构、共识机制上有什么区别?
NVIR采用权益证明(PoS)共识机制,ENJ采用混合型工作量证明/权益证明(PoW/PoS)机制。ENJ交易速度更快,手续费更低。
从投资角度看,NVIR和ENJ的优势和风险分别是什么?
NVIR优势在于虚拟现实赛道潜力大,风险是市场波动性强。ENJ优势是社区基础牢固、游戏生态应用广,风险在于对游戏产业周期依赖度高。
NVIR和ENJ的生态发展现状如何?哪个项目的生态更成熟?
ENJ生态发展较为成熟,已建立完整的游戏资产生态体系,应用场景丰富。NVIR作为新兴项目,生态仍在构建阶段。总体而言,ENJ的生态成熟度更高。
NVIR和ENJ在NFT和游戏领域的应用前景对比如何?
ENJ已在游戏NFT领域建立成熟生态体系,市场地位稳固。NVIR侧重AI神经网络技术,属新兴方向。ENJ短期应用前景更明确,NVIR长期潜力待挖掘。两者各有优势,选择需根据投资者风险偏好而定。
NVIR和ENJ的代币经济模型有什么不同?流通量和总量分别是多少?
NVIR和ENJ代币经济模型差异显著。NVIR流通量1亿枚,总量1亿枚。ENJ具有通缩机制,流通量约7.6亿枚,总量10亿枚。两者供应机制和应用场景不同。
* The information is not intended to be and does not constitute financial advice or any other recommendation of any sort offered or endorsed by Gate.